

Graphical abstract
Keywords: Multi-omics, Integration, Translational medicine, Challenges
Abstract
The emerging high-throughput technologies have led to the shift in the design of translational medicine projects towards collecting multi-omics patient samples and, consequently, their integrated analysis. However, the complexity of integrating these datasets has triggered new questions regarding the appropriateness of the available computational methods. Currently, there is no clear consensus on the best combination of omics to include and the data integration methodologies required for their analysis. This article aims to guide the design of multi-omics studies in the field of translational medicine regarding the types of omics and the integration method to choose. We review articles that perform the integration of multiple omics measurements from patient samples. We identify five objectives in translational medicine applications: (i) detect disease-associated molecular patterns, (ii) subtype identification, (iii) diagnosis/prognosis, (iv) drug response prediction, and (v) understand regulatory processes. We describe common trends in the selection of omic types combined for different objectives and diseases. To guide the choice of data integration tools, we group them into the scientific objectives they aim to address. We describe the main computational methods adopted to achieve these objectives and present examples of tools. We compare tools based on how they deal with the computational challenges of data integration and comment on how they perform against predefined objective-specific evaluation criteria. Finally, we discuss examples of tools for downstream analysis and further extraction of novel insights from multi-omics datasets.
1. Introduction
The data generation storm that the biomedical community experiences over the last two decades have led to new requirements for data analysis. Specialised analytics per data layer, multisource data integration and disease/group/patient profiling are needed to capture the systemic properties of the investigated condition. Biology can be viewed as data science, and Medicine is moving towards a precision and personalised mode. Computer science has set its own vision to achieve connectivity in the road map from data to information and from knowledge to wisdom. Biology meets Medicine in a virtual space called Translational Research, where the findings from Biology are directly investigated for their application in clinical practice (translation of the findings to clinical applications). The needs of Medicine are directly guiding specific biological experiments (translation of the medical needs to biological research). In this virtual space of translational research, other disciplines also contribute to the interconnection from bench to bedside. A significant player among them is the discipline of bioinformatics and especially a relatively new approach, named Systems Bioinformatics, which focuses on integrating information across different levels using a bottom-up approach as in systems biology with a data-driven top-down approach as in bioinformatics.
Focusing on the molecular part of the story, the advent of high-throughput technologies has given rise to omics from various levels, to name a few: genomics, transcriptomics, proteomics, metabolomics, metagenomics, epigenomics, epitranscriptomics, etc. The complexity increases if we realise that most of these omics may have a spatial and/or temporal character. It is anticipated that the combination of several of these omics will generate a more comprehensive molecular profile either of the disease or of each specific patient. This molecular profile is expected to act as a stepping stone in several highly ambitious objectives, such as the computer-aided diagnosis/prognosis, the identification of disease subtypes, the detection of complex molecular patterns associated with disease, the understanding of regulatory processes involved in disease pathogenesis and the prediction of the response to drug treatment.
Nevertheless, there are still several questions discussed within labs when designing new experiments or within research consortia that are preparing to submit a comprehensive grant proposal for a research project: What is the best combination of omics to include in a new study under the restrictions of the budget? What are the recommended computational methods and tools for multi-omics data integration? Are there any existing real data repositories that are publicly available, and perhaps they could be used to generate preliminary results? Finally, there is a crucial point to mention: to make this new direction of multi-omics data integration adoptable by the users, it needs to be explainable, which is seen already as a trend in another related field, namely the explainable Artificial Intelligence [1].
There are two potential approaches for multi-omics data analysis [2]. The first approach looks at various analytes across the different omics layers in the context of pathways and mechanisms. In practice, this approach might use knowledge from different databases to put the different components of the disease pathology together. The objectives are mainly to gain disease insights, and identify key molecular players involved in the disease pathogenesis, gene prioritisation and drug repurposing. For example, in a recent work, we presented a method to integrate multi-source data in a single network [3]. This synthetic gene-to-gene network has both nodal information and edge resolution representing the integration of any available a priori information for a disease, from different databases. A second and more demanding approach is the integration of multi-omics datasets collected from the same set of patient samples (multi-view datasets). This type of analysis looks for correlations across multiple datasets, to discover patterns of co-varying features, and thus to help understand the implicated dysregulated mechanisms in the disease sample set.
We underline that the integrative analysis of multi-omics data collected from the same samples can significantly facilitate patient-specific question answering and contribute to the personalised and precision medicine vision. This review focuses on studies where multi-omics data integration (DI) refers to datasets collected from the same patients and not from multiple omics sources. This work aims to provide guidance on the design of multi-omics experiments depending on the objectives of each study. The paper summarises multi-omics studies, the types of omics used, and available analysis methodologies and tools based on the objectives.
The specific questions we aim to answer through this review are the following:
-
•
What are the scientific objectives that benefit from multi-omics studies?
-
•
What types of omics do multi-omics studies combine for their scientific objectives?
-
•
What computational methods are used to achieve the specified scientific objectives?
-
•
What are the general and objective-specific DI challenges and criteria that DI tools need to meet?
-
•
What are the pros and cons of different methods against the pre-defined DI challenges and criteria?
Based on the initial evaluation of recent multi-omics studies, we select to focus on three objectives to describe and evaluate computational tools: subtype identification, the detection of disease-associated molecular patterns and the understanding of regulatory processes. These key objectives have been approached by intermediate integration approaches more frequently. In intermediate integration specialised methods aim to learn joint representations of the separate datasets that can be used for subsequent tasks [4]. We thus discuss methods used to approach these key objectives and we highlight the related state-of-the-art tools implementing these methods. We also explain how the different tools approach the data integration challenges identified for each objective. A qualitative evaluation of the DI methods found in the various studies took place under the prism of the identified computational challenges and objective-specific criteria.
2. Methods
We collected multi-omics studies from PubMed published in 2018–2021 (inclusive) that include the term ‘multi-omics’ in the title/abstract and the term ‘integration’ and ‘disease’ in the text focusing on human and animal diseases and related experiments.
We excluded studies:
-
•
That combined findings from omics data analysis collected from different groups of individuals
-
•
That did not combine different types of omics (for example studies combining only Single Nucleotide Variations (SNV) and Copy Number Variations (CNV) were not included)
-
•
That did not actually perform multi-omics analysis or computational data integration
The studies that fulfilled the inclusion criteria were selected and the following information was collected:
-
•
the investigated disease
-
•
the combination of omics data included in the study (Genomics, Epigenomics, Metabolomics, Metagenomics, Proteomics, Transcriptomics)
-
•
the objective(s) of the study
-
•
the applied computational method(s) for each objective
The collected scientific objectives were then organised by us into a group of main scientific objective categories, namely: (i) detect disease-associated molecular patterns, (ii) subtype identification, (iii) diagnosis/prognosis, (iv) drug response prediction, and (v) understand regulatory processes.
In practice, these scientific objectives are simultaneously present or they act in a synergistic complementarity: subtype identification might be used as an unsupervised method to identify patient subtypes that might correlate with different prognosis, understanding molecular mechanisms might be used as a downstream analysis of subtype identification to further identify mechanisms that differentiate patient groups. We choose to separate them, however, since they pose different computational problems and it is thus expected that they can be approached with different methods.
We obtained 673 records from our initial search in PubMed as described in the previous section. Following the inclusion criteria, we excluded 285 studies and the remaining 388 studies were included in the quantitative and qualitative analysis.
In the second part of the review, we focus on the main methodologies and tools adopted for the three main scientific objectives selected: (i) subtype identification, (ii) detection of disease-associated molecular patterns and (iii) understanding of regulatory processes. In order to be more inclusive in the collection of state-of-the-art tools to approach the selected scientific objectives, we made three additional PubMed queries. The queries included ‘multi-omics’ in the title/abstract and the term ‘integration’ and then: ‘subtype’ for the objective of ‘subtype identification’, ‘regulatory’ for the objective of understanding regulatory processes and ‘pattern’ for the objective of detecting disease-associated patterns. From these queries, we pick studies that developed new tools to approach the problem of data integration for each objective.
Finally in order to obtain a set of multi-omics data resources to suggest, we queried PubMed in the following way: Multiomics[ti] AND (resource*[ti] OR repositor*[ti] OR database*[ti]). We retrieved 42 results which were further post-filtered to keep only real multi-omics resources for Human/Animals. Also, some extra repositories were found through [5]. The results are shown in Table 1.
Table 1.
Multi-omics data resources.
| Name | Type | Omics content | Link | Species |
|---|---|---|---|---|
| Answer ALS [7] | Repository | whole-genome sequencing, RNA transcriptomics, ATAC-sequencing, proteomics. Also: deep clinical data, including fine motor activity, speech, breathing and linguistics/cognition | https://dataportal.answerals.org/ | Human |
| Fibromine [8] | Database | transcriptomics and proteomics | http://www.fibromine.com/Fibromine/ | Human/ Mouse |
| DevOmics [9] | Database | normalized gene expression, DNA methylation, histone modifications (H3K4me3, H3K9me3, H3K27me3, H3K27ac), chromatin accessibility and 3D chromatin architecture profiles of human and mouse early embryos spanning six developmental stages | http://devomics.cn | Human/ Mouse |
| The Cancer Genome Atlas (TCGA) [10] | Repository | genomics, epigenomics, transcriptomics, proteomics | https://portal.gdc.cancer.gov/ | Human |
| jMorp [11] | Database/ Repository | genomics, methylomics, transcriptomics, and metabolomics | https://jmorp.megabank.tohoku.ac.jp/ | Human |
| DriverDBv3 [12] | Database | somatic mutation, RNA expression, miRNA expression, methylation, copy number variation and clinical data in addition to annotation bases | http://driverdb.tms.cmu.edu.tw/ | Human |
| The Personal Genome Project-UK [83] | Repository | DNA methylation (bisulfite sequencing), whole genome sequencing, transcriptomics | https://www.personalgenomes.org.uk/ | Human |
| STATegra [13] | Repository | RNA-seq, microRNA-seq, ChIP-seq, RRBS, Dnase-seq, ATAC-seq, scRNA-seq, scATAC-seq, proteomics, metabolomics | https://opendata.lifebit.ai/table/stategra | Mouse |
| ColPortal [14] | Repository | Mehylation 450 k arrays, 16 S sequencing, expression arrays, microRNA arrays | https://colportal.imib.es/ | Human |
| The Omics Discovery Index [15] | Knowledge discovery framework | genomics, proteomics, transcriptomics and metabolomics | https://www.omicsdi.org/ | Multi species |
3. Highlighted objectives from multi-omics data integration studies
Subtype identification. Currently, diseases are being sub-classified by common histopathology features or patient clinical profiles and symptoms. Recently, several research studies have investigated new disease subtype classifications by finding associations through their similarities at the molecular level. Grouping by molecular features started at first by finding common genes with perturbed expression, but more recently multi-omic signatures are used to discover subtypes. Subtype identification can identify heterogeneous groups within cancer cohorts with differences in disease progression or response to treatment. The discovery of these subtypes can facilitate targeted and more effective treatments including biological drugs, hormonal therapy and immunotherapy.
Detect disease-associated molecular patterns. A common objective of multi-omics studies is to associate molecular markers with clinical markers or measurable traits established in clinical practice. Multi-omics datasets enable the coordinated discovery of disease-associated molecules leading to the output of the analysis being ‘patterns’ or `‘modules’ or `‘relationships’ between molecules as markers of disease. The patterns discovered, represent co-varying/correlated molecules or coordinated modules that can be used as disease/stage indicators and can be insightful in revealing disease-specific pathways and mechanisms.
Diagnosis/Prognosis. Multifactorial diseases are difficult to diagnose due to their complex genotype and phenotype. The classification into the different types is challenging for pathologists and the diagnostic procedures can be tedious and interventional. The main aim is to predict disease activity, severity and course of the disease using integrated molecular data. Instead of single molecule biomarkers, multi-omics studies adopt complex molecular signatures and patterns as indicators in the prediction task. This envisions giving more accurate predictions but comes with new challenges in including the new composite features in the prediction task.
Drug response prediction. The course of drug treatment and the related response to the delivered drug can vary among patients. Analysis of multi-omics datasets is used to increase the resolution in identifying the drug effects on specific cell lines or patient cells. Predicting whether a drug will work on a group of patients with a similar molecular profile is central to achieving personalised medicine.
Understand regulatory processes. Multi-omics data analysis enables the inference of disease-specific gene regulatory networks (GRNs) by combining measurements from gene expression and potential regulators. GRNs can enable the identification of key deregulated sub-networks and aid drug target discovery [6].
We consider that all the above-mentioned objectives have a great overlap with a common general objective, namely the objective of Biomarker Discovery. Thus, we understand that all the presented tools and methods also contribute to this objective. All the analysis to achieve the scientific objectives mentioned above has as a secondary objective to uncover explainable biomarkers for better prediction.
4. Predominant single and combined omics per objective and disease
In the first part of the analysis, we set out to identify the most frequently used omic layers of multi-omics studies. In (Fig. 1), we visualise the frequency of each omics type across the examined studies from 2018–2021. We separate the studies into two groups focusing on cancer and non-cancer diseases. Transcriptomics is the most common omic type in both cancer and non-cancer diseases. In cancer, epigenomics and genomics are significant omic types of choice whereas, in non-cancer diseases, this is not the case. In diseases other than cancer, proteomics, metabolomics and metagenomics are significant types of choice.
Fig. 1.

Frequency of each omics type across the examined multi-omics studies from 2018–2021.
We then examine the pairwise combinations of the omic types in the selected studies. Fig. 2a shows the number of occurrences of each omics pair across the studies. Transcriptomics and proteomics are most frequently used in combination, followed by the combination of transcriptomics with epigenomics, and proteomics with metabolomics. In cancer, transcriptomics with epigenomics is the top pair, followed by transcriptomics with genomics. Looking at the distribution of all combinations, we detect short-range combinations and long-range combinations of omics with the latter presenting a few hits, as expected. For example, the long-range combinations of metagenomics with epigenomics or genomics with metabolomics are less frequent.
Fig. 2.

(a) Number of occurrences of each omics pair (i,j), for cancer (right) and other diseases (left). (b,c) Networks of the most frequently used omics pairs adopted by multi-omics studies from 2018–2021 for cancer (c) and other diseases (b). Edges are connected if the two types of omics were combined in more than 10 studies. Edge weights show the number of studies that combined the two types. Node size represents the closeness centrality of the node.
In Fig. 2b, 2c we highlight significant patterns of connectivity (in terms of co-existence in the same study) between the various omics for the categories of cancer and other diseases. In this figure, we present the network of the most frequently used omics combinations adopted by multi-omics studies from 2018–2021. The nodes represent omics layers. Edges are connected if the two types of omics datasets were combined in more than 10 studies, and their weight represents the number of studies that combined the two types. The node size represents the closeness centrality of the node to emphasise nodes that are frequently combined with most others. In cancer, the study of the influence of genomics and epigenomics on transcriptomics is the basic strategy. For the other diseases, apart from measuring the influence of genomics and epigenomics on transcriptomics, there is also a focus on downstream analysis by combining firstly, proteomics and metabolomics with transcriptomics and secondly, metabolomics with metagenomics. For both cancer and non-cancer diseases, it appears that transcriptomics is a key selection in various combinations of omics.
Objective-specific choices. We observed different trends in the scientific objectives and the selection of omic types between cancer studies and other diseases. In Fig. 3 we are presenting the participation of each single omic in each scientific objective. The presented Sankey plots show the number of studies (as the width of the flow) that utilize each omic type for each specific objective. In cancer, the most common objective was subtype identification, whereas, in other diseases, the detection of disease-associated molecular patterns and diagnosis was more common. In cancer, transcriptomics and epigenomics are the most frequent omics mainly contributing to subtype identification. In other diseases, transcriptomics, metabolomics and proteomics are the most frequent omics, mainly contributing to detecting disease-associated molecular patterns.
Fig. 3.

Sankey plots of omics datasets selected for each scientific objective. The width of the flow represents the number of studies that used the specific types of omics for the scientific objective. Only the omic types used more frequently are shown in each plot.
Fig. 4, shows the distribution of omics pairs used for each scientific objective. The width of the bars shows the proportion of each omic pair, from the total pairs that have been adopted for each objective. For the objective of diagnosis of non-cancer diseases, the most common combinations of omics used were metabolomics and proteomics. Metabolomics and proteomics are also prominent in identifying disease subtypes. This is in contrast to the objective of understanding regulatory processes where metabolomics datasets are less frequently used and transcriptomics with epigenomics or proteomics are more prominent combinations. In detecting disease-associated molecular patterns, most pairs are used in similar proportions. For the objective of drug response prediction, we observe genomics, transcriptomics and epigenomics (specifically DNA methylation). In cancer, the most common omics used for all objectives were the triad of transcriptomics, epigenomics and genomics data.
Fig. 4.

Percent frequency of omics datasets combinations out of the total combinations used in multi-omics studies of 2018–2021 (a) for each scientific objective and (b) for each disease group (grouped by anatomical entity). The plots show only the top eight most frequently used combinations. Abbreviations. E: Epigenomics, G: Genomics, M: Metabolomics, Mg: Metagenomics, P: Proteomics, T: Transcriptomics.
Disease-specific choices. We notice that nervous system diseases are most frequently studied, more specifically the Alzheimer’s Disease (AD), Parkinson’s Disease (PD) and Amytrophophic Lateral Scleorosis (ALS). Other diseases frequently studied with multi-omics datasets are Inflammatory Bowel Disease (IBD), Liver disease (gastrointestinal), Chronic Obstructive Pulmonary Disease (COPD) (pulmonary) and Arthritis (musculoskeletal). In Fig. 4b we observe trends in the selection of omics combinations by disease group (groups are defined by anatomical entity). Metabolomics and metagenomics are commonly used to study gastrointestinal and immune system diseases. Epigenomics is used with transcriptomics to study nervous and musculoskeletal diseases. Looking at specific examples, we find that the pair is used mainly in aging-related disease like AD, PD and Osteoporosis. Proteomics and transcriptomics is a common pair in endocrine, pulmonary and nervous related diseases. For rare, inherited diseases like mitochondrial diseases, where the first omic type is genomics, it has been established that to find causal variants, transcriptomics is the next type to combine. This allows for the functional assessment of variants detected.
5. Multi-omics data integration approaches and computational challenges
Three types of multi-omics data integration approaches have been identified in the literature: early, late and intermediate integration [16]. In early integration, the different omics datasets are combined into one table or graph-based representation which is then used as input to a Machine Learning (ML) model. In late integration, models are applied to each dataset independently. Then, a second model combines their predictions. Finally, in intermediate integration, a model learns a joint representation of the datasets. We found that most newly developed tools from 2018–2021 specifically adopt the intermediate integration approach. In the next sections of the paper we will present tools that mainly adopt the intermediate integration approach. We identified that the tools adopt different variations and combinations of the following methods: joint Dimensionality Reduction (jDR), Correlation and Covariance-based jDR (COR), Factor analysis (FA), Probabilistic/Bayesian Models (PR), Similarity (Kernel) based (KB), Network-based integration (NB), Regression-based (RB) and Deep Learning (DL). We thus group and present tools under these methodological categories. The decision on the tool of choice fordata integration should be guided by the specific scientific objective of the project and the computational challenges that arise from this. In the section below we refer to a set of computational challenges in data integration that will help qualitatively compare the tools in the next sections:
-
•
Complex non-linear interactions between features. The ability of the selected method to capture higher-order or non-linear interaction effects between molecular features is a crucial requirement in objectives related to the understanding of molecular mechanisms. Network science analytics facilitate this systemic capture for example, on gene regulatory network inference, where a gene is influenced by other distant genes and biological factors.
-
•
Uneven datasets and missing data. Datasets can differ vastly in size containing also missing values, either in the form of random features missing or of whole omics measurements missing for some samples. This can hinder the learning process [4]. For example, proteomics and metabolomics technologies produce more sparse and smaller datasets than RNAseq. In the case of subtype identification, the grouping obtained might be driven predominantly by variation in transcriptomics.
-
•
Data heterogeneity. This refers to the disparate nature of omics variables and the different distributions that they follow. For example, mutations are fundamentally different to other data types like RNAseq that take continuous values. Instead, somatic mutation profiles are extremely sparse, and take binary values [17]. It is unsuitable to interpret the variation of a binary variable in the same way as the variation of the continuous variables would be interpreted. In addition, there is omics-specific noise, sources of variation and confounding effects in each omics measurement.
-
•
Curse of dimensionality. This is a generic data science challenge referring to problems that arise when the number of variables exceeds the number of samples (large p, small n), which is typical for omic datasets. This leads to lack of generalisation and overfitting, and subsequently, to spurious associations between molecules or phenotypes, that do not generalise to other datasets.
-
•
Computational Performance. Some computational performance criteria include whether the algorithm can scale to large number of samples, if it is easy and efficient to run, if it is robust and whether it can converge to an optimal solution in a set number of runs. These could be assessed quantitatively on real or simulated datasets.
Other than dealing with the computational challenges described above, many DI tools are optimised for specific objectives. Therefore, it is crucial to define criteria that should be objective-specific, to help assess their strengths. These criteria will be elaborated on in the next section for each objective.
6. Predominant multi-omics computational methods for the selected objectives
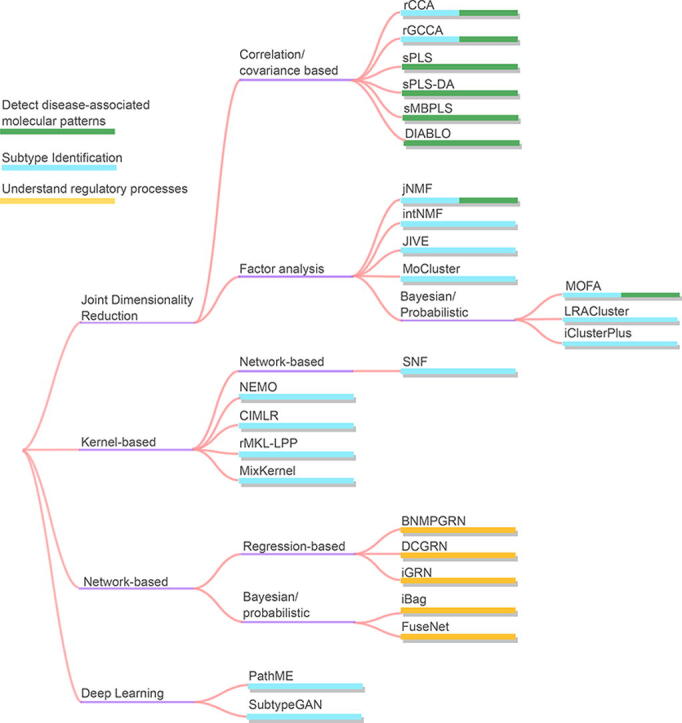
In this section we select the three most prominent scientific objectives, subtype identification, detection of disease-associated molecular patterns and understanding of regulatory processes, to present commonly used DI methodologies and examples of related tools for each objective. A list of example tools we describe is in Table 2. The table includes the computational method category for each tool, the objectives it was used for and the datasets it was applied to. The right side of the table is separated into computational challenges described earlier, and a check symbol indicates whether the tool was designed to approach the specific challenge. Fig. 5 is a diagram showing the data integration tools grouped by the methods adopted and the scientific objective the tool is employed for.
Table 2.
Example tools for data integration, identified in multi-omics studies published in 2018–2021. Computational method category, datasets it was applied to, and objectives it was used for. The right side of the table is separated into the data integration computational challenges. A checkmark indicates whether the tool was designed to approach the specific challenge. Abbreviations. jDR: joint Dimensionality Reduction, FA: Factor analysis, COR: Correlation/Covariance-based jDR, NB: Network-based, DL: Deep Learning, KB: Kernel-based, PR: Probabilistic/Bayesian, REG: Regression-based E: Epigenomics, G: Genomics, M: Metabolomics, P: Proteomics, T: Transcriptomics UR: Understand regulatory processes, MP: Detect disease-associated molecular patterns SI: Subtype Identification.
| Tool | Method category | Datasets | Objectives | Ref | Non-linear | Unequal sizes | Missing Data | large p small n | Heter. Datasets |
|---|---|---|---|---|---|---|---|---|---|
| MOFA | FA, PR, JDR | E, G, P, T | SI, MP | [43] | ✓ | ✓ | |||
| iNMF | FA, JDR | E, T | SI | [29] | ✓ | ✓ | |||
| JIVE | FA, JDR | E, P, T | SI | [44] | ✓ | ||||
| intNMF | FA, JDR | E, G, P, T | SI | [45] | ✓ | ||||
| jNMF | FA, JDR | E, T | SI, MP | [46] | |||||
| iClusterPlus | PR, JDR | E, G, T | SI | [47] | ✓ | ||||
| iClusterBayes | PR, JDR | E, G, T | SI | [31] | ✓ | ||||
| LRAcluster | PR, JDR | G, P, T | SI | [33] | ✓ | ||||
| NEMO | KB | E, T | SI | [20] | ✓ | ✓ | |||
| SNF | NB, KB | E, M, P, T | SI | [18] | ✓ | ✓ | ✓ | ✓ | |
| CIMLR | KB | E, G, T, | SI | [26] | ✓ | ✓ | |||
| rMKL-LPP | KB, JDR | E, T | SI | [22] | ✓ | ||||
| MKpLMM | KB | E, G, T | SI | [48] | ✓ | ✓ | ✓ | ✓ | |
| MixKernel | KB | E, T | SI | [27] | ✓ | ✓ | ✓ | ||
| SubtypeGAN | JDR | E, G, T, | SI | [42] | ✓ | ✓ | ✓ | ||
| Mogonet | NB, JDR | E, T | SI | [41] | ✓ | ||||
| iBag | NB, PR | G, T | UR | [49] | ✓ | ✓ | |||
| FuseNet | NB, PR | G, T | UR | [50] | ✓ | ✓ | |||
| DCGRN | NB, REG | E, G, T | UR | [50] | ✓ | ||||
| iGRN | NB | E, G, T | UR | [51] | ✓ | ||||
| sPLS | JDR, COR, REG | E, M, P, T | MP | [52] | ✓ | ✓ | |||
| sPLS-DA | JDR, COR, REG | E, P, T | MP | [[52], [53], [54]] | ✓ | ||||
| DIABLO | JDR, COR, REG | E, P, T | NA | [54] | ✓ | ||||
| rCCA | JDR, COR | P, T | SI, MP | [52] | ✓ | ||||
| rGCCA | JDR, COR | P, T | SI, MP | [36] | ✓ | ||||
| MCIA | JDR, COR | P, T | SI, MP | [35] | ✓ | ||||
| sMBPLS | COR, REG | E, G, T | MP | [55] | ✓ |
Fig. 5.

Data integration tools by the method adopted. The colours of the bars represent the scientific objective the tool is employed for.
6.1. Subtype Identification
In subtype identification, groups of samples with similar molecular features are identified through an unsupervised analysis approach. The performance of the methods is evaluated against different criteria that aim to assess the coherence and usefulness of newly defined molecular subtypes. Subtypes should be biologically meaningful and clinically relevant. This can be assessed by checking whether they show significant differences in enriched biological processes and distinct patient outcome differences. Furthermore, the clinical and biological relevance of the subtypes should be easily interpreted. This can be measured with different parameters, like whether molecular features and known pathways from knowledge databases can be associated with subtypes and be readily extracted after clustering.
Validation schemes can be implemented by testing the outcome on new data. For example, the omic features that differed significantly between clusters can be extracted as important markers for subtyping and for classification of new unseen datasets to subtypes. Finally, ground truth-based evaluations can be used to classify samples from already characterised or simulated datasets with known subtypes.
Below we present the main methodological categories of DI methods in subtype identification and several examples of related tools.
Similarity- (Kernel-) based. Similarity-based approaches calculate a similarity score between each pair of patients based on the combination of omics measurements. In Similarity Network Fusion (SNF) [18] the multi-omic driven patient similarities are produced using a network approach. The samples are connected to form sample similarity networks, first for each omic dataset separately. Then these omic networks are combined through a novel network fusion method to produce a multi-omics sample similarity network. The network fusion algorithm works iteratively and is based on message passing theory. At each iteration each of the omics networks is updated with the information from the other networks, becoming more similar, until they converge to a common network. The final fused network is analysed further using a spectral clustering algorithm to identify homogeneous cluster subtypes. SNF has been applied to a broad range of diseases to uncover clinically relevant molecular subgroups. In the study of [19] the molecular classification of Chronic Obstructive Pulmonary Disorder (COPD) patients from nine omics data blocks mRNA, miRNA, proteomics, metabolomics coming from several anatomical locations was performed with SNF. Smoking is a confounding variable that complicates the separation of mild-to-moderate COPD patients from current smokers. The SNF-produced networks improved the separation of patients to COPD patients, smokers with normal lung function and never smokers. SNF is scalable to a large number of features. In addition the network representation of the multi-omic clusters offers an intuitive way to understand the complex interconnections of patient subgroups.
NEMO [20] is another similarity-based method optimised to work well on partial datasets. The similarity index is calculated as the profile closeness of each pair of samples for each omics separately. Then the index is converted to a relative similarity, by measuring the similarity between sample i, j relative to i’s nearest neighbours and j’s nearest neighbours. The joint profile is calculated as the average relative similarity across all omic layers. Spectral clustering again is used to reveal subtypes based on the average relative similarities. By using the average relative similarity rather than absolute measurements, the algorithm can combine omics that have different data distributions. Compared to nine other state-of-the-art algorithms on subtypes with significantly different survival, it performs as good as the correlation-based method MCCA [21] and the kernel-based tool rMKL-LPP [22] on full datasets, and better on partial datasets.
One of the major advantages of similarity-based methods is that they can handle missing data since the similarity index can be computed when there are missing features, or missing omic datasets. Their runtime mainly depends on the number of samples rather than on the omics features and thus they scale well to high throughput datasets. They are also less reliant on feature selection as a pre-processing step, compared to joint dimensionality reduction methods.
Multiple Kernel Learning. The integration of patient similarities from multiple omics datasets can also be computed using Kernel Learning [23], [24]. The data is mapped to a higher dimensional feature space, which is constructed using a kernel function. Kernel functions compute the inner product of pairs of data in the feature space producing a kernel matrix. In multi-view datasets the process can be done in two steps: Kernel functions are first computed for each data view separately. Then, multiple kernel learning is the process where the functions are combined to produce the integrated higher dimensional space, by minimising an objective function. The resulting feature space is then used for pattern analysis and clustering. rMKL-LPP [22] uses a linear combination of kernels to integrate the different omic types. The combined kernel is constructed using an objective function based on the Locality Preserving criterion, LPP. LPP aims to preserve the similarities of the patients in each omics data, making this Kernel-based integration method particularly suited to the clustering of samples. In the benchmarking study of [25], rMKL-LPP was shown to score highly in finding clusters that have significantly different clinical parameters.
Kernel matrices can offer flexibility in terms of the input data type, because the first step maps each of the datasets to a higher dimensional space where they can be combined. The more recently developed CIMLR [26] also included point mutations and copy number alterations (CNA) in addition to DNA methylation and gene expression (GE) datasets to reveal cancer subtypes of 36 different cancers from TCGA. CIMLR combines a higher number of kernels, per data type, and allows one to learn higher-order kernel functions. This is done by combining multiple gaussian kernels per data type corresponding to different representations of the data. The presented evaluation of the method shows a higher cluster separation and stability and more biologically and clinically relevant subtypes discovered for the 36 cancers, compared to two probabilistic methods, iClusterPlus and Bayesian consensus clustering (BCC), and the similarity-based tool SNF.
MixKernel [27] integrates the datasets by computing kernels for each of the datasets independently, and then calculating a mixed kernel that aims to maximise similarity with all the others at the same time. In addition, it tries to keep the geometrical structure of the separate datasets in the mixed kernel.
Factor analysis. Factor analysis methods perform dimensionality reduction by decomposing the datasets into a smaller number of factors. This can be done using matrix factorization, where the data is decomposed into a weight matrix H and a matrix of factors W. Several tools like jNMF [28] and intNMF [29] represent various extensions of the method to apply to multi-view datasets. jNMF and intNMF decompose the dataset into a common factor matrix W and multiple weight matrices that correspond to each omics dataset to perform the multi-omics matrix factorisation. The factor matrix W which has dimensionality (number of samples × factors) is common across the omic datasets, and it is thus used for pattern analysis and clustering of the samples. Non-negative matrix factorisation (NMF) methods impose the constraint that the matrices should be non-negative. In order to obtain the cluster membership of each sample, the largest element in the sample row of matrix W is selected. iNMF [29] decomposes the datasets using an extra omics specific term. This helps to separate omics-specific noise and confounding effects from the biological signal. The proposed method showed improvement in the level of common signal detected relative to noise.
MOFA is a multi-omics matrix factorisation method which uses variational inference to efficiently construct the low-dimensional representation of the data. The problem of finding the factors Z and weight matrices W is solved using a probabilistic Bayesian framework. Regularisation is used to enforce sparsity in the weight matrix. MOFA + is an extension of the model to make it scalable to larger datasets. MOFA is one of the few methods that deal with missing data in a probabilistic manner rather than using imputation. For datasets with missing data, it was shown to perform better than other state-of-the-art imputation strategies including imputation by feature-wise mean, SoftImpute and KNN. The MOFA package includes tutorials that demonstrate how to use the factors for further analysis like sample clustering.
In the study of [30] MOFA was used to identify therapeutically relevant molecular groups across 116 pulmonary carcinoids using methylation and GE data. The analysis produced five latent factors, and the first two captured 45% and 34% of the variance in the datasets. To identify subtypes, the first two factors that were found to also associate with survival status, were used to perform consensus clustering. The 116 carcinoids, were grouped into three main clusters that have distinct survival outcome and therapeutic targets.
Probabilistic Factor analysis models. iClusterPlus [31] makes distributional assumptions about the datasets to accommodate the different distributions of omics variables. The distribution of each genomic variable is defined in terms of latent variable models. For example, the inferred latent variables can be thought to capture the distinct oncogenic mechanisms in different patient groups, and thus help to cluster the patients. They are estimated from the omics variables using a parametric joint model using linear regression. The joint log-likelihood is approximated using a modified Newton–Raphson algorithm to estimate the model parameters. However, it has been criticised about being computationally intensive, and not robust as it requires a large number of runs to find a stable solution [32]. iClusterBayes [31] extends iClusterPlus to model binary genomic variables and count data from RNA sequencing. A Bayesian model is used to include Bernoulli and Poisson priors, and uses the Metropolis–Hastings algorithm for parameter estimation. It significantly improves the computation time compared to iClusterPlus. The algorithm was applied to TCGA datasets of glioblastoma and kidney cancer. The integrated subtypes revealed distinct genomic patterns from mutation, copy number alteration (CNA) and GE data, and had more significant differences in survival probability than GE subtypes.
LRAcluster [33] also finds the low-dimension subspace in terms of latent variables. It differs from iClusterPlus by using a fast low-rank approximation method to improve the efficiency of parameter estimation. moCluster [34] also calculates a joint latent variable using modified consensus PCA. moCluster focuses on the issue of non-deterministic solutions given by iterative expectation maximization algorithms like iClusterPlus. Compared to iClusterPlus, it finds a stable solution in one run.
Correlation/Covariance-based jDR. While they were not specifically designed to perform subtype identification, they are widely used for integrating multi-omics datasets using joint dimensionality reduction. These methods transform the multi-view datasets using an objective function to maximise their correlation or covariance in the transformed space. This space is then used for pattern analysis and, thus, clustering of the samples. Example tools are MCIA [35], RGCCA [36] and MCCA [21]. More details on how these tools can be applied to subtype identification can be found in the benchmarking studies of [37], [38]. jDR methods have been widely used for highlighting data issues such as batch effects and outliers both in single omics and multi-omics datasets. Therefore, they could be also used in combination with other subtype identification tools as a pre-processing step or in an exploratory manner. These methods will be presented in more detail in Section 6.2.
Deep Learning. Most applications of DL methods use as input a concatenated matrix of omics features using an early integration approach. A set of new tools, however, exploit the multiple inner layers of DL methods to learn a joint representation of the input. These layers could capture the correlations and complex biological relationships within the datasets [39]. This representation is envisioned to be able to combine heterogeneous datasets more efficiently [40], [41]. SubtypeGAN [42] is based on a generative adversarial network consisting of multi-input and multi-output layers and a shared layer representing the multi-omics input. The three modules, encoder, decoder and discriminator, are used in the training process so that the shared layer learns a non-linear low-dimensional representation of the complex input. The shared layer representation is then used to perform clustering. SubtypeGAN is evaluated using 10 different cancer datasets with mRNA, miRNA, DNA methylation and CNAs. The evaluation shows that information from CNAs can contribute up to 39% to the discovery of integrated subtypes. Many tools have not included genomic variables like CNAs in this task. However, the high proportion of the contribution of CNAs to new subtypes shown in these results shows that emphasis should be placed on these datasets. More algorithms that support heterogeneous datasets are required, and the ability to exploit information from non-continuous and continuous genomic variables simultaneously should be prioritised.
Latent variable models using prior knowledge. Latent variable models hypothesise that there are hidden factors in the datasets that represent major underlying biological processes. Intuitively, within different groups of samples, these biological processes occur at different degrees that explain the variations between them. However, the factors learnt might not always represent real interpretable biological processes but other sources of heterogeneity due to the specific experimental setup or other confounding variables. To help construct biologically interpretable factors, there is a line of research where the models are induced to construct factors correlated with known pathways.
One example of this approach is the tool PathME [56]. It incorporates pathway information into a multi-modal autoencoder to help reduce the dimensionality of omic features. The method produces a patient-pathway scores matrix which is used for further analysis. This is done using the autoencoder framework to find a non-linear mapping from the original patient-feature matrix to a patient-pathway matrix. The patient-pathway score matrix is further decomposed using NMF to identify clusters of patients with similar pathway scores. For example, if a set of pathways is dysregulated in two patients, they would more likely be grouped into the same subtype. Using NMF, the pathways are also clustered, obtaining information on how different pathways are involved in orchestrated pathogenic processes. PathME revealed the activation of pathways in specific subtypes of 4 cancers. This facilitated the discovery of highly interpretable molecular subtypes from the integrated data.
A few benchmarking studies compare selected methods for subtype identification that help assess their strengths on different objective-specific criteria. The benchmarking study of [37] compares nine jDR tools using DNA methylation, transcriptome and protein expression features. They included iCluster, MOFA, JIVE, intNMF, and other JDR tools not specifically designed for clustering like MCIA and RGCCA. The aforementioned tools were evaluated based on their capacity to classify the samples against ground truth subtypes, predict their survival and therapeutic outcome as well as the implicated pathways/ biological processes. Among the nine selected methods/tools, intNMF and iCluster, intrinsically designed for the clustering of samples, have been shown to perform best in identifying the subtypes from simulated datasets. However, on real datasets the factors produced by MOFA and RGCCA had better associations with clinical annotations or survival status. It is clear that tools have strengths and weaknesses against the different objective-specific criteria, and that, depending on the questions at hand, different tools could be combined to get the best results.
Other benchmarking studies use different sets of data like mRNA, miRNA and DNA methylation in [38]. Including binary mutation data and CNAs in subtype identification has been approached by a limited set of tools. The benchmarking study of [57] performs clustering using simulated heretogeneous datasets from different distributions: gaussian, binary and beta-like. They evaluated the performance of detecting variables that drive subtypes. The most challenging variables to detect were binary and beta-like. moCluster, intNMF and CIMLR were better at detecting binary variables than RGCCA, MCIA and iClusterPlus. For beta-like variables moCluster was the best performer.
6.2. Detect disease-associated molecular patterns
This objective concerns the discovery of covarying molecules or highly correlated modules that could reveal disease-specific mechanisms. The molecules/entities within the modules could be functionally related and it is assumed that their co-expression and relationship is associated with the disease state. The additional output that results from multi-omics analysis is that, apart from significant molecules/entities, we can identify significant within-layer and across-layers connections as markers of disease state.
A primary challenge is to make the high-dimensional datasets more interpretable. Reducing the datasets to a smaller number of important features could help relate the findings to the pathogenesis of the disease and pinpoint causal mechanisms. This analysis can be quite exploratory and may act as a starting point to generate more specific questions and research hypotheses. In order to assess the quality of the output, the highlighted (connected or not) molecules are expected to have significant transcriptional or functional enrichment.
To aid with the interpretation, these methods are often coupled with downstream analysis to further annotate the extracted patterns. This is done either by producing a network to observe the relationships between the molecules or by performing pathway analysis. These approaches will be described further in the next section.
Correlation/Covariance-based jDR. Tools based on jDR for data integration are emerging in the last decade, and have been widely used to explore and derive complex molecular patterns. The review of [34] offers an in-depth description and links of the different correlation and covariance-based jDR methods (eg. CCA, rCCA, RGCCA, MCIA) for integration. There are numerous implementations of these methods, with variations that adopt different objective functions and computational approximations to obtain the transformed datasets [58]. Here, we refer to a set of implementations that have been optimised to deal with the different challenges of multi-omics data integration.
Correlation and covariance-based jDR methods transform the multi-view datasets by maximising their correlation or covariance in the transformed space. The transformed datasets are then used to visualize common major patterns across multiple datasets. In CCA, a set of components is estimated that maximizss the correlation between the datasets in the transformed space. In MCIA [34], the co-inertia is maximised. Generalised CCA (GCCA) implementations are further extensions to apply to more than two datasets. Regularised (RCCA) and sparse (sCCA) variations are implemented to deal with matrices where the number of features exceeds the number of samples [21]. The RGCCA implementation in [36] is an extension of CCA to apply to multiple datasets and also for a high number of features. From a statistical point of view, GCCA and MCIA can be recovered using the RGCCA algorithm with different values of its input parameters, shrinkage and sparsity. A useful practical guide of different applications of each one is offered in [59]. DIABLO [54], available in the mixOmics package, is an extension to create a supervised framework of a previous implementation of sGCCA [60]. It simultaneously maximises the covariance of the transformed datasets and minimises the error rate of predicting a response variable y. This way, it selects co-varying modules that best explain a response variable, usually a phenotypic variable or trait.
A study on Crohn’s disease focused on understanding the role of dysbiosis of gut bacteria on disease activity, by identifying relevant microbiota-metabolite interactions [61]. rCCA from [62] was applied to the differentially abundant features from metagenomics and metabolomics datasets. Afterwards, they produced a relevance network, connecting the two sets of features using the transformed datasets given by the CCA. Analysis of the resulting network highlighted two main clusters of bacteria-metabolite interactions, involving sulfur metabolism as a key mechanism linked to disease.
Partial Least Squares (PLS) analysis finds a set of components to maximise the covariance of the transformed datasets. sMBPLS [55] is another variation to apply to more than two datasets, with the aim to identify regulatory modules from multiple omics datasets. PLS-DA [63], a supervised adaptation of PLS, was adopted to predict amyloid positivity from non-invasive plasma biomarkers [63]. The authors integrated RNAseq data, plasma metabolomics and lipidomics. The metabolomics block was found to be the most discriminative in predicting amyloid-positive and amyloid-negative samples. A molecular signature of ten metabolites and transcripts was able to predict amyloid positivity with an extremely high chance.
Factor analysis. jNMF was one of the first tools to define the notion of multi-dimensional (md) modules using factor analysis. In [28], an ovarian cancer cohort was analysed to discover the main md-modules. Using the multi-omic features of the md-modules to perform GSEA separately for each module, they were found to be functionally homogeneous and enriched in known cancer processes.
MOFA [43] is one of the most recent implementations to approach this objective. A difference from the majority of the correlation-based methods described above is that it learns a single factor matrix that is common to all the data modalities. Intuitively, the multiple factors would represent the main biological processes that vary within the samples. The factors can be used for further downstream tasks to tackle more specific objectives including annotation of factors using principal component gene-set enrichment [64] and association of factors with clinical variables.
In order to compare the toxicological mechanisms related to cigarette smoke (CS) and to modified risk tobacco products, five omic datasets from mice were collected and analysed with the tool MOFA [65]. The first factor captured a significant part of the variation and showed a signature that spans all omic layers. An association network for the first factor was derived from a set of knowledge databases for functional interpretation, showing that the main processes involved include immune response, oxidative stress response, lipid metabolism and extracellular matrix.
Because of the exploratory character of these methods it is rather difficult to compare and establish a benchmark to evaluate them. One way is to convert the problem to a supervised task and assess how the modules or latent variables produced can be used to predict complex traits as seen in [58].
The methods described here facilitate the reduction of the omics datasets to help extract novel insights. However, the transformations and reductions that the methods produce, comprise of features that represent biological processes that span several omic layers. To facilitate their interpretation, a set of downstream analysis tools can be used to complement the findings. These tools are presented in Section 7.
6.3. Understand regulatory processes
The most common task to understand regulatory processes in disease is to construct and analyse gene regulatory networks (GRN). GRNs can be homogeneous, where nodes represent genes, or heterogeneous, where nodes represent genes and other biological factors (eg. DNA methylation, CNVs, miRNAs and regulatory proteins) that are involved in the regulation of GE.
There is a vast amount of literature on methodologies to infer homogeneous GRNs from GE datasets (microarray or RNAseq), and potentially including prior information from knowledge databases related to protein–protein interactions (PPIs) and transcription factors (TFs) to help infer the presence, weight and direction of regulatory links. For example, PPIs help to estimate the strength of regulatory links, time series GE data can help to find the directionality of the relationship, and knockout data helps in the inference of causal relationships [66]. However, including mainly prior information and only GE for the sample-specific measurements produces generic networks that are not specific to the patient cohort at hand. Here we focus on tools that produce context-specific regulatory networks using the simultaneous measurements and integration of omics from the patient samples.
GRN inference requires a search of potential regulators (from genes, CNVs, DNA methylation sites, miRNAs etc.) for each gene. This is computationally intensive and prone to false positive edges being constructed due to correlations and indirect connections between genes and regulators. [67]. When inferring regulatory networks, the identification of causal relationships between genes is crucial. If indirect correlations are not distinguished, this leads to very dense networks (high number of edges) and hence to limited interpretability. Therefore, this is one of the primary challenges and evaluation criteria for GRN inference methods. Other evaluations to assess the performance of GRN tools include an estimation of how functionally informative the inferred networks are using the strength of associations between GO and the networks.
The highlighted methods found to be applied to reconstruct regulatory networks are the following:
Regression-based. In the case of Regression-based approaches, the expression of each gene, is represented by a regression model that includes measurements from other omic datasets and their parameters. The problem of inferring links between a set of N genes and their regulators, is decomposed into a set of N regression problems. iGRN [51] produces a gene-to-gene adjacency matrix and two biadjacency matrices for the interactions of CNV and DNA methylation with genes (CNV-gene and DNA methylation site-gene). The expression of gene i is then modelled by a sparse linear model incorporating other genes and also interaction effects of its nearby CNVs and DNA methylations. The parameters are estimated using the least absolute shrinkage and selection operator (LASSO), to select the most predictive variables. Because the number of GE features is much higher than DNA methylation and CNV features associated with a gene, this would likely result in only the gene parameters in the model being non-zero during regularization. In order to deal with this, the estimation is done in a stepwise manner, first, the coefficients for CNVs and DNA methylation are computed, and then for the genes. iGRN was used to infer a gene regulatory network from human brain data of patients with 3 psychiatric disorders, schizophrenia, bipolar disorder and major depression. The samples have 25 k GE, 1028 CNVs and 24 k sites for DNA methylation. A small set of inferred interactions was extracted, and revealed regulatory mechanisms common to the 3 diseases.
BMNPGRN [50] makes use of non-convex penalty-based regression methods suggested to be better alternatives to LASSO when dealing with sparse problems such as estimating interactions from multi-omics datasets. To study the mechanisms of breast cancer, BMNPGRN is applied to a multi-omics dataset of 760 case and 80 control samples. The inferred network proposes potential regulators for key driver genes (KCNK12,SLC2A3 and TP53) in the context of breast cancer.
Probabilistic models. iBAG [49] and Fusenet [68] are probabilistic models that explicitly model the probability distribution of the different datasets to be integrated. This allows data with different probability distributions to be integrated and also different parameters to be estimated for each of the datasets. Using probabilistic models, however, introduces different algorithmic considerations, like the selection of the approximation method for the calculation of the posterior distribution [69]. iBAG uses a mechanistic model to predict the measure of GE from corresponding methylation sites. In order to fit the model and solve for the parameter set they use a Bayesian formulation of the LASSO. Fusenet incorporates latent variable models to perform the gene network inference from mRNA and mutation data. The measurements from each different omics dataset is represented as a random variable with Poisson probability distribution for GE or multinomial for mutation data. These are defined in terms of latent variables. The network is jointly estimated from the combination of the two, by collectively inferring the latent variable parameters using cyclical coordinate descent. The model is evaluated based on three simulated network structures (hub, scale-free and small world) and compared to related methods including the Local Poisson Graphical Model which also uses Graphical Models but without including latent variables. Fusenet shows improved performance and it is concluded that inferring the parameters using latent variables is beneficial.
Evaluating the methods for gene regulatory networks is not a straightforward task because there are no sets of ground-truth or true comprehensive regulatory networks listed [70]. Apart from that, these networks are tissue-specific, time-specific, and disease/biological condition-specific and their experimental verification requires large collaboration efforts. Most methods rely on simulations to establish the accuracy of their method, and this can be biased as some assumptions taken into the model construction are also taken in producing the simulated datasets.
7. Downstream analysis to extract biological insight
7.1. Using molecular interaction networks for DI
In this approach the multi-omics datasets are joined using a biological network as backbone. The network can be constructed from knowledge databases or inferred from the data. These tools map the input datasets onto an extensive interactome network. Further analysis finds a high-confidence subnetwork relevant to the datasets. The subnetwork is context-specific and is thought to provide a template for inferring causal pathways. Subnetwork identification is a well-known problem in graph theory with implementations like PCSF, jActiveModules and Random Walk with Restart [71].
The tools we present here can be used as standalone or as complementary to the DI methods explained in the previous section, to obtain additional mechanistic insights.
Omics Integrator [72] performs this integration using the submodule Garnet that finds TFs associated with mRNA expression changes and produces an interactome network using known PPIs. Then, the submodule Forest uses the PCST algorithm to identify a high confident relevant subnetwork from the underlying interactome.
COSMOS [73] uses a meta prior knowledge network (metaPKN) produced from databases STITCH, OmniPath and Recon3D. Using the metaPKN as a backbone, it searches for causal paths between the deregulated TFs, kinases, phosphatases and/or metabolites in the input datasets. To find the smallest sign-coherent subnetwork connecting the deregulated molecules, it uses the implementation from the tool Carnival [74]. Cosmos was applied to clear cell renal cell carcinoma to investigate the regulation of signalling cascades and metabolic reactions. The analysis produced an enriched subnetwork around the IFN pathway that revealed possible causal mechanisms between the dysregulated molecules.
iOmicsPass [75] first transforms the quantitative data of individual molecules into interaction scores based on their z-scores to infer an interaction network. It then selects densely connected subnetworks to predict phenotypic groups. The subnetworks are considered to correspond to functional modules, like transcriptional regulatory processes, that differentiate the phenotypic groups. iOmicsPASS was used to map transcriptomics and proteomics from the TCGA breast cancer dataset to TF and PPI networks. The analysis identified predictive subnetworks for four breast cancer subtypes. Their approach is shown to improve the prediction of molecular markers when the omics datasets are uneven in size. The jDR method MOFA resulted in a higher number of RNAseq features as subnetwork-predictive, possibly because of their larger representation. iOmicsPass allowed the discovery of important proteins too, since using the molecular interaction knowledge, it was forced to integrate the datasets in a more balanced manner.
7.2. Multi-omics pathway analysis
Performing pathway analysis from a set of multi-omics datasets is envisioned to detect more accurate biological processes compared to single omics datasets. Firstly, adding evidence from multiple molecular layers is assumed to increase the statistical power of the enrichment analysis. Also, by collecting dysregulated features from the different omic layers can help detect dysregulated processes that span different layers. The task however is not straighforward and comes with its own practical challenges. We urge the reader to consult with [76] for a comprehensive review of multi-omics pathway analysis tools. The authors group the tools into four types based on their integration method, and they evaluate them based on their strengths and drawbacks. In our analysis we identify two main approaches, firstly, the more traditional, p-value based integration approaches. And secondly, novel tools that use latent variable models to transform the dataset before performing enrichment analysis. We list a set of tools, the omic types they support and the pathway database used in Table 3.
Table 3.
Multi-omics pathway analysis tools, omic types they support as input and the pathway database they use.
| Name | Omics type | Pathway Database |
|---|---|---|
| ReactomeGSA [84] | proteomics, transcriptomics | GO, KEGG, MSigDb, Reactome |
| PaintOmics3 [77] | transcriptomics, proteomics, metabolomics, ATAC-seq, ChIP-seq data | KEGG |
| IMPALA [86] | Transcriptomics, proteomics, metabolomics | KEGG, Reactome, BioCyc, Pathway Interaction Database, Biocarta, NetPath, INOH, EHMN, PharmGKB, WikiPathways, SMPD |
| MultiGSEA [78] | Metabolomics, transcriptomics, proteomics, | KEGG, Biocarta, Reactome, NCI/Nature Pathway Interaction Database, HumanCyc, Panther, SMPDB, PharmGKB |
| ActivePathways [79] | Transcriptomics, genomics, | GO, Reactome |
| MetaboAnalyst [85] | Transcriptomics, Metabolomics | KEGG |
| Ingenuity Pathway Analysis | Metagenomics, Transcriptomics, Proteomics, Metabolomics, | IPA database |
| MOGSA [80] | Transcriptomics, proteomics, genomics | MSigDb, Biocarta, KEGG, Reactome, GO |
P-value based integration methods might require a mapping of the features from different omic layers to their corresponding genes. PaintOmics [77] maps features from different omic types to genes and performs GSEA analysis separately for each layer. This results in a separate p-value for each layer and each pathway. In order to integrate the information, the p-values are combined using Fisher’s test or Stouffer’s test. Because of possible correlations between the different omic types, Fisher’s test might result in false positives and thus Stouffer’s test is adopted more frequently. MultiGSEA [78] also uses Stouffer’s method. MetaboAnalyst offers both methods Stouffer’s method to specifically integrate transcriptomic and metabolomic data. Metaboanalyst does not require the metabolomics datasets to be mapped to equivalent genes. ActivePathways [79] uses Brown’s extension of Fisher’s combined probability test (to also deal with correlations between the different omics). It was used to reveal 33 pathways from genomics and transcriptomics data that were only apparent through the integrative pathway analysis but not in genomics or transcriptomics alone. This is potentially due to increasing evidence for specific genes from additional features coming from the second omic layer.
MOGSA [80] is a novel methodology to perform multi-omics enrichment analysis based on integration of the datasets using multiple factor analysis. MOGSA uses the joint latent variables produced by integration, using factor analysis to perform enrichment. It does not require all features to be mapped to a single gene. Instead, the user must provide a feature to gene-set membership association for each feature. This is a binary matrix where a feature is set to 1 for a gene set if it belongs to the set. This allows a feature (for example, a methylation site) to associate with multiple gene-sets simultaneously. Then a matrix of factor loadings is produced using factor analysis. To obtain the combined gene set scores, the gene-set association matrices are multiplied with the factor loadings matrix. An advantage of factorisation methods is the ability to detect factors associated with the unwanted signal from batch effects and confounding variables. For example, when MOGSA was applied to a cancer data integration task, one of the top factors of the model was associated with cell doubling time. After removing the scores associated to this factor the significance of the cell cycle checkpoint pathway was decreased. This allows the method to produce a more accurate ranking of clinically meaningful pathways.
8. Discussion
In this work, we set out to establish trends and patterns of which omic types and what methodologies are used in multi-omics studies, and how these choices are made. We examined a set of multi-omics studies from 2018–2021 found on PUBMED and collected the omic types used, and the type of analysis methodologies they used to answer their scientific questions.
Firstly, we established a set of five scientific objectives that multi-omics studies have: subtype identification, extraction of disease-associated molecular patterns, diagnosis/ prognosis, drug response prediction and understanding of regulatory processes. We find that the scientific objectives of these multi-omics studies are patient-specific. Rather than finding general insights into diseases, they focus on understanding patient-specific mechanisms, outcomes and treatments.
We observe that the authors of multi-omic studies choose omics combinations based on the biological evidence already reported in previous studies, the scientific objectives of their study and also the identified different trends in the choice for different diseases. For the objective of diagnosis, researchers look for omics closer to the phenotype (proteomics and metabolomics), whereas for understanding regulatory processes the most relevant omics are closer to understanding the genotype hence the transcriptomics and epigenomics. To predict drug response, the fact that genomic variants are known to be associated with drug resistance leads to the selection of genomics and DNA methylation. The analysis of metagenomics together with metabolomics can reveal mechanistic explanations of the disrupted metabolome and/or microbiome in disease as well as the human host-microbiome cross-talk through the study of the perturbations in the metabolites that they are derived and consumed from both sides. We observe a difference in the selection of omics combinations between cancer and other diseases. As shown in Fig. 2c, for cancer, the study of the influence of genomics and epigenomics on transcriptomics is the basic strategy. They are specially used for better patient stratification and can contribute to the understanding of multiple, simultaneous disruptions in gene regulation (either activation or inhibition) related to cancer and its progression. For the other diseases, even though we observe the trend of measuring the influence of genomics and epigenomics on transcriptomics again, there is also a clear downstream focus on the produced proteins, and the cross-talk between transcriptomics, proteomics and metabolomics. Interestingly, although extremely variable and sensitive, metabolomics seem to be the bridge between the upstream perturbation (transcriptomics/proteomics) and the environment (nutrition and microbiome).
In the second part of the analysis we seek to find out whether specific computational methods are more commonly used for specific scientific objectives. We categorised the multi-omics analysis methods into joint Dimensionality Reduction, Correlation and Covariance-based jDR, Factor analysis, Probabilistic Models, Similarity- (Kernel-) based, Network-based integration, Regression-based and Deep Learning. This categorization helped to find links between tools and compare them against different computational challenges in DI and objective-specific criteria. The common challenges for all objectives are to be able to capture the complex non-linearities, to deal with uneven sizes between the datasets, missing data, heterogeneity in the statistical distributions and data format and large numbers of variables compared to the sample sizes. We assessed how different methods aim to tackle these challenges and whether they were optimised against objective-specific criteria.
Subtype identification is a well-defined problem in the field of omics data analysis, and many specialised tools are designed specifically to tackle this. Factor analysis methods allow for the subtyping to be done in a transformed space which captures common patterns across different datasets. NMF variations have been popular in very efficiently detecting subtypes from transcriptomics and proteomics datasets. In addition, reducing the datasets to the main factors of variation makes them highly interpretable and it is advisable to start with them when exploring the heterogeneous biology of the samples. Similarity (kernel) based methods are generally good in dealing with missing data and specifically partial omics datasets. Tools that adopt multiple kernel learning for integration have shown promise in integrating heterogeneous datasets from different statistical distributions. Generally, combining Kernel functions allows for higher-order relationships between samples to be uncovered, even though interpreting the learnt functions is not as straightforward as it has been discussed for factor analysis methods. Finally, Deep Learning methods are able to integrate heterogeneous datasets and uncover complex relationships. To avoid overfitting, because of the high dimensional space of omics datasets, several approaches include domain knowledge from biological networks and thus can become more generalisable.
Joint dimensionality reduction methods are used for the extraction of disease-associated molecular patterns. Factor analysis, correlation and covariance-based integration methods allow for the reduction of the dimensionality of the datasets. The extracted factors help with the identification of the main biological processes that associate with disease and allow for an easier interpretation of the datasets. jDR methods offer flexibility in answering several downstream translational medicine objectives, like the association of the factors with clinical variables including survival and drug response prediction. Variations of these methods are implemented mainly to deal with the relatively large feature space compared to the smaller sample size of omics datasets.
Gene regulatory network inference is especially affected by a large number of correlated variables within the multi-omics datasets which makes it challenging to infer direct gene-regulator connections. Regression-based approaches are commonly used to select a small number of the most informative regulators to predict gene expression. Mixed Graphical Models (MGMs) have shown promise in identifying direct interactions among large pools of correlated variables. These are useful to represent direct interactions since the edges represent conditional dependency relations. In addition, they have been adopted previously to specifically deal with integrating continuous and discrete categorical variables [81]. For example, in [82] they apply MGMs to integrate GE and clinical features. Such models could be extended and adapted to the challenges of multi-omics data integration.
Finally, we have observed efforts to extend functional interpretation methods to multi-omics datasets. We highlighted several tools with respect to producing molecular interaction networks from multi-omics datasets. With the help of information from multiple omics layers, context-specific networks can give further insight into disease pathogenesis. In addition, we have highlighted novel approaches performing gene set analysis from multiple omics datasets.
Overall, we notice significant efforts in developing new tools to deal with the challenges of data integration. However, tools to simultaneously deal with all the challenges are lacking. For now, users must address intricacies specific to their datasets and decide on the selection of tools. A promising approach is to combine the results and get a consensus from different integration approaches that deal with different challenges.
As a concluding remark, we can say that there are significant contributions to make the great hope of the integration of multi-omics data in clinical practice a reality. The proper translation of the clinical needs as described in specific objectives, the wise omics data generation and usage and the informed selection of data integration methods under the prism of the accompanying computational challenges, is a triptych that will guide the successful application of multi-omics datasets in translational medicine projects. This article aimed to answer questions regarding the scientific objectives that benefit from multi-omics studies, highlighting the most preferred omics combinations per scientific objective and summarising the computational methods to achieve these scientific objectives. It is expected that this work will shed light on the design of the next multi-omics experiments and guide the way that the data can be integrated given the objectives of each study.
CRediT authorship contribution statement
Efi Athieniti: Conceptualization, Data curation, Visualization, Formal analysis, Investigation, Methodology, Writing - original draft, Writing - review & editing. George M. Spyrou: Conceptualization, Methodology, Visualization, Supervision, Writing - original draft, Writing - review & editing.
Declaration of Competing Interest
The authors declare that they have no known competing financial interests or personal relationships that could have appeared to influence the work reported in this paper.
Acknowledgements
This work was supported by TELETHON Cyprus.
Contributor Information
Efi Athieniti, Email: athienitie@cing.ac.cy.
George M. Spyrou, Email: georges@cing.ac.cy.
References
- 1.Han H., Liu X. The challenges of explainable AI in biomedical data science. BMC Bioinform. 2022;22(12):443. doi: 10.1186/s12859-021-04368-1. [DOI] [PMC free article] [PubMed] [Google Scholar]
- 2.Olivier M., Asmis R., Hawkins G.A., Howard T.D., Cox L.A. The Need for Multi-Omics Biomarker Signatures in Precision Medicine. Int J Mol Sci. 2019;20(19):4781. doi: 10.3390/ijms20194781. https://pubmed.ncbi.nlm.nih.gov/31561483 https://www.ncbi.nlm.nih.gov/pmc/articles/PMC6801754/ [DOI] [PMC free article] [PubMed] [Google Scholar]
- 3.Zachariou M., Minadakis G., Oulas A., Afxenti S., Spyrou G.M. Integrating multi-source information on a single network to detect disease-related clusters of molecular mechanisms. J Proteomics. 2018;188:15–29. doi: 10.1016/j.jprot.2018.03.009. [DOI] [PubMed] [Google Scholar]
- 4.Picard M., Scott-Boyer M.-P., Bodein A., Périn O., Droit A. Integration strategies of multi-omics data for machine learning analysis, Computational and Structural. Biotechnol J. 2021;19:3735–3746. doi: 10.1016/j.csbj.2021.06.030. https://www.sciencedirect.com/science/article/pii/S2001037021002683. [DOI] [PMC free article] [PubMed] [Google Scholar]
- 5.Conesa A., Beck S. Making multi-omics data accessible to researchers. Sci Data. 2019;6(1):251. doi: 10.1038/s41597-019-0258-4. [DOI] [PMC free article] [PubMed] [Google Scholar]
- 6.Liu E., Li L., Cheng L. Gene regulatory network review, Encyclopedia of Bioinformatics and Computational Biology: ABC of. Bioinformatics. 2018;1–3:155–164. doi: 10.1016/B978-0-12-809633-8.20218-5. [DOI] [Google Scholar]
- 7.Baxi E.G., Thompson T., Li J., Kaye J.A., Lim R.G., Wu J., Ramamoorthy D., Lima L., Vaibhav V., Matlock A., Frank A., Coyne A.N., Landin B., Ornelas L., Mosmiller E., Thrower S., Farr S.M., Panther L., Gomez E., Galvez E., Perez D., Meepe I., Lei S., Mandefro B., Trost H., Pinedo L., Banuelos M.G., Liu C., Moran R., Garcia V., Workman M., Ho R., Wyman S., Roggenbuck J., Harms M.B., Stocksdale J., Miramontes R., Wang K., Venkatraman V., Holewenski R., Sundararaman N., Pandey R., Manalo D.-M., Donde A., Huynh N., Adam M., Wassie B.T., Vertudes E., Amirani N., Raja K., Thomas R., Hayes L., Lenail A., Cerezo A., Luppino S., Farrar A., Pothier L., Prina C., Morgan T., Jamil A., Heintzman S., Jockel-Balsarotti J., Karanja E., Markway J., McCallum M., Joslin B., Alibazoglu D., Kolb S., Ajroud-Driss S., Baloh R., Heitzman D., Miller T., Glass J.D., Patel-Murray N.L., Yu H., Sinani E., Vigneswaran P., Sherman A.V., Ahmad O., Roy P., Beavers J.C., Zeiler S., Krakauer J.W., Agurto C., Cecchi G., Bellard M., Raghav Y., Sachs K., Ehrenberger T., Bruce E., Cudkowicz M.E., Maragakis N., Norel R., Van Eyk J.E., Finkbeiner S., Berry J., Sareen D., Thompson L.M., Fraenkel E., Svendsen C.N., Rothstein J.D. Answer ALS, a large-scale resource for sporadic and familial ALS combining clinical and multi-omics data from induced pluripotent cell lines. Nat Neurosci. 2022;25(2):226–237. doi: 10.1038/s41593-021-01006-0. [DOI] [PMC free article] [PubMed] [Google Scholar]
- 8.Fanidis D., Moulos P., Aidinis V. Fibromine is a multi-omics database and mining tool for target discovery in pulmonary fibrosis. Sci Rep. 2021;11(1):21712. doi: 10.1038/s41598-021-01069-w. [DOI] [PMC free article] [PubMed] [Google Scholar]
- 9.Yan Z., An J., Peng Y., Kong S., Liu Q., Yang M., He Q., Song S., Chen Y., Chen W., Li R., Qiao J., Yan L. DevOmics: an integrated multi-omics database of human and mouse early embryo. Briefings Bioinform. 2021;22(6) doi: 10.1093/bib/bbab208. [DOI] [PubMed] [Google Scholar]
- 10.Lei C.-G., Jia X.-Y., Sun W.-J. Establish six-gene prognostic model for glioblastoma based on multi-omics data of TCGA database. Yi chuan = Hereditas. 2021;43(7):665–679. doi: 10.16288/j.yczz.20-428. [DOI] [PubMed] [Google Scholar]
- 11.Tadaka S., Hishinuma E., Komaki S., Motoike I.N., Kawashima J., Saigusa D., Inoue J., Takayama J., Okamura Y., Aoki Y., Shirota M., Otsuki A., Katsuoka F., Shimizu A., Tamiya G., Koshiba S., Sasaki M., Yamamoto M., Kinoshita K. jMorp updates in 2020: large enhancement of multi-omics data resources on the general Japanese population. Nucleic acids research. 2021;49(D1):D536–D544. doi: 10.1093/nar/gkaa1034. [DOI] [PMC free article] [PubMed] [Google Scholar]
- 12.Liu S.-H., Shen P.-C., Chen C.-Y., Hsu A.-N., Cho Y.-C., Lai Y.-L., Chen F.-H., Li C.-Y., Wang S.-C., Chen M., Chung I.-F., Cheng W.-C. DriverDBv3: a multi-omics database for cancer driver gene research. Nucleic Acids Res. 2020;48(D1):D863–D870. doi: 10.1093/nar/gkz964. [DOI] [PMC free article] [PubMed] [Google Scholar]
- 13.D. Gomez-Cabrero, S. Tarazona, I. Ferreirós-Vidal, R.N. Ramirez, C. Company, A. Schmidt, T. Reijmers, V. v. S. Paul, F. Marabita, J. Rodríguez-Ubreva, A. Garcia-Gomez, T. Carroll, L. Cooper, Z. Liang, G. Dharmalingam, F. van der Kloet, A.C. Harms, L. Balzano-Nogueira, V. Lagani, I. Tsamardinos, M. Lappe, D. Maier, J.A. Westerhuis, T. Hankemeier, A. Imhof, E. Ballestar, A. Mortazavi, M. Merkenschlager, J. Tegner, A. Conesa, STATegra, a comprehensive multi-omics dataset of B-cell differentiation in mouse., Scientific data 6 (1) (2019) 256. doi:10.1038/s41597-019-0202-7. [DOI] [PMC free article] [PubMed]
- 14.Esteban-Gil A., Pérez-Sanz F., García-Solano J., Alburquerque-González B., Parreño-González M.A., Legaz-García M.D.C., Fernández-Breis J.T., Rodriguez-Braun E., Pimentel P., Tuomisto A., Mäkinen M., Slaby O., Conesa-Zamora P. ColPortal, an integrative multiomic platform for analysing epigenetic interactions in colorectal cancer. Sci Data. 2019;6(1):255. doi: 10.1038/s41597-019-0198-z. [DOI] [PMC free article] [PubMed] [Google Scholar]
- 15.Y. Perez-Riverol, M. Bai, F. da Veiga Leprevost, S. Squizzato, Y.M. Park, K. Haug, A.J. Carroll, D. Spalding, J. Paschall, M. Wang, N. Del-Toro, T. Ternent, P. Zhang, N. Buso, N. Bandeira, E.W. Deutsch, D.S. Campbell, R.C. Beavis, R.M. Salek, U. Sarkans, R. Petryszak, M. Keays, E. Fahy, M. Sud, S. Subramaniam, A. Barbera, R.C. Jiménez, A.I. Nesvizhskii, S.-A. Sansone, C. Steinbeck, R. Lopez, J.A. Vizcaíno, P. Ping, H. Hermjakob, Discovering and linking public omics data sets using the Omics Discovery Index. (5 2017). doi:10.1038/nbt.3790. [DOI] [PMC free article] [PubMed]
- 16.Zitnik M., Nguyen F., Wang B., Leskovec J., Goldenberg A., Hoffman M.M. Machine learning for integrating data in biology and medicine: Principles, practice, and opportunities. Inform Fusion. 2019;50:71–91. doi: 10.1016/j.inffus.2018.09.012. https://www.sciencedirect.com/science/article/pii/S1566253518304482. [DOI] [PMC free article] [PubMed] [Google Scholar]
- 17.Hofree M., Shen J.P., Carter H., Gross A., Ideker T. Network-based stratification of tumor mutations. Nature Methods. 2013;10(11):1108–1115. doi: 10.1038/nmeth.2651. https://pubmed.ncbi.nlm.nih.gov/24037242 https://www.ncbi.nlm.nih.gov/pmc/articles/PMC3866081/ [DOI] [PMC free article] [PubMed] [Google Scholar]
- 18.Wang B., Mezlini A.M., Demir F., Fiume M., Tu Z., Brudno M., Haibe-Kains B., Goldenberg A. Similarity network fusion for aggregating data types on a genomic scale. Nat Methods. 2014;11(3):333–337. doi: 10.1038/nmeth.2810. [DOI] [PubMed] [Google Scholar]
- 19.Li C.-X., Wheelock C.E., Sköld C.M., Wheelock r.A.M. Integration of multi-omics datasets enables molecular classification of COPD. Eur Respir J. 2018;51(5) doi: 10.1183/13993003.01930-2017. https://erj.ersjournals.com/content/51/5/1701930. [DOI] [PubMed] [Google Scholar]
- 20.Rappoport N., Shamir R. NEMO: cancer subtyping by integration of partial multi-omic data. Bioinformatics. 2019;35(18):3348–3356. doi: 10.1093/bioinformatics/btz058. [DOI] [PMC free article] [PubMed] [Google Scholar]
- 21.Witten D.M., Tibshirani R.J. Extensions of sparse canonical correlation analysis with applications to genomic data. Stat Appl Genetics Mol Biol. 2009;8(1):Article28. doi: 10.2202/1544-6115.1470. [DOI] [PMC free article] [PubMed] [Google Scholar]
- 22.Speicher N.K., Pfeifer N. Integrating different data types by regularized unsupervised multiple kernel learning with application to cancer subtype discovery. Bioinformatics. 2015;31(12):i268–i275. doi: 10.1093/bioinformatics/btv244. [DOI] [PMC free article] [PubMed] [Google Scholar]
- 23.Gligorijević V., Pržulj N., Gligorijevic V. Methods for biological data integration: Perspectives and challenges. J R Soc Interface. 2015;12(112) doi: 10.1098/rsif.2015.0571. [DOI] [PMC free article] [PubMed] [Google Scholar]
- 24.Li Y., Wu F.-X., Ngom A. A review on machine learning principles for multi-view biological data integration. Briefings Bioinform. 2018;19(2):325–340. doi: 10.1093/bib/bbw113. [DOI] [PubMed] [Google Scholar]
- 25.Rappoport N., Shamir R. Multi-omic and multi-view clustering algorithms: review and cancer benchmark. Nucleic Acids Res. 2018;46(20):10546–10562. doi: 10.1093/nar/gky889. [DOI] [PMC free article] [PubMed] [Google Scholar]
- 26.Ramazzotti D., Lal A., Wang B., Batzoglou S., Sidow A. Multi-omic tumor data reveal diversity of molecular mechanisms that correlate with survival. Nature Commun. 2018;9(1):4453. doi: 10.1038/s41467-018-06921-8. [DOI] [PMC free article] [PubMed] [Google Scholar]
- 27.Mariette J., Villa-Vialaneix N. Unsupervised multiple kernel learning for heterogeneous data integration. Bioinformatics. 2018;34(6):1009–1015. doi: 10.1093/bioinformatics/btx682. [DOI] [PubMed] [Google Scholar]
- 28.Zhang S., Liu C.-C., Li W., Shen H., Laird P.W., Zhou X.J. Discovery of multi-dimensional modules by integrative analysis of cancer genomic data. Nucleic Acids Res. 2012;40(19):9379–9391. doi: 10.1093/nar/gks725. [DOI] [PMC free article] [PubMed] [Google Scholar]
- 29.Yang Z., Michailidis G. A non-negative matrix factorization method for detecting modules in heterogeneous omics multi-modal data. Bioinformatics (Oxford, England) 2016;32(1):1–8. doi: 10.1093/bioinformatics/btv544. [DOI] [PMC free article] [PubMed] [Google Scholar]
- 30.Alcala N., Leblay N., Gabriel A.A.G., Mangiante L., Hervas D., Giffon T., Sertier A.S., Ferrari A., Derks J., Ghantous A., Delhomme T.M., Chabrier A., Cuenin C., Abedi-Ardekani B., Boland A., Olaso R., Meyer V., Altmuller J., Le Calvez-Kelm F., Durand G., Voegele C., Boyault S., Moonen L., Lemaitre N., Lorimier P., Toffart A.C., Soltermann A., Clement J.H., Saenger J., Field J.K., Brevet M., Blanc-Fournier C., Galateau-Salle F., Le Stang N., Russell P.A., Wright G., Sozzi G., Pastorino U., Lacomme S., Vignaud J.M., Hofman V., Hofman P., Brustugun O.T., Lund-Iversen M., Thomas de Montpreville V., Muscarella L.A., Graziano P., Popper H., Stojsic J., Deleuze J.F., Herceg Z., Viari A., Nuernberg P., Pelosi G., Dingemans A.M.C., Milione M., Roz L., Brcic L., Volante M., Papotti M.G., Caux C., Sandoval J., Hernandez-Vargas H., Brambilla E., Speel E.J.M., Girard N., Lantuejoul S., McKay J.D., Foll M., Fernandez-Cuesta L. Integrative and comparative genomic analyses identify clinically relevant pulmonary carcinoid groups and unveil the supra-carcinoids. Nature Commun. 2019;10(1):3407. doi: 10.1038/s41467-019-11276-9. [DOI] [PMC free article] [PubMed] [Google Scholar]
- 31.Q. Mo, R. Shen, C. Guo, M. Vannucci, K.S. Chan, S.G. Hilsenbeck, A fully Bayesian latent variable model for integrative clustering analysis of multi-type omics data., Biostatistics (Oxford, England) 19 (1) (2018) 71–86. doi:10.1093/biostatistics/kxx017. [DOI] [PMC free article] [PubMed]
- 32.Demirel H.C., Arici M.K., Tuncbag N. Computational approaches leveraging integrated connections of multi-omic data toward clinical applications. Molecular omics. 2022;18(1):7–18. doi: 10.1039/d1mo00158b. [DOI] [PubMed] [Google Scholar]
- 33.Wu D., Wang D., Zhang M.Q., Gu J. Fast dimension reduction and integrative clustering of multi-omics data using low-rank approximation: application to cancer molecular classification. BMC genomics. 2015;16:1022. doi: 10.1186/s12864-015-2223-8. [DOI] [PMC free article] [PubMed] [Google Scholar]
- 34.Meng C., Helm D., Frejno M., Kuster B. moCluster: Identifying Joint Patterns Across Multiple Omics Data Sets. J Proteome Res. 2016;15(3):755–765. doi: 10.1021/acs.jproteome.5b00824. [DOI] [PubMed] [Google Scholar]
- 35.Meng C., Kuster B., Culhane A.C., Gholami A.M. A multivariate approach to the integration of multi-omics datasets. BMC Bioinform. 2014;15(1):1–13. doi: 10.1186/1471-2105-15-162. [DOI] [PMC free article] [PubMed] [Google Scholar]
- 36.Tenenhaus M., Tenenhaus A., Groenen P.J.F. Regularized Generalized Canonical Correlation Analysis: A Framework for Sequential Multiblock Component Methods. Psychometrika. 2017;82(3):737–777. doi: 10.1007/s11336-017-9573-x. [DOI] [PubMed] [Google Scholar]
- 37.Cantini L., Zakeri P., Hernandez C., Naldi A., Thieffry D., Remy E., Baudot A. Benchmarking joint multi-omics dimensionality reduction approaches for the study of cancer. Nature Commun. 2021;12(1):1–12. doi: 10.1038/s41467-020-20430-7. [DOI] [PMC free article] [PubMed] [Google Scholar]
- 38.Rappoport N., Shamir R. Multi-omic and multi-view clustering algorithms: review and cancer benchmark. Nucleic Acids Res. 2018;46(20):10546–10562. doi: 10.1093/nar/gky889. [DOI] [PMC free article] [PubMed] [Google Scholar]
- 39.Park C., Ha J., Park S. Prediction of Alzheimer’s disease based on deep neural network by integrating gene expression and DNA methylation dataset. Expert Syst Appl. 2020;140 doi: 10.1016/j.eswa.2019.112873. https://www.sciencedirect.com/science/article/pii/S0957417419305834. [DOI] [Google Scholar]
- 40.Kline A., Wang H., Li Y., Dennis S., Hutch M., Xu Z., Wang F., Cheng F., Luo Y. Multimodal machine learning in precision health: A scoping review. npj Digital Med. 2022;5(1):171. doi: 10.1038/s41746-022-00712-8. [DOI] [PMC free article] [PubMed] [Google Scholar]
- 41.Wang T., Shao W., Huang Z., Tang H., Zhang J., Ding Z., Huang K. MOGONET integrates multi-omics data using graph convolutional networks allowing patient classification and biomarker identification. Nature Commun. 2021;12(1):3445. doi: 10.1038/s41467-021-23774-w. [DOI] [PMC free article] [PubMed] [Google Scholar]
- 42.Yang H., Chen R., Li D., Wang Z. Subtype-GAN: a deep learning approach for integrative cancer subtyping of multi-omics data. Bioinformatics. 2021;37(16):2231–2237. doi: 10.1093/bioinformatics/btab109. [DOI] [PubMed] [Google Scholar]
- 43.R. Argelaguet, B. Velten, D. Arnol, S. Dietrich, T. Zenz, J.C. Marioni, W. Huber, F. Buettner, O. Stegle, Multi-Omics factor analysis - A framework for unsupervised integration of multi-omic data sets, bioRxiv (2017). doi:10.1101/217554. [DOI] [PMC free article] [PubMed]
- 44.Lock E.F., Hoadley K.A., Marron J.S., Nobel A.B. Joint and individual variation explained (JIVE) for integrated analysis of multiple data types. Ann Appl Stat. 2013;7(1):523–542. doi: 10.1214/12-AOAS597. [DOI] [PMC free article] [PubMed] [Google Scholar]
- 45.Chalise P., Fridley B.L. Integrative clustering of multi-level ’omic data based on non-negative matrix factorization algorithm. PloS one. 2017;12(5) doi: 10.1371/journal.pone.0176278. [DOI] [PMC free article] [PubMed] [Google Scholar]
- 46.Fujita N., Mizuarai S., Murakami K., Nakai K. Biomarker discovery by integrated joint non-negative matrix factorization and pathway signature analyses. Sci Rep. 2018;8(1):9743. doi: 10.1038/s41598-018-28066-w. [DOI] [PMC free article] [PubMed] [Google Scholar]
- 47.M. Qianxing, W. Sijian, S.V.E., O.A.B., S. Nikolaus, S. Chris, P.R. Scott, L. Marc, S. Ronglai, Pattern discovery and cancer gene identification in integrated cancer genomic data, Proceedings of the National Academy of Sciences 110 (11) (2013) 4245–4250. doi:10.1073/pnas.1208949110. [DOI] [PMC free article] [PubMed]
- 48.J. Li, Q. Lu, Y. Wen, Multi-kernel linear mixed model with adaptive lasso for prediction analysis on high-dimensional multi-omics data., Bioinformatics (Oxford, England) 36 (6) (2020) 1785–1794. doi:10.1093/bioinformatics/btz822. [DOI] [PMC free article] [PubMed]
- 49.Wang W., Baladandayuthapani V., Morris J.S., Broom B.M., Manyam G., Do K.-A. iBAG: integrative Bayesian analysis of high-dimensional multiplatform genomics data. Bioinformatics. 2013;29(2):149–159. doi: 10.1093/bioinformatics/bts655. [DOI] [PMC free article] [PubMed] [Google Scholar]
- 50.Yuan L., Guo L.-H., Yuan C.-A., Zhang Y.-H., Han K., Nandi A., Honig B., Huang D.-S. Integration of Multi-omics Data for Gene Regulatory Network Inference and Application to Breast Cancer. IEEE/ACM Trans Comput Biol Bioinform. 2018;8 doi: 10.1109/TCBB.2018.2866836. [DOI] [PubMed] [Google Scholar]
- 51.Zarayeneh N., Ko E., Oh J.H., Suh S., Liu C., Gao J., Kim D., Kang M. Integration of multi-omics data for integrative gene regulatory network inference. Int J Data Mining Bioinform. 2017;18(3):223–239. doi: 10.1504/IJDMB.2017.10008266. [DOI] [PMC free article] [PubMed] [Google Scholar]
- 52.F. Rohart, B. Gautier, A. Singh, K.A. Lê Cao, mixOmics: an R package for ’omics feature selection and multiple data integration, bioRxiv (2017) 1–19. doi:10.1101/108597. [DOI] [PMC free article] [PubMed]
- 53.Lê Cao K.-A., Boitard S., Besse P. Sparse PLS discriminant analysis: biologically relevant feature selection and graphical displays for multiclass problems. BMC Bioinform. 2011;12(1):253. doi: 10.1186/1471-2105-12-253. [DOI] [PMC free article] [PubMed] [Google Scholar]
- 54.A. Singh, C.P. Shannon, B. Gautier, F. Rohart, M. Vacher, S.J. Tebbutt, K.-A. Lê Cao, DIABLO: an integrative approach for identifying key molecular drivers from multi-omics assays., Bioinformatics (Oxford, England) 35 (17) (2019) 3055–3062. doi:10.1093/bioinformatics/bty1054. [DOI] [PMC free article] [PubMed]
- 55.W. Li, S. Zhang, C.-C. Liu, X.J. Zhou, Identifying multi-layer gene regulatory modules from multi-dimensional genomic data., Bioinformatics (Oxford, England) 28 (19) (2012) 2458–2466. doi:10.1093/bioinformatics/bts476. [DOI] [PMC free article] [PubMed]
- 56.Lemsara A., Ouadfel S., Fröhlich H. PathME: pathway based multi-modal sparse autoencoders for clustering of patient-level multi-omics data. BMC Bioinform. 2020;21(1):146. doi: 10.1186/s12859-020-3465-2. [DOI] [PMC free article] [PubMed] [Google Scholar]
- 57.Pierre-Jean M., Deleuze J.-F., Le Floch E., Mauger F. Clustering and variable selection evaluation of 13 unsupervised methods for multi-omics data integration. Briefings Bioinform. 2020;21(6):2011–2030. doi: 10.1093/bib/bbz138. [DOI] [PubMed] [Google Scholar]
- 58.Rodosthenous T., Shahrezaei V., Evangelou M. Integrating multi-OMICS data through sparse canonical correlation analysis for the prediction of complex traits: a comparison study. Bioinformatics. 2020;36(17):4616–4625. doi: 10.1093/bioinformatics/btaa530. [DOI] [PMC free article] [PubMed] [Google Scholar]
- 59.Garali I., Adanyeguh I.M., Ichou F., Perlbarg V., Seyer A., Colsch B., Moszer I., Guillemot V., Durr A., Mochel F., Tenenhaus A. A strategy for multimodal data integration: application to biomarkers identification in spinocerebellar ataxia. Briefings Bioinform. 2018;19(6):1356–1369. doi: 10.1093/bib/bbx060. [DOI] [PubMed] [Google Scholar]
- 60.Tenenhaus A., Tenenhaus M. Regularized generalized canonical correlation analysis for multiblock or multigroup data analysis. Eur J Oper Res. 2014;238(2):391–403. doi: 10.1016/j.ejor.2014.01.008. https://www.sciencedirect.com/science/article/pii/S0377221714000101. [DOI] [Google Scholar]
- 61.Metwaly A., Dunkel A., Waldschmitt N., Raj A.C.D., Lagkouvardos I., Corraliza A.M., Mayorgas A., Martinez-Medina M., Reiter S., Schloter M., Hofmann T., Allez M., Panes J., Salas A., Haller D. Integrated microbiota and metabolite profiles link Crohn’s disease to sulfur metabolism. Nature Commun. 2020;11(1):4322. doi: 10.1038/s41467-020-17956-1. [DOI] [PMC free article] [PubMed] [Google Scholar]
- 62.González I., Cao K.-A.L., Davis M.J., Déjean S. Visualising associations between paired ‘omics’ data sets. BioData Mining. 2012;5(1):19. doi: 10.1186/1756-0381-5-19. [DOI] [PMC free article] [PubMed] [Google Scholar]
- 63.Xicota L., Ichou F., Lejeune F.-X., Colsch B., Tenenhaus A., Leroy I., Fontaine G., Lhomme M., Bertin H., Habert M.-O., Epelbaum S., Dubois B., Mochel F., Potier M.-C. Multi-omics signature of brain amyloid deposition in asymptomatic individuals at-risk for Alzheimer’s disease: The INSIGHT-preAD study. EBioMedicine. 2019;47:518–528. doi: 10.1016/j.ebiom.2019.08.051. [DOI] [PMC free article] [PubMed] [Google Scholar]
- 64.Frost H.R., Li Z., Moore J.H. Principal component gene set enrichment (PCGSE) BioData Mining. 2015;8:25. doi: 10.1186/s13040-015-0059-z. [DOI] [PMC free article] [PubMed] [Google Scholar]
- 65.Titz B., Szostak J., Sewer A., Phillips B., Nury C., Schneider T., Dijon S., Lavrynenko O., Elamin A., Guedj E., Tsin Wong E., Lebrun S., Vuillaume G., Kondylis A., Gubian S., Cano S., Leroy P., Keppler B., Ivanov N.V., Vanscheeuwijck P., Martin F., Peitsch M.C., Hoeng J. Multi-omics systems toxicology study of mouse lung assessing the effects of aerosols from two heat-not-burn tobacco products and cigarette smoke, Computational and Structural. Biotechnol J. 2020;18:1056–1073. doi: 10.1016/j.csbj.2020.04.011. https://www.sciencedirect.com/science/article/pii/S2001037019305707. [DOI] [PMC free article] [PubMed] [Google Scholar]
- 66.Petralia F., Wang P., Yang J., Tu Z. Integrative random forest for gene regulatory network inference. Bioinformatics. 2015;31(12):i197–i205. doi: 10.1093/bioinformatics/btv268. [DOI] [PMC free article] [PubMed] [Google Scholar]
- 67.Hasin Y., Seldin M., Lusis A. Multi-omics approaches to disease. Genome Biol. 2017;18(1):1–15. doi: 10.1186/s13059-017-1215-1. [DOI] [PMC free article] [PubMed] [Google Scholar]
- 68.Žitnik M., Zupan B. Gene network inference by fusing data from diverse distributions. Bioinformatics. 2015;31(12):i230–i239. doi: 10.1093/bioinformatics/btv258. [DOI] [PMC free article] [PubMed] [Google Scholar]
- 69.Chu J., Sun N.A., Hu W., Chen X., Yi N., Shen Y. The Application of Bayesian Methods in Cancer Prognosis and Prediction. Cancer Genomics Proteomics. 2022;19(1):1–11. doi: 10.21873/cgp.20298. [DOI] [PMC free article] [PubMed] [Google Scholar]
- 70.Chen S., Mar J.C. Evaluating methods of inferring gene regulatory networks highlights their lack of performance for single cell gene expression data. BMC Bioinform. 2018;19(1):232. doi: 10.1186/s12859-018-2217-z. [DOI] [PMC free article] [PubMed] [Google Scholar]
- 71.G. Zhou, S. Li, J. Xia, Network-Based Approaches for Multi-omics Integration BT - Computational Methods and Data Analysis for Metabolomics, in: S. Li (Ed.), Computational Methods and Data Analysis for Metabolomics, Springer US, New York, NY, 2020, pp. 469–487. doi:10.1007/978-1-0716-0239-3_23. [DOI] [PubMed]
- 72.Tuncbag N., Gosline S.J.C., Kedaigle A., Soltis A.R., Gitter A., Fraenkel E. Network-Based Interpretation of Diverse High-Throughput Datasets through the Omics Integrator Software Package. PLOS Comput Biol. 2016;12(4) doi: 10.1371/journal.pcbi.1004879. [DOI] [PMC free article] [PubMed] [Google Scholar]
- 73.Dugourd A., Kuppe C., Sciacovelli M., Gjerga E., Gabor A., Emdal K.B., Vieira V., Bekker-Jensen D.B., Kranz J., Bindels E., Costa A.S.H., Sousa A., Beltrao P., Rocha M., Olsen J.V., Frezza C., Kramann R., Saez-Rodriguez J. Causal integration of multi-omics data with prior knowledge to generate mechanistic hypotheses. Mol Syst Biol. 2021;17(1) doi: 10.15252/msb.20209730. https://doi.org/10.15252/msb.20209730. [DOI] [PMC free article] [PubMed] [Google Scholar]
- 74.Liu A., Trairatphisan P., Gjerga E., Didangelos A., Barratt J., Saez-Rodriguez J. From expression footprints to causal pathways: contextualizing large signaling networks with CARNIVAL. npj Syst Biol Appl. 2019;5(1):40. doi: 10.1038/s41540-019-0118-z. [DOI] [PMC free article] [PubMed] [Google Scholar]
- 75.Koh H.W., Fermin D., Vogel C., Choi K.P., Ewing R.M., Choi H. Bhttps://doi.org/10.1038/s41540-019-0099-yiOmicsPASS: network-based integration of multiomics data for predictive subnetwork discovery. npj Syst Biol Appl. 2019;5(1) doi: 10.1038/s41540-019-0099-y. [DOI] [PMC free article] [PubMed] [Google Scholar]
- 76.Maghsoudi Z., Nguyen H., Tavakkoli A., Nguyen T. A comprehensive survey of the approaches for pathway analysis using multi-omics data integration. Briefings Bioinform. 2022:bbac435. doi: 10.1093/bib/bbac435. [DOI] [PMC free article] [PubMed] [Google Scholar]
- 77.Hernández-de Diego R., Tarazona S., Martínez-Mira C., Balzano-Nogueira L., Furió-Tarí P., Pappas G.J.J., Conesa A. PaintOmics 3: a web resource for the pathway analysis and visualization of multi-omics data. Nucleic Acids Res. 2018;46(W1):W503–W509. doi: 10.1093/nar/gky466. [DOI] [PMC free article] [PubMed] [Google Scholar]
- 78.Canzler S., Hackermüller J. multiGSEA: a GSEA-based pathway enrichment analysis for multi-omics data. BMC Bioinformatics. 2020;21(1):561. doi: 10.1186/s12859-020-03910-x. [DOI] [PMC free article] [PubMed] [Google Scholar]
- 79.M. Paczkowska, J. Barenboim, N. Sintupisut, N.S. Fox, H. Zhu, D. Abd-Rabbo, M.W. Mee, P.C. Boutros, F. Abascal, S.B. Amin, G.D. Bader, R. Beroukhim, J. Bertl, K.A. Boroevich, S. Brunak, P.J. Campbell, J. Carlevaro-Fita, D. Chakravarty, C.W.Y. Chan, K. Chen, J.K. Choi, J. Deu-Pons, P. Dhingra, K. Diamanti, L. Feuerbach, J.L. Fink, N.A. Fonseca, J. Frigola, C. Gambacorti-Passerini, D.W. Garsed, M. Gerstein, G. Getz, A. Gonzalez-Perez, Q. Guo, I.G. Gut, D. Haan, M.P. Hamilton, N.J. Haradhvala, A.O. Harmanci, M. Helmy, C. Herrmann, J.M. Hess, A. Hobolth, E. Hodzic, C. Hong, H. Hornshój, K. Isaev, J.M.G. Izarzugaza, R. Johnson, T.A. Johnson, M. Juul, R.I. Juul, A. Kahles, A. Kahraman, M. Kellis, E. Khurana, J. Kim, J.K. Kim, Y. Kim, J. Komorowski, J.O. Korbel, S. Kumar, A. Lanzós, M.S. Lawrence, D. Lee, K.-V. Lehmann, S. Li, X. Li, Z. Lin, E.M. Liu, L. Lochovsky, S. Lou, T. Madsen, K. Marchal, I. Martincorena, A. Martinez-Fundichely, Y.E. Maruvka, P.D. McGillivray, W. Meyerson, F. Muiños, L. Mularoni, H. Nakagawa, M.M. Nielsen, K. Park, K. Park, J.S. Pedersen, O. Pich, T. Pons, S. Pulido-Tamayo, B.J. Raphael, I. Reyes-Salazar, M.A. Reyna, E. Rheinbay, M.A. Rubin, C. Rubio-Perez, R. Sabarinathan, S.C. Sahinalp, G. Saksena, L. Salichos, C. Sander, S.E. Schumacher, M. Shackleton, O. Shapira, C. Shen, R. Shrestha, S. Shuai, N. Sidiropoulos, L. Sieverling, N. Sinnott-Armstrong, L.D. Stein, J.M. Stuart, D. Tamborero, G. Tiao, T. Tsunoda, H.M. Umer, L. Uusküla-Reimand, A. Valencia, M. Vazquez, L.P.C. Verbeke, C. Wadelius, L. Wadi, J. Wang, J. Warrell, S.M. Waszak, J. Weischenfeldt, D.A. Wheeler, G. Wu, J. Yu, J. Zhang, X. Zhang, Y. Zhang, Z. Zhao, L. Zou, C. von Mering, J. Reimand, P.D. Group, F.I. Working, P. Consortium, Integrative pathway enrichment analysis of multivariate omics data, Nature Communications 11 (1) (2020) 735. doi:10.1038/s41467-019-13983-9. [DOI] [PMC free article] [PubMed]
- 80.C. Meng, A. Basunia, B. Peters, A.M. Gholami, B. Kuster, A.C. Culhane, MOGSA: Integrative Single Sample Gene-set Analysis of Multiple Omics Data., Molecular & cellular proteomics: MCP 18 (8 suppl 1) (2019) S153–S168. doi:10.1074/mcp.TIR118.001251. [DOI] [PMC free article] [PubMed]
- 81.Hawe J.S., Theis F.J., Heinig M. Inferring Interaction Networks From Multi-Omics Data. Front Genetics. 2019;10 doi: 10.3389/fgene.2019.00535. https://www.frontiersin.org/article/10.3389/fgene.2019.00535. [DOI] [PMC free article] [PubMed] [Google Scholar]
- 82.Sedgewick A.J., Shi I., Donovan R.M., Benos P.V. Learning mixed graphical models with separate sparsity parameters and stability-based model selection. BMC Bioinformatics. 2016;17(5):S175. doi: 10.1186/s12859-016-1039-0. [DOI] [PMC free article] [PubMed] [Google Scholar]
- 83.Chervova O., Conde L., Guerra-Assunção J.A., Moghul I., Webster A.P., Berner A., et al. The Personal Genome Project-UK, an open access resource of human multi-omics data. Scientific Data. 2019;6(1):257. doi: 10.1038/s41597-019-0205-4. [DOI] [PMC free article] [PubMed] [Google Scholar]
- 84.Griss J., Viteri G., Sidiropoulos K., Nguyen V., Fabregat A., Hermjakob H. ReactomeGSA - Efficient Multi-Omics Comparative Pathway Analysis. Molecular & Cellular Proteomics : MCP. 2020;19(12):2115–2125. doi: 10.1074/mcp.TIR120.002155. [DOI] [PMC free article] [PubMed] [Google Scholar]
- 85.Pang Z., Chong J., Zhou G., de Lima Morais D.A., Chang L., Barrette M., Gauthier C., Jacques P.-É., Li S., Xia J. MetaboAnalyst 5.0: narrowing the gap between raw spectra and functional insights. Nucleic Acids Research. 2021;49(W1):W388–W396. doi: 10.1093/nar/gkab382. [DOI] [PMC free article] [PubMed] [Google Scholar]
- 86.Kamburov A., Cavill R., Ebbels T.M.D., Herwig R., Keun H.C. Integrated pathway-level analysis of transcriptomics and metabolomics data with IMPaLA. Bioinformatics (Oxford, England) 2011;27(20):2917–2918. doi: 10.1093/bioinformatics/btr499. [DOI] [PubMed] [Google Scholar]