

Abstract
Microswimmers such as bacteria exhibit large speed fluctuation when exploring their living environment. Here, we show that the bacterium Escherichia coli with a wide range of length speeds up beyond its free-swimming speed when passing through narrow and short confinement. The speedup is observed in two modes: for short bacteria with L <20 μm, the maximum speed occurs when the cell body leaves the confinement, but a flagellar bundle is still confined. For longer bacteria (L ≥ 20 μm), the maximum speed occurs when the middle of the cell, where the maximum number of flagellar bundles locate, is confined. The two speed-up modes are explained by a vanishing body drag and an increased flagella drag—a universal property of an “ideal swimmer.” The spatial variance of speed can be quantitatively explained by a simple model based on the resistance matrix of a partially confined bacterium. The speed change depends on the distribution of motors, and the latter is confirmed by fluorescent imaging of flagellar hooks. By measuring the duration of slowdown and speedup, we find that the effective chemotaxis is biased in filamentous bacteria, which might benefit their survival. The experimental setup can be useful to study the motion of microswimmers near surfaces with different surface chemistry.
Significance
Given the viscous origin of the flagellar locomotion, it is still experimentally elusive whether a bacterium can speed up under confinement. A new microfluidic device is developed based on a laser tweezer and micromanipulation to study the swimming speed of a bacterium passing through short quasi-1D confinement. Enhanced locomotion of flagellar bundles is experimentally verified in filamentous Escherichia coli bacteria by exploring a large parameter space of cell length and flagellar distribution. The escaping speed of bacteria can be described by a simple hydrodynamic model. The understanding of bacterial escaping speed provides evolutionary insights and will inspire the design of artificial swimmers in confined geometries.
Introduction
Large speed fluctuation is observed when a bacterium explores a complex environment such as in a porous medium (1). In a polymer solution, bacteria swim faster than in a simple Newtonian fluid (2). These speed variances have important biological meanings: slowdown is equivalent to tumbling in negative chemotaxis, and speedup is equivalent to persistent motion in positive chemotaxis. Collectively, bacteria exploit nongenetic cell-to-cell variability of mobility (3) and escape from confinement more efficiently (4) than individuals (5). On the individual level, it is intuitive when a microswimmer slows down sensing repellents or meeting an obstacle (6). However, how and why a bacterium speeds up under confinement demands further investigation. Understanding bacterial speedup will provide significant insight into the interaction between locomotion and evolution.
As an assembly of mechanical parts—flagellar motor, hook, and flagellar filament—a bacterium may alter speed due to changes that are made to the individual parts or the configuration of the assembly. Common mechanisms are summarized in Table 1. In a polymer solution, for example, the orientation of the flagella and the cell body are aligned, and the speed of the bacterium is increased (2). A suppression of large-scale orbital motion also increases the time-averaged bacterial speed (10). However, on a single flagellum level, if the locomotion is varied in these experiments has not been fully justified. Given the viscous origin of flagellar locomotion, an increase of drag near a boundary wall speeds up a flagellum at constant rotating speed or constant torque (7,8). The corresponding timescale is faster than any biological process. Despite being simple, the mechanism is difficult to test by putting a bacterium under a long-and-narrow-channel type of confinement: first, as half of the viscous drag is due to the cell body, it has been shown that a bacterium only speeds up at a transient state when the body drag is diminishing (9). Second, it is challenging to visualize flagella in narrow and elastic confinement to verify the speed-up mechanism. In this article, we aim to verify the hydrodynamic mechanisms for the bacteria speedup under the confinement. To answer the question of whether a bacterium can speed up under confinement due to a hydrodynamic reason, we study the speed variance of bacteria passing through narrow and short confinement by combining cell culture and a microfluidic device.
Table 1.
Mechanisms related to bacterial speed change under confinement
A normal bacterium has a polar distribution of thrust (flagella) and load (cell body). A misalignment between the two, a so-called wobble angle, complicates the study on the viscous effect. In comparison, a filamentous cell (see materials and methods) has a symmetric thrust-load distribution to the center of the cell and does not wobble. Filamentous cells with multiple flagella along the cell body are found in a generic bacterial population, which contribute to the collective behavior of bacteria under stress. Drug-induced filamentous bacteria have been used as a model system for the study of the collective motion of active matter due to their strong alignment (14,15). The drag of the cell body is homogeneous along its length due to a constant width (16). Once the number and distribution of flagellar bundles are measured, e.g., based on the observation of fluorescence-labeled hooks (17), a hydrodynamic model such as the resistance matrix can be built for a filamentous bacterium. The model can be used to quantify the high motility of filamentous cells and will provide a foundation in explaining the speed change of a bacterium of different lengths under confinement.
Using bacteria with different thrust-load distributions, such as filamentous cells, enables one to test the confined hydrodynamic theory. However, the hydrodynamic effect due to the cell body and the one due to the flagella are still not separable in a long and narrow channel (9), which is used in simulating a confined flagellum without a cell body (7). To experimentally study a confined flagellum (or flagellar bundle), we build confinement that is shorter than a flagellum by using optical tweezers and microparticles. The confinement has reconfigurable geometry, adjustable elasticity, and desirable surface chemistry (18). Confinement built this way can be used to mimic realistic confinement such as a porous medium, and it will provide broad opportunities to study bacterium-wall interactions.
The article is organized as follows: first, the cell culture, experimental setup, and theoretical methods are discussed. Second, experimental results on the characterization of bacteria and escaping speeds of bacteria of different lengths are shown. Finally, we compare our theory with experiment and discuss the biological implications.
Materials and methods
Culturing bacteria of different body lengths
E. coli bacteria BW25113 is cultured with 2 mL of Terrific Broth with 100 μg/mL ampicillin at 37°C for 15 h. The saturated culture is then diluted at 1:100 (30 μL in 3 mL) into fresh Terrific Broth (TB) at 30°C and shaken at 250 Rpm for different amounts of time. To obtain bacteria with a normal length of ∼3 μm, the diluted suspension is cultured for 6 h. To obtain filamentous bacteria with a body length L ∼ 10 μm, the diluted suspension is cultured for 3.5 h. Then, cephalexin (90 μg/mL) and Tween20 (0.1%) are added for a further 1.5 h culturing. To obtain bacteria with L ∼ 16 μm, the diluted suspension is cultured for 1.5 h. Cephalexin and Tween20 of the same concentration are then added for the second stage of culture, which lasts 3.5 h. For very long bacteria with L >20 μm, the diluted suspension is cultured for 1.5 h. Then, cephalexin and Tween20 of the same concentration are added. The incubation continues for an additional 4–4.5 h. The length of time after the addition of cephalexin determines the final length of the bacteria. Bacterial cells are then harvested and washed twice with 2 mL mobility buffer or deionized water by centrifugation. The width of the cell body is found to be independent of L, as reported previously (16).
Fluorescent labeling motor hooks and flagella
The E. coli strain (MTB9) with biotinylated hook was used (17). The cells were cultured in 2 mL TB with 50 μg/mL Kanamycin at 37°C for 12 h. The saturated culture was then diluted at 1:100 (30 μL in 3 mL) into fresh TB with Kanamycin at 30°C and shaken at 200 Rpm for 90 min. Then, cephalexin (90 μg/mL) and Tween20 (0.001%) were added for the second stage of culture, which lasted 2 h and 3 h 45 min for 16 and 30–40 μm long cells, respectively. Bacterial cells were then harvested and washed four times with 500 μL motility buffer (MB; 10 mM KPO4, 0.1 mM EDTA) by centrifugation. To label the bacterial flagellar hook, the cells were transferred into 500 μL MB with 0.5 μM Streptavidin-Alexa Fluor 594 and incubated at room temperature for 20 min in a dark chamber. The cells were washed four times with 500 μL MB and then concentrated to OD600 = 3. Cells were immobilized on a gel pad for observation. 0.4 μL cells were placed on an agarose pad (1% gel in TB) and imaged by a Nikon TiE microscope equipped with a 100× objective (100× lambda oil, numerical aperture = 1.45) and a 580 nm LED illumination (pE4000, CoolLED, Andover, UK) with a customized filter cube (FF01-589/18; Di02-R594; FF01-650/60). The image was captured with 500 ms exposure time by an electron-multiplying charge-coupled-device camera (iXon Ultra Life 888, Andor, Belfast, UK). Phase-contrast images and fluorescence images are taken alternatively with 7 z-axis scans with 200 nm height intervals. To determine the distribution of the motors on long cells, a customized program was written with the following steps. First, the phase-contrast images were binarized and skeletonized (19). The cellular central lines were found by the polynomial fitting of the skeletons. Then, the cells were categorized by their length. The bacterial flagellar motor central positions were found by the fluorescent images. To quantitate the position of the motors on the cells, a cell coordinate x′,y′ centered in one end of the cells was defined where x′ represents the axial position and y′ represents the lateral positions. The axial position x′ of motors can be found by finding the closest point from the motor central position to the central line.
Flagella are labeled with Alexa Fluor 532 using a standard method (20), which labels both flagella and cell bodies. The fluorescent images are used to measure the length of flagella and wobble angle.
Construction of spatial confinements
In the first setup, a dilute suspension of bacteria (OD = 0.5) premixed with micron-sized silica beads (Bangs Lab, Fishers, IN, USA) of different diameters and a final concentration 0.05% (w/v) is sandwiched between a glass slide and a coverslip and sealed using UV-curable glue. A multipoint laser tweezer (Aresis Tweez305, Aresis, Ljubljana, Slovenia) is used to manipulate two silica beads of the same diameter d = 1–4 μm. The height of the liquid chamber is similar to the diameter of the silica beads (1–4 μm). The distance between the two beads is set to be 1 μm, while both beads are held close to a glass surface. Stable micron-sized confinement is formed, as illustrated in Fig. 1 D. The power of the laser is strong enough to hold a bead from collisions of surrounding bacteria and is weak enough not to affect the bacterial activity. The laser spots are carefully calibrated to focus within a circle of diameter smaller than 1 μm. As shown in Fig. S3, no speed change is observed when a bacterium swims across a focused laser beam. Confinement built this way will be referred to as elastic confinement. Using the multipoint laser tweezer enables one to hold a filamentous cell and study its rotation rate to infer the torque generated by the flagella, as shown in Fig. 2 E.
Figure 1.

Characterization of bacteria of different lengths (A–C) and experimental setups (D and E). (A) Near-interface free-swimming speeds for bacteria with different body lengths. The blue dashed line is the speed of a normal bacterium. (B) The number of flagellar bundles versus L in motile bacteria. NL is assigned as one for normal bacteria with L = 3 μm, as indicated by the bottom-left red circle. For filamentous bacteria, NL is determined by the number of motors. The solid line is a linear fit with a slope of 0.44/μm. Inset: number of flagellar motors as a function of L. (C) Distribution of motors for cells with L = 3.2 ± 0.9 (black diamonds), 18.5 ± 3.0 (97 cells, red circles), and 35.6 ± 5.3 μm (84 cells, red triangles) measured by z stack fluorescence imaging. Solid curves are truncated Gaussian fittings with widths w = 0.3 (red) and 0.8 (black). Inset: fluorescent-labeled motors on a cell of L = 36 μm. Results of normal bacteria are adapted from (17). (D) Elastic confinement formed by two glass beads, which are held by laser tweezers, and a glass substrate. Inset: cross-section view. (E) A snapshot of an experiment superimposed by the trajectory of a bacterium with L = 16 μm using elastic confinement with bead diameter d = 4 μm. The nearest distance between the two beads is 1 μm. The direction of bacterial motion is indicated by the arrow. The color map indicates the magnitude of swimming speed. (F) Model: a bacterium passes through confinement centered at x = 0 with length hL < l. To see this figure in color, go online.
Figure 2.
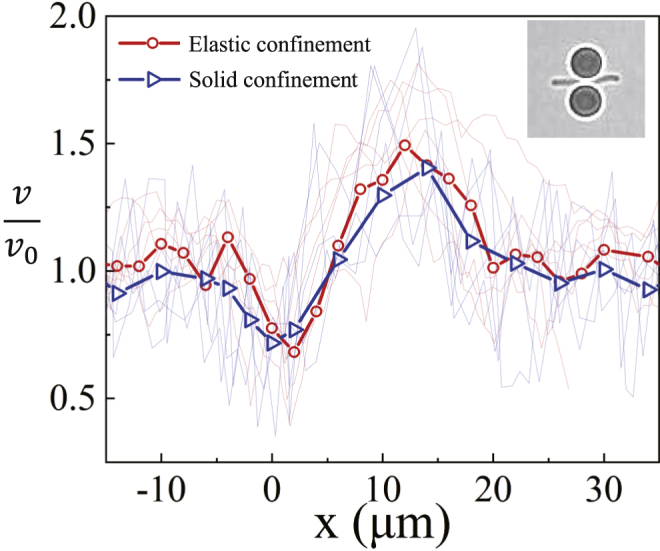
Normalized swimming speed versus position for 11 bacteria with L = 12 ± 1 μm. x = 0 is where the front end of the cell reaches the center of the confinement. Red lines are results using elastic confinement, and blue lines are results using solid confinement. Symbols are values averaged over cells. Inset: the width of the elastic confinement is increased by ∼1 μm due to a passing bacterium. To see this figure in color, go online.
In the second setup, as shown in Fig. S1, one bead is glued to a glass coverslip, and the other bead is glued to a glass rod, using a UV-curable glue (Norland NOA 81, Norland, Lincoln, NE, USA). The rod is annexed to a micromanipulator (Narishige NMO-4, Narishige, Amityville, NY, USA) to adjust the distance between the two beads. Confinement built this way will be referred to as solid confinement.
Imaging quasi-2D swimming of bacteria
An inverted microscope (Nikon Ti2, Nikon, Tokyo, Japan) equipped with a 60× water-immersed lens and a digital camera (Photometrics Prime, Tucson, AZ, USA) is used to record the quasi-two-dimensional (2D) motion of bacteria under a bright-field mode at a temporal resolution of 40 ms. By focusing on the liquid layer near one of the glass surfaces, one observes persistent 2D motion of bacteria across the field of view ∼150 × 150 μm. The positions of bacteria are tracked using ImageJ software. During experiments, the cells exhibit no deformation and are thus treated as solid bodies.
Theory on the free-swimming speed of bacteria with side flagella and different body lengths
To investigate the viscous origin of the speed variance when a bacterium is under confinement, it is critical to build a hydrodynamic model and compare the results with theory. The simplest approach is to build a resistance matrix for bacteria with different lengths and multiple flagellar bundles. First, consider a free-swimming E. coli with cell length L. Let the force and torque on the cell body be FL and TL, respectively. For the cell body (21),
| (1) |
where vL is the velocity and ΩL is the angular velocity of the cell body. The drag coefficients are listed in Table 2.
Table 2.
List of drag coefficients
| A | translational drag coefficient of a cell body |
| B | rotational drag coefficient of a cell body |
| a | translational drag coefficient of a flagellar bundle |
| b | rotational drag coefficient of a flagellar bundle |
| c | translation-rotation-coupling drag coefficient of a bundle |
Before writing down the matrix for flagella/flagellar bundles, the terminology needs to be clarified. 1) When a normal bacterium swims, all flagella form a bundle at one polar end of the cell. As the drag coefficients of a helix depend linearly on its length but logarithmically on its filament radius (22,23), the drag coefficients of a flagellar bundle are similar to those of a single flagellum. In other words, bundling does not change the propulsion (torque) at a constant rotation rate. 2) For a filamentous cell, side bundles can be formed. However, two side flagella cannot join each other to form a helical bundle that is longer than a single flagellum, otherwise the flagellum in the middle will block the rotation of the other. As a result, both normal and filamentous bacterium gains a negligible increase of the drag coefficients by forming a bundle. For simplicity, we refer to all independent propulsion parts, composed of a single flagellum or multiple flagella, as flagellar bundles sharing the same drag coefficients. Let the number of flagellar bundles be NL, and total force and torque on these bundles are fL and τL, respectively. One can write
| (2) |
where ωL is the angular velocity of the flagellar bundles and the linear velocity of the flagellar bundles is the same as that of the cell body. From the torque on flagellar bundles, one obtains the angular frequency of flagellar bundles,
| (3) |
By imposing force-free , translational speed vL can be solved by
| (4) |
For another bacterium with body length αL, a new resistance matrix can be written as
| (5) |
The last equality comes from basic low Reynolds number hydrodynamics. For the flagellar bundles, one can write
| (6) |
The last expression can be deduced from the linearity of low Reynolds number hydrodynamics. Notice that we do not assume NαL = βNL; we assume NαLaαL = βNLaL. The factor β is to be determined. Similar calculation leads to
| (7) |
To obtain β, we use the fact that experimentally observed vL ≈ vαL (see results), which leads to
| (8) |
and
| (9) |
and the subscript L in vL can be dropped. Now, we know that τL∝L, and this leads to τL = Lτ and AL = LA, where τ and A are torque and body drag per unit body length, respectively. Finally, we can write
| (10) |
Since v is independent of L, cL/bL and NLaL/L are independent of L. If NL is independent of L, one has aL, bL, cL ∝ L. However, as will be shown in the results section, it is found that NL ∝ L. This means that aL is also independent of L. As a result, in the following, the subscript L in the drag coefficients is dropped. The free-swimming speed of a bacterium is thus determined by two parts: the first part is the torque generated by a flagellar bundle, which has a biological origin and is assumed constant. The second part is the geometries of the cell body and flagellar bundle, which modify the drag coefficients in Table 2.
Theory on bacterial swimming speed under partial confinement
Now, consider a partially confined bacterium with length of confinement hL, 0 ≤ h ≤ 1. Suppose the velocity and angular velocity of the confined part of the cell body are v′ and Ω′, respectively, and the force and torque of the confined part of the cell body can still be described in terms of the resistance matrix. We write
| (11) |
where A′ and B′ are the translational and rotational drags of the cell body under confinement per unit length. The force and torque for the unconfined region of the cell body are assumed to be
| (12) |
Similarly, for the flagellar bundles, we have
| (13) |
and
| (14) |
Here, we assume that the flagellar bundles are homogeneously distributed along a cell body. From the expression for the total torque of the flagella , one finds that
| (15) |
Substitute this result into the force-free condition , and the velocity of the bacterium can be found as
| (16) |
As will be discussed below (Fig. 3 E and supporting material), according to a combination of experimental and theoretical analysis, flagellar motors apply constant torques no matter whether the flagella are confined or not (7,8,9). This means that any observed fluctuation of speed is due to changes in drag coefficients for both the cell body and flagella. We can write τtotal/L = τ and
| (17) |
That is, v/v0 for a bacterium with a portion h under confinement and uniformly distributed flagellar bundles (no end-bundle) depends on three drag ratios: c′/c, b′/b, and . These ratios are greater than one due to the no-slip boundary condition. Take for example: one has v′/v0 = 0.5 when h = 1. This means that a bacterium slows down when it is completely confined (9). At small h, the Taylor expansion of Eq. (17) gives . It implies that under partial confinement, c′/c speeds up a bacterium, while other drags slow down the bacterium.
Figure 3.

(A) vmax/v0 as a function of wobble angle for normal bacteria. The dashed line is vmax/v0 = 1.75. (B) A fluorescent-labeled normal bacterium with a large wobble angle passing through confinement. The blue circles represent the glass beads. The red solid lines indicate the body orientation and the red dashed lines the flagellar orientation. (C) Speed curves for bacteria with L = 18 μm passing through confinements with different elastic constants. (D) vmax for bacteria with L ∼ 10 μm but different v0. The dashed line is vmax = 1.5v0. (E) The rotating frequency of the cell body with and without confinement, obtained by the Fourier transform of the time series of the body position along the y direction. Inset: two beads held by laser tweezers and a filamentous bacterium held by another two laser tweezers near its two ends. (F) Speed curves for bacteria with L = 18 μm passing through confinement in NaCl water solutions of different concentrations. To see this figure in color, go online.
Results
Swimming, motors, and flagella of filamentous bacteria
Within the field of view ∼150 × 150 μm, no orbital motion is observed for bacteria near a glass surface (24), possibly due to a symmetric boundary condition and elongated cell body for filamentous cells. The near-interface speed is found to be independent of L, as shown in Fig. 1 A. To understand this constant speed, one needs to first study the flagellar bundles of a filamentous cell.
As mentioned above, the number of flagellar bundles NL is proportional to the number of flagellar motors for a filamentous cell, and the spatial distribution of flagella can be determined from the distribution of motors. We thus measure the positions of flagellar motors, considering the difficulty in locating side bundles in a swimming cell (25). As shown in Fig. 1 B, the measured NL is linear with L. One thus has NLaL/L ∝ aL. This quantitatively explains why the swimming speed, as determined by Eq. (10), is independent of L when the drag coefficients of a bundle are independent of L. Since the distribution of motors is symmetric to the middle of the cell, the position data from the two sides of a cell are folded together: x′ = 0 is the cell center, and x′/L = ±0.5 are the cell poles, where x′ is in the body frame. As shown in Fig. 1 C, the motors are more center distributed for filamentous bacteria than for normal bacteria, and the widths of the probability distributions are 0.3 and 0.8 in truncated Gaussian fittings, respectively. A filamentous bacterium can thus be modeled as a rod with multiple identical flagellar bundles, as shown in Fig. 1 F.
As shown in Fig. S2, the lengths of flagella for bacteria with different L are found to be l ∼ 6.5 ± 1.4 μm.
Speed change of a bacterium passing through short confinement
When a bacterium swims toward the glass beads, there is a possibility that it swims into the confinement. Under the concentration of bacteria and field of view in our experiment, we are able to obtain three such trajectories per hour (Videos S1, S2, S4 and S5). A typical trajectory of an E. coli bacterium of L = 16 μm passing through elastic confinement is shown in Fig. 1 E. The magnitude of speed is indicated in color: the bacterium first slows down (blue) and then accelerates (red) when escaping the confinement.
The bead diameter is d = 10 μm.
Fig. 2 shows speed curves for bacteria with L ∼ 12 ± 1 μm, normalized by the free-swimming speed v0. This normalization enables one to compare bacteria with different activities. The coordinate x is the relative position of the front end of the bacterium (along the swimming direction) to the center of the confinement. The speeds of the individual bacterium are shown by the light curves, and the averaged results are shown by the symbols. As shown by the red symbols in Fig. 2, when , a bacterium starts to enter confinement, with a mean incident angle θ = 15° (see supporting material). The speed decreases to a value significantly smaller than v0 due to the increase of drag from the confinement. The width of the confinement is then increased from 1 to ∼2 μm by the swimming bacterium, as shown in the inset of Fig. 2, until the cell body leaves the confinement. As shown in Figs. S7 and 3 C, the width and stiffness of confinement only affect vmin. When , v increases continuously and exceeds v0. The averaged maximum speed vmax is ∼50% greater than v0. For some bacteria, vmax ∼2v0. For , the speed gradually goes back to v0.
As cells are sensitive to light and heat, solid confinement built by micromanipulation makes a useful comparison (see materials and methods). The width of solid confinement is not affected by a bacterium (Video S3) and is set as ∼2 μm. This way, the speeds in both types of confinement can be compared. The same trend being observed in solid confinement, as shown by the blue symbols in Fig. 2, confirms that the laser tweezers in our experiments do not affect the bacteria.
Wobble angle, wall elasticity, mechano-sensing, and voltage
Before discussing the hydrodynamics of a confined bacterium, we first test other mechanisms in Table 1 in our system.
Wobble angle
For normal bacteria with L ∼ 3 μm, as shown in Fig. 3 A, vmax/v0 is independent of wobble angles. Under fluorescent imaging, the dynamic wobble angle is found to be unaffected by the confinement for a normal bacterium, as shown in Fig. 3 B. As mentioned above, a filamentous cell with multiple side bundles does not wobble. This implies that the observed speedup in bacteria with different L is not due to alignment between the cell body and the flagellar bundle (see more discussion in the supporting material; Video S6).
The flow field around the bacterium is indicated by the motion of the beads.
Wall elasticity
As shown in Fig. 3 C, elastic confinement with different spring constants does not affect the speed change. Furthermore, the results using solid confinement with a much higher spring constant (>6 orders of magnitude) exclude the possible elastohydrodynamic effect (13), namely an exchange between the kinetic energy of a swimming bacterium and the elastic energy stored in the beads.
Mechano-sensing
As shown in Fig. 2, the speed curves for bacteria with different activities can be normalized into a master curve. More specifically, as shown in Fig. 3 D, vmax increases linearly with v0. This implies a hydrodynamic origin of the observed speedup. To prove that the motor speed is not changed by the confinement and thus no mechano-sensing takes place (11), we study the motor speed of a cell. As shown in Fig. 3 E (detailed in the supporting material), the body rotation is the same regardless of whether the bacterium is confined. The result also validates the constant torque assumption in the materials and methods section.
Voltage
Since a bacterial flagellum is powered by a 0.2 V voltage (12), one needs to test the effect of the surface charge of the silica beads. As shown in Fig. 3 F, the same speed change is observed in different NaCl water solutions. From pure water to a 50 mM NaCl water solution, the Debye length is reduced from ∼1 μm to <1 nm (26). This shows that surface charge in our system does not speed up a bacterium.
Speed change of bacteria with different lengths
Fig. 4A compares speed curves for 12 groups of bacteria of different L. The slow-down regions are all centered near x = 0, where the front end of a bacterium reaches the center of the confinement. As L increases, the speed-up peaks become broader and lower, and the peaks shift toward the +x direction. The position where a bacterium reaches xvmax is measured for each bacterium. The resulting xvmax is plotted as a function of L. As shown in Fig. 4 B, xvmax can be divided into two regions separated by Lc = 20 μm. In the white region (L < Lc), xvmax increases linearly with L with an intercept of 1 μm, half the length of the confinement (see supporting material). This means that the maximum speed happens when the cell body has fully escaped. In the blue region (L > Lc), xvmax is proportional to (L + l)/2, where l = 6.5 μm is the length of a flagellum. This means that the maximum speed happens when the middle of a cell is confined. To test this bimodal universality, we normalize x by L+1 μm and (L + l)/2 for speed curves with L < Lc and L > Lc, respectively. As shown in Fig. 4, C and D, the results fall into two master curves, and collapses of the positions xvmin and xvmax are observed.
Figure 4.

(A) Evolution of speed curves for bacteria with different L. Each line is averaged ∼10 cells with similar L. (B) Positions of maximum speeds as a function of L. The red line is xvmax = L+1 μm, and the blue line is (L + l)/2. (C and D) The x axis in (A) is normalized by L+1 μm and ((L + l)/2) for bacteria with L < 20 μm and (L > 20 μm), respectively. Dashed lines in (C) and (D) are normalized theoretical results discussed in the main text. To see this figure in color, go online.
Discussion
Comparison between theory and experiment
To demonstrate that the bacterial speedup under confinement is indeed due to a hydrodynamic reason, we make a quantitative comparison between our simple model and experimental v-x curves through short confinement, as shown in Fig. 4. To achieve this, the position dependence is complemented to the resistance matrix, which now considers different bundle distributions and the spatial variance of drag coefficients. So far, a homogeneous distribution of flagella is assumed. In reality, the bundles of a filamentous cell have a centered distribution n(x), similar to the distribution of motors, as shown in Fig. 1 C. If all hs in front of the bundle terms in Eq. (17) are replaced by n(x)s, a new equation for v′/v0 will follow the symmetry of n(x). This alone cannot explain the measured asymmetric speed curve for L < Lc. This is because, in our experiments, the confinement on the cell body and the bundles may not be simultaneous, especially for short bacteria. To take this effect into account, we introduce a position-dependent body drag coefficient , which increases linearly with x when entering confinement and reaches its maximum value when the cell body fully occupies the confinement; Similarly, decreases linearly with x when exiting the confinement:
| (18) |
By replacing all hs in front of the bundle terms by n(x) and A by in Eq. (17), one has
| (19) |
where n(x) is determined by and G(x′) is the probability density function of motors along a cell, obtained from the probability distribution, as shown in Fig. 1 C. According to Fig. 1 B, NL = 0.44L/μm. As measured in (23), . One thus has and
| (20) |
As measured and simulated in (23,27), a′/a = 3.4, b′/b = 1.3, c′/c = 4.6, and A′/A = 9.3. One thus has
| (21) |
As shown in Fig. 5, all measured speed curves agree well with Eq. 21. The black dashed lines in Fig. 4, C and D, are the averaged theoretical speed curves for bacteria with L < 20 μm and L ≥ 20 μm respectively, showing a good agreement with the experiment. Next, we discuss the physical meaning of Eq. 20 by showing how different terms affect the speed-up peaks.
Figure 5.

Speed curves for 12 groups of bacteria. Results using elastic confinement are shown in red symbols. For some L, solid confinement is used for comparison, and the results are shown as blue symbols. All data can be described with Eq. 21 using the same set of drag ratios: A′/A = 9.3, a′/a = 3.4, b′/b = 1.3, and c′/c = 4.6, as shown by solid curves. The black dotted curve is calculated by using a uniform distribution of motors, and the black dashed curve is for an ideal swimmer without any body drag. To see this figure in color, go online.
Positions of speed-up peaks
One feature of the measured speed curves is the existence of speedup peaks, as shown in Fig. 4, C and D. According to Eq. 20, the shape of a v-x curve is determined by the functional forms of both and n(x), with the drag ratios and confined ratio h being the weights. For bacteria with L < Lc, vmax occurs near x = L, where and n ≠ 0. When L ∼ Lc = 20 μm, a second peak starts to emerge near x = L/2 due to the enhanced peak of n(x), which is centered at the middle of the cell. When L = 56 μm, vmax occurs at x = L/2 instead of x = L due to the diminishing term when h < n(x) and the centered distribution of bundles (see Note S1 and Fig. S4 for details). The speed curve of an ideal swimmer with L = 56 μm and A′ = A = 0 is indicated by the black dashed line in Fig. 5 for comparison.
Values of drag ratios
To evaluate the sensitivity of the theoretical results to the values of different drag ratios, we compute speed curves using Eq. 20 with different values of four drag ratios, and the results for two different L are shown in Fig. S5. It is found that for each drag ratio, there is range of ratios where the experimental result agrees with theory. Since the ranges are sufficiently large, corrections due to the complex geometry of confinement, whose spatial variance is limited to a small range, can be ignored. Furthermore, it means that there is a range of c′/c where it is sufficient to drive a bacterium to speed up in escaping. For normal bacteria, A′/A only affects vmin, and the speed-up peak is unchanged for A′/A from 5 to 15. For a long bacterium whose cell body and flagella are confined simultaneously, both slowdown and speedup are affected by A′/A.
Distribution of flagellar bundles
For a normal bacterium, there is only one flagellar bundle at one polar end of the cell, and the distribution of the bundle is a step function. For a filamentous cell, due to the diminishing term in Eq. 20, the speed curve is dictated by n(x). As shown in Fig. S6, the speed-up peaks strongly depend on the distribution of bundles in filamentous cells. For example, under a uniform distribution of bundles, the speed curve becomes flat. According to Fig. 1 C, the difference in the density of bundles located near the center of the cell between the two types (w = 0.3 and 0.8) of distribution is ∼5%, corresponding to a single bundle, given NL ∼ 20 when L = 56 μm, according to Fig. 1 B. This means that by examining speed curves, e.g., by comparing the black dotted line and solid line for the L = 56 μm bacterium in Fig. 5, we are able to detect a small change in the distribution of the bundles. The fact that a narrowing distribution of motors for an elongated cell is beneficial in escaping is useful for future design of artificial swimmers in confined geometries.
Length of confinement
We have discussed the role of the length of a bacterium in determining a speed curve. The theory is further tested by experimenting with two silica beads of d = 1 μm or four beads of d = 4 μm. As shown in Fig. S8, the results using different lengths of confinement can be described by the theory.
Conclusion
The observed bimodal universality in speed curves is quantitatively explained by the model based on the resistance matrix, which proves the viscous origin of bacterial speedup under confinement. A symmetry breaking in thrust-load distribution from filamentous to normal bacteria causes different forms of speed change, as summarized in Fig. 6, A and B. The biological meaning of the observed speed fluctuation is proposed as followed. As shown in Fig. 6 C, for a normal bacterium, the bacterium spent about one-third of the total passing time in speedup. When bacterium elongates, the speed-up time is increased, and the slow-down time is almost constant. The ratio between speed-up and slow-down time increases by an order of magnitude when L increases from 3 to 56 μm. The overall effective tumbling is weakened, and chemotaxis is biased toward the positive end. In a growing population of bacteria under increasing stress, it may provide advantage to a filamentous cell to pass through a complex environment. When escaping dynamics and evolutionary advantage emerge simultaneously, nongenetic variation of motility might be exploited for collective escape. The experimental and theoretical protocol can be applied to a wide range of active matter such as Janus particles, microtubules, and microrobots. The result will inspire new active matter systems and new microrobots in complex environments, such as tissue-penetrating robots. By modifying the surface chemistry of colloidal particles, the protocol can be used to study how bacterial motion is affected by different surfaces.
Figure 6.

Summary of results for normal (A) and filamentous (B) cells. (C) Time spent in slowdown and speedup and the ratios for bacteria of different body lengths. For each point, the result is averaged among at least four bacteria. To see this figure in color, go online.
Author contributions
Y.Y., C.-J.L., and S.G. designed research; Y.Y., H.-T.Y., H.T., H.C., H.-Y.C., C.-J.L., and S.G. performed research; Y.Y., H.-T.Y., H.T., C.-J.L., and S.G. analyzed data; Y.Y., H.-Y.C., C.-J.L., and S.G. wrote the paper.
Acknowledgments
We thank Prof. Xiang Cheng for the generous gift of bacteria and useful discussion. We benefit from discussion with Prof. Xinliang Xu and Jilong Wang and from communication with Linda Turner and Howard Berg. This work was supported by the start-up support of ShanghaiTech University, Shanghai Pujiang Program under grant no. 19PJ1407800, and NSF of China under grant no. 32071253 (S.G.), Ministry of Science and Technology, Republic of China under contract no. MOST-109-2628-M-008- 001-MY4 (C.-J.L.), MOST 110-2112-M-008-030 (H.-Y.C.), and National Center for Theoretical Sciences, Taiwan.
Declaration of interests
The authors declare no competing interests.
Editor: Jing Chen.
Footnotes
Supporting material can be found online at https://doi.org/10.1016/j.bpj.2022.10.023.
Supporting material
References
- 1.Bhattacharjee T., Datta S.S. Confinement and activity regulate bacterial motion in porous media. Soft Matter. 2019;15:9920–9930. doi: 10.1039/c9sm01735f. [DOI] [PubMed] [Google Scholar]
- 2.Patteson A.E., Gopinath A., et al. Arratia P.E. Running and tumbling with E. coli in polymeric solutions. Sci. Rep. 2015;5 doi: 10.1038/srep15761. [DOI] [PMC free article] [PubMed] [Google Scholar]
- 3.Moore J.P., Kamino K., Emonet T. Non-genetic diversity in chemosensing and chemotactic behavior. Int. J. Mol. Sci. 2021;22:6960. doi: 10.3390/ijms22136960. [DOI] [PMC free article] [PubMed] [Google Scholar]
- 4.Phan T.V., Morris R., et al. Austin R.H. Bacterial route finding and collective escape in mazes and fractals. Phys. Rev. X. 2020;10 [Google Scholar]
- 5.Männik J., Driessen R., et al. Dekker C. Bacterial growth and motility in sub-micron constrictionss. Proc. Natl. Acad. Sci. USA. 2009;106:14861–14866. doi: 10.1073/pnas.0907542106. [DOI] [PMC free article] [PubMed] [Google Scholar]
- 6.Cisneros L., Dombrowski C., et al. Kessler J.O. Reversal of bacterial locomotion at an obstacle. Phys. Rev. E Stat. Nonlin. Soft Matter Phys. 2006;73 doi: 10.1103/PhysRevE.73.030901. [DOI] [PubMed] [Google Scholar]
- 7.Liu B., Breuer K.S., Powers T.R. Propulsion by a helical flagellum in a capillary tube. Phys. Fluids. 2014;26 [Google Scholar]
- 8.Bianchi S., Carmona Sosa V., et al. Di Leonardo R. Brownian fluctuations and hydrodynamics of a microhelix near a solid wall. Sci. Rep. 2020;10:4609. doi: 10.1038/s41598-020-61451-y. [DOI] [PMC free article] [PubMed] [Google Scholar]
- 9.Vizsnyiczai G., Frangipane G., et al. Di Leonardo R. A transition to stable one-dimensional swimming enhances E. coli motility through narrow channels. Nat. Commun. 2020;11:2340. doi: 10.1038/s41467-020-15711-0. [DOI] [PMC free article] [PubMed] [Google Scholar]
- 10.Makarchuk S., Braz V.C., et al. Volpe G. Enhanced propagation of motile bacteria on surfaces due to forward scattering. Nat. Commun. 2019;10:4110. doi: 10.1038/s41467-019-12010-1. [DOI] [PMC free article] [PubMed] [Google Scholar]
- 11.Chawla R., Gupta R., et al. Lele P.P. A skeptic’s guide to bacterial mechanosensing. J. Mol. Biol. 2020;432:523–533. doi: 10.1016/j.jmb.2019.09.004. [DOI] [PMC free article] [PubMed] [Google Scholar]
- 12.Fung D.C., Berg H.C. Powering the flagellar motor of Escherichia coli with an external voltage source. Nature. 1995;375:809–812. doi: 10.1038/375809a0. [DOI] [PubMed] [Google Scholar]
- 13.Tchoufag J., Ghosh P., et al. Mandadapu K.K. Mechanisms for bacterial gliding motility on soft substrates. Proc. Natl. Acad. Sci. USA. 2019;116:25087–25096. doi: 10.1073/pnas.1914678116. [DOI] [PMC free article] [PubMed] [Google Scholar]
- 14.Nishiguchi D., Nagai K.H., et al. Sano M. Long-range nematic order and anomalous fluctuations in suspensions of swimming filamentous bacteria. Phys. Rev. E. 2017;95:020601. doi: 10.1103/PhysRevE.95.020601. [DOI] [PubMed] [Google Scholar]
- 15.Li H., Shi X.-Q., et al. Zhang H.P. Data-driven quantitative modeling of bacterial active nematics. Proc. Natl. Acad. Sci. USA. 2019;116:777–785. doi: 10.1073/pnas.1812570116. [DOI] [PMC free article] [PubMed] [Google Scholar]
- 16.Phan T.V., Morris R.J., et al. Austin R.H. Emergence of Escherichia coli critically buckled motile helices under stress. Proc. Natl. Acad. Sci. USA. 2018;115:12979–12984. doi: 10.1073/pnas.1809374115. [DOI] [PMC free article] [PubMed] [Google Scholar]
- 17.Sun Y.-J., Bai F., et al. Lo C.-J. Probing bacterial cell wall growth by tracing wall- anchored protein complexes. Nat. Commun. 2021;12:2160. doi: 10.1038/s41467-021-22483-8. [DOI] [PMC free article] [PubMed] [Google Scholar]
- 18.Leach J., Mushfique H., et al. Cooper J. An optically driven pump for microfluidics. Lab Chip. 2006;6:735–739. doi: 10.1039/b601886f. [DOI] [PubMed] [Google Scholar]
- 19.Zhang T.Y., Suen C.Y. A fast parallel algorithm for thinning digital patterns. Commun. ACM. 1984;27:236–239. [Google Scholar]
- 20.Turner L., Ryu W.S., Berg H.C. Real-time imaging of fluorescent flagellar filaments. J. Bacteriol. 2000;182:2793–2801. doi: 10.1128/jb.182.10.2793-2801.2000. [DOI] [PMC free article] [PubMed] [Google Scholar]
- 21.Purcell E.M. The efficiency of propulsion by a rotating flagellum. Proc. Natl. Acad. Sci. USA. 1997;94:11307–11311. doi: 10.1073/pnas.94.21.11307. [DOI] [PMC free article] [PubMed] [Google Scholar]
- 22.Darnton N.C., Turner L., et al. Berg H.C. On torque and tumbling in swimming Escherichia coli. J. Bacteriol. 2007;189:1756–1764. doi: 10.1128/JB.01501-06. [DOI] [PMC free article] [PubMed] [Google Scholar]
- 23.Chattopadhyay S., Moldovan R., et al. Wu X.L. Swimming efficiency of bacterium escherichia coli. Proc. Natl. Acad. Sci. USA. 2006;103:13712–13717. doi: 10.1073/pnas.0602043103. [DOI] [PMC free article] [PubMed] [Google Scholar]
- 24.Lauga E., DiLuzio W.R., et al. Stone H.A. Swimming in circles: motion of bacteria near solid boundaries. Biophys. J. 2006;90:400–412. doi: 10.1529/biophysj.105.069401. [DOI] [PMC free article] [PubMed] [Google Scholar]
- 25.Turner L., Ping L., et al. Berg H.C. Visualizing flagella while tracking bacteria. Biophys. J. 2016;111:630–639. doi: 10.1016/j.bpj.2016.05.053. [DOI] [PMC free article] [PubMed] [Google Scholar]
- 26.Israelachvili J.N. Third edition. Academic Press; 2011. Intermolecular and Surface Forces; p. 313. [Google Scholar]
- 27.Zhang J., Liu K., Ding Y. Speedup of self-propelled helical swimmers in a long cylindrical pipe. Chin. Phys. B. 2022;31 [Google Scholar]
Associated Data
This section collects any data citations, data availability statements, or supplementary materials included in this article.
Supplementary Materials
The bead diameter is d = 10 μm.
The flow field around the bacterium is indicated by the motion of the beads.