

Abstract
Ultra-performance liquid chromatography-tandem mass spectrometry (UPLC-MS) and gas chromatography-mass spectrometry (GC-MS) were applied to analyze metabolites in perilla leaves (PLs) during its developmental process. In total, 118 metabolites were identified, including volatile and non-volatile compounds, such as terpenoids, sugars, amino acids, organic acids, fatty acids, phenolic acids, flavonoids, and others. Principal component analysis (PCA) indicated great variations of metabolites during PLs development. Clustering analysis (CA) clarified the dynamic patterns of the metabolites. The heatmap of CA showed that most of the detected metabolites were significantly accumulated at stage 4 which is the pre anthesis period, and declined afterwards. The results of the present study provide a comprehensive overview of the metabolic dynamics of developing PLs which suggested that pre anthesis period is the best harvest time for PLs.
Keywords: Perilla leaf, mass spectrometry, metabolomic dynamics, harvest time, multivariate statistical analysis
1. Introduction
Perilla frutescens (L.) Britt. is an annual herbal plant that belongs to the family of Lamiaceae. It is widely cultivated in Asia counties, such as China, Japan, Korea, Vietnam and other regions (Yu et al., 2017; Zhang et al., 2021). Perilla leaves (PLs) are commonly consumed as kitchen herb in salads, sushi, soups, and as spice, garnish, or food colorant. PLs are also used as traditional Chinese medicine to relieve exterior, dispersing cold, ease stomach pain, reduce phlegm and relieve cough and asthma (Ha et al., 2012; Igarashi and Miyazaki, 2013). Phytochemical studies indicated PLs were rich in essential oils, flavonoids, fatty acids, phenolic compounds, etc (Ahmed, 2018). Compounds of PLs showed various biological activities such as antioxidant, antimicrobial, anti-allergic, antidepressant, anti-inflammatory, and anticancer effects (Banno et al., 2004; Ghimire et al., 2019; Wang et al., 2021; Yang et al., 2021). PLs has been used as a natural herbal medicine for treatment of depression-related disease, asthma, tumors, coughs, allergies, intoxication, fever, chills, headache, stuffy nose, and some intestinal disorders (Ito et al., 2011; Kim et al., 2012; Zhou et al., 2021). Owing to these health benefits, the food and pharmaceutical industries are increasingly interested in PLs.
The pharmacological activities of perilla are closely related to its chemical constituents. Some studies have revealed that great dynamic variation in the nutritional components and phytochemical substances might occur during plant development. Ghimire et al. (Ghimire et al., 2017) compared the total volatile contents of eighteen accessions of PLs and most of them were higher before the flowering time than at the flowering stage. Luo et al. (Luo et al., 2021) invested variation of two phenolic acids and six flavonoids during PLs development and suggested to harvest PLs at different times basing on the targeted metabolites. Peiretti et al. (Peiretti, 2011) evaluated perilla quality according to the content of fatty acid, fiber, crude protein, organic matter and gross energy during the growth cycle of perilla. According to their result, it is better to harvest perilla at around two months after sowing. Though these studies provided a general feature of perilla nutritional contents, a more comprehensive and detailed dynamic profile of developing PLs is still essential for providing more information to determine the harvest time according to different application.
In this study, mass spectrometry (MS) based high throughput metabolomic platforms were applied to ascertain the dynamic trajectory of complex ingredients of PLs during developmental process. In addition, multiple statistical analysis methods, including principal component analysis (PCA) and Clustering analysis (CA) were used to clarify the dynamic patterns of the detected metabolites. These data provide data support for determining the best harvest time of perilla leaves.
2. Materials and methods
2.1. Chemicals and reagents
HPLC grade methanol (MeOH), acetonitrile (ACN) and formic acid were purchased from Fisher Scientific (Pittsburgh, PA, United States) Ultrapure water was prepared by Synergy water purification system (Millipore, Billerica, United States). The reserpine standards (HPLC grade) and GC grade derivatizing regent MSTFA (N-methyl-N-(trimethylsilyl)trifluoroacetamide), methoxyamine hydrochloride were purchased from Sigma-Aldrich (St. Louis, MO, USA). Chemical reagent n-hexane (GC grade) and Anhydrous pyridine (GC grade) were obtained from Shanghai Aladdin Biochemical Technology Co., Ltd. (Shanghai, China). Salicylic acid, luteolin, apigenin and rosmarinic acid standards were provided by Shanghai Yuanye Bio-Technology Co., Ltd. (Shanghai, China). Reference standards of luteolin-7-O-glucoside, scutellarin, luteolin-7-O-glucuronide, apigenin-7-glucoside and apigenin-7-O-glucuronide were purchased from Shanghai Standard Technology Co., Ltd. (Shanghai, China). The purities of all standards were determined to be higher than 98%. Other chemicals and reagents were analytical grade.
2.2. Plant materials
The PLs were randomly collected from Perilla frutescens (L.) Britt. cultivated in the plant base of Hebei Academy of Agriculture and Forestry Sciences in Shijiazhuang (China 38°06′41.7′′ N, 114°45′35.8′′E) in mid May 2019, and the samples were collected semimonthly from July 2019 to October 2019. The mean annual temperature was 14.4°C, mean annual humidity was 62%, mean annual precipitation was 422.6 mm, mean annual sunshine hours was 2235.4 hours. Growth process of perilla was performed using manual fertilization, therefore, soil is rich in organic elements. Three biological replicates were collected for each developmental phase ( Table 1 ). The plant was identified by professor Yuguang Zheng (Hebei Chemical and Pharmaceutical College, China), and voucher specimens were deposited in Traditional Chinese Medicine Processing Technology Innovation Center of Hebei Province, Hebei University of Chinese Medicine. The harvested leaves were air-dried in the dark at room temperature for 2 weeks to acquire consistently low water content.
Table 1.
Information of samples collected at different developmental times.
| No. | Collection date | Growth phase (Wei et al., 2017) | Sample number | Specimen No. |
|---|---|---|---|---|
| 1 | July 15, 2019 | nutritional phase | stage 1-1 | PF2019071501 |
| 2 | July 15, 2019 | nutritional phase | stage 1-2 | PF2019071502 |
| 3 | July 15, 2019 | nutritional phase | stage 1-3 | PF2019071503 |
| 4 | July 30, 2019 | nutritional phase | stage 2-1 | PF2019073001 |
| 5 | July 30, 2019 | nutritional phase | stage 2-2 | PF2019073002 |
| 6 | July 30, 2019 | nutritional phase | stage 2-3 | PF2019073003 |
| 7 | August 15, 2019 | nutritional phase | stage 3-1 | PF2019081501 |
| 8 | August 15, 2019 | nutritional phase | stage 3-2 | PF2019081502 |
| 9 | August 15, 2019 | nutritional phase | stage 3-3 | PF2019081503 |
| 10 | August 30, 2019 | nutritional phase | stage 4-1 | PF2019083001 |
| 11 | August 30, 2019 | nutritional phase | stage 4-2 | PF2019083002 |
| 12 | August 30, 2019 | nutritional phase | stage 4-3 | PF2019083003 |
| 13 | September 15, 2019 | flowering phase | stage 5-1 | PF2019091501 |
| 14 | September 15, 2019 | flowering phase | stage 5-2 | PF2019091502 |
| 15 | September 15, 2019 | flowering phase | stage 5-3 | PF2019091503 |
| 16 | September 30, 2019 | flowering phase | stage 6-1 | PF2019093001 |
| 17 | September 30, 2019 | flowering phase | stage 6-2 | PF2019093002 |
| 18 | September 30, 2019 | flowering phase | stage 6-3 | PF2019093003 |
| 19 | October 15, 2019 | fruiting phase | stage 7-1 | PF2019101501 |
| 20 | October 15, 2019 | fruiting phase | stage 7-2 | PF2019101502 |
| 21 | October 15, 2019 | fruiting phase | stage 7-3 | PF2019101503 |
2.3. Analysis of the volatile metabolites by GC-MS
2.3.1. Sample pretreatment
The dried PF samples were pulverized with grinder (FW100, Taisite, Tianjin, China), and screened through 60 mesh sieves. 100 mg of each accurately weighted pulverized sample were thoroughly mixed with 1 mL of n-hexane then sonicated (300 W, 40 kHz) 15 min at room temperature. The extracted solution was centrifuged at 13000 rpm at room temperature for 10 min. The supernatant was injected into the GC-MS for analysis.
2.3.2. Instrument parameters
The GC-MS analysis was performed with an Agilent 7890B-5977B GC-MS (Agilent, Santa Clara, CA, USA) coupled with a HP-5MS capillary column (30 m × 0.25 mm, 0.25 μm film thickness, Agilent, Santa Clara, CA, USA). Helium (≥ 99.999%) was used as carrier gas at a constant flow rate of 1.0 mL·min-1. 1 μL of the prepared supernatant solution was injected in split-mode with the split ratio set to 2:1 at a temperature of 250°C. The oven temperature program was initially set at 45°C, then increased to 100°C at a rate of 10°C·min-1, and subsequently increased to 280°C at a rate of 4°C·min-1, finally held for 10 min. The electronic ionization voltage of electron-impact (EI) ion source was 70 eV. The mass spectrometer was operated in full scan mode with a scanning range of 50-550 m/z. n-Alkane standard solution (C8-C20, 40 mg·L-1, Sigma-Aldrich, Switzerland) was analyzed under the same condition for retention index (RI) calculation.
2.4. Analysis of non-volatile metabolites by GC-MS
2.4.1. Sample pretreatment
An integrative extraction of primary metabolites and secondary metabolites was performed according to a universal extraction protocol (Weckwerth et al., 2010; Mari et al., 2013; Wang et al., 2017) with some modifications. 100 mg of each pulverized samples were extracted with 1 mL of extraction solution (methanol: water: formic acid = 70:28:2) by sonication 15 min. The crude extract was centrifuged at 13,000 rpm at room temperature for 10 min. 50 μL of the supernatant together with 20 μL of salicylic acid (1 mg·mL-1, internal standard) was dried using a SpeedVac (Thermo Scientific, Inc., Bremen, Germany) at 5000 rpm and 40°C for 90 min. Methoxyamination of the carbonyl groups was performed by adding 20 μL of methoxyamine hydrochloride (40 mg·mL-1) in pyridine to each sample followed by incubation in metal bath at 30°C for 90 min. Subsequently, 80 μL of MSTFA (N-Methyl-N-(trimethylsilyl) trifluoroacetamide) was added and the mixtures were incubated at 37°C for 30 min. The derivatized samples were centrifuged at 13,000 rpm at room temperature for 10 min with the supernatants prepared for GC-MS analysis.
2.4.2. Instrument parameters
Aforementioned GC-MS instrument and column (see 2.3.2) was also applied for analysis of derivatized samples. 1 μL of the derivatized sample was injected using 5:1 split-mode at a temperature of 250°C. The temperature gradient program was as follows: Initial temperature was 80°C, increased to 200°C at a rate of 10°C·min-1; then increased to 250°C at a rate of 6°C·min-1; subsequently increased to 310°C at a rate of 6°C·min-1 and hold at 310°C for 5 min. EI ion source was adjusted to 230°C with electronic energy of 70 eV. The mass spectrometer was determined by the full-scan method ranging from 50 to 550 (m/z). n-Alkane standard solution (C8-C20, 40 mg·L-1, Sigma-Aldrich, Switzerland) was analyzed under the same condition for retention index (RI) calculation.
2.5. Analysis of the non-volatile metabolites by LC-MS
2.5.1. Sample pretreatment
100 μL of the above mentioned crude extract (see in 2.4.1) was mixed with 100 μL of 5 μg·mL-1 reserpine (internal standard) and diluted with 800 μL of extract solution then centrifuged at 13,000 rpm at room temperature for 10 min with the supernatants prepared for the LC-MS analysis.
2.5.2. Instrument parameters
The UHPLC-Q/TOF-MS analysis was performed on an Agilent 1290 UHPLC system coupled with an Agilent 6545 quadrupole time-of-flight mass spectrometer system (Agilent, Santa Clara, CA, United States). Chromatographic separation was performed on an Agilent ZORBAX SB C18 column (4.6 × 50 mm, 1.8 μm).
UHPLC chromatographic conditions: the 0.5 μL of prepared samples were loaded on an Agilent 1290 UHPLC system and eluted with 0.1% formic-water (mobile phase A) and acetonitrile (mobile phase B) in the following gradient: 0-2 min, 12% B; 2-26 min, 12%-24% B; 26-35 min, 24%-50% B; 35-38 min, 50%-100% B; 38-45 min, 100% B. The flow rate was maintained at 0.4 mL·min-1, the column temperature was set at 25°C.
The MS acquisition parameters were referred to Chang et al. (2021) with minor modifications. The capillary voltage was set to 4000 V; and the collision energy was 20 eV and 35 eV. The analysis was operated in positive mode with the mass range of m/z 50-1000 Da.
2.6. Data processing and multivariate statistical analysis
For qualitative analysis, the metabolites detected by GC-MS with a similarity more than 80% to the NIST17 standard library were identified using the Agilent MassHunter analysis program (Agilent, Santa Clara, CA, USA). The RI of all the identified compounds were calculated by comparing their corresponding peak retention time to that of n-alkanes (C8–C20) (Chaturvedula and Prakash, 2013; Ma et al., 2014). The identification of detected metabolites in the LC-MS analysis was based on their accurate precursor masses and fragment masses. For quantitative analysis, the integrated peak area was considered to be a variable for analysis and normalized to internal standard. The combined GC-MS and LC-MS dataset was transformed to -1~1 by Min-Max Normalization method. SIMCA P13 software (Umetrics, Umea, Sweden) was used for principal component analysis (PCA). Cluster analysis (CA) and heatmap was performed with Origin Pro 2020 (OriginLab Corporation, USA) software. Duncan’s test was performed with IBM SPSS Statistics 23.0 (IBM, USA) software.
3. Results and discussion
3.1. Identification of detected metabolites
The typical total ion chromatograms (TICs) of GC-MS, pre-column derivatized GC-MS and LC-MS showed metabolomic profiles of PLs ( Figures 1A-C ). With reference to the NIST17 database, 47 volatile metabolites including aldehydes, ketones, alcohols, fatty acids, steroids and others ( Table 2 ) were identified according to their retention times and mass spectrums. 51 peaks in Figure 1B were identified including sugars, amino acids, organic acids, fatty acids, and phenolic compounds ( Table 3 ). The identification of non-volatile metabolites form LC-MS data were based on their precursor ions and fragmentation patterns. 28 metabolites, mainly flavonoids and anthocyanidins, were identified with their detail information such as retention time, chemical formula, ppm errors and fragment ions were listed in Table 4 . Among the putatively identified compounds, eight metabolites (luteoloside (peak C11), scutellarin (peak C16), luteolin-7-O-glucuronide (peak C17), apigenin-7-O-glucoside (peak C18) apigenin-7-O-glucuronide (peak C23), rosmarinic acid (peak C24), luteolin (peak C26), apigenin (peak C27)) were confirmed with reference substances ( Figure 1D ). The chemical fingerprints showed distinct differences in the chemical composition of PLs at different harvesting ( Figure 2 ).
Figure 1.
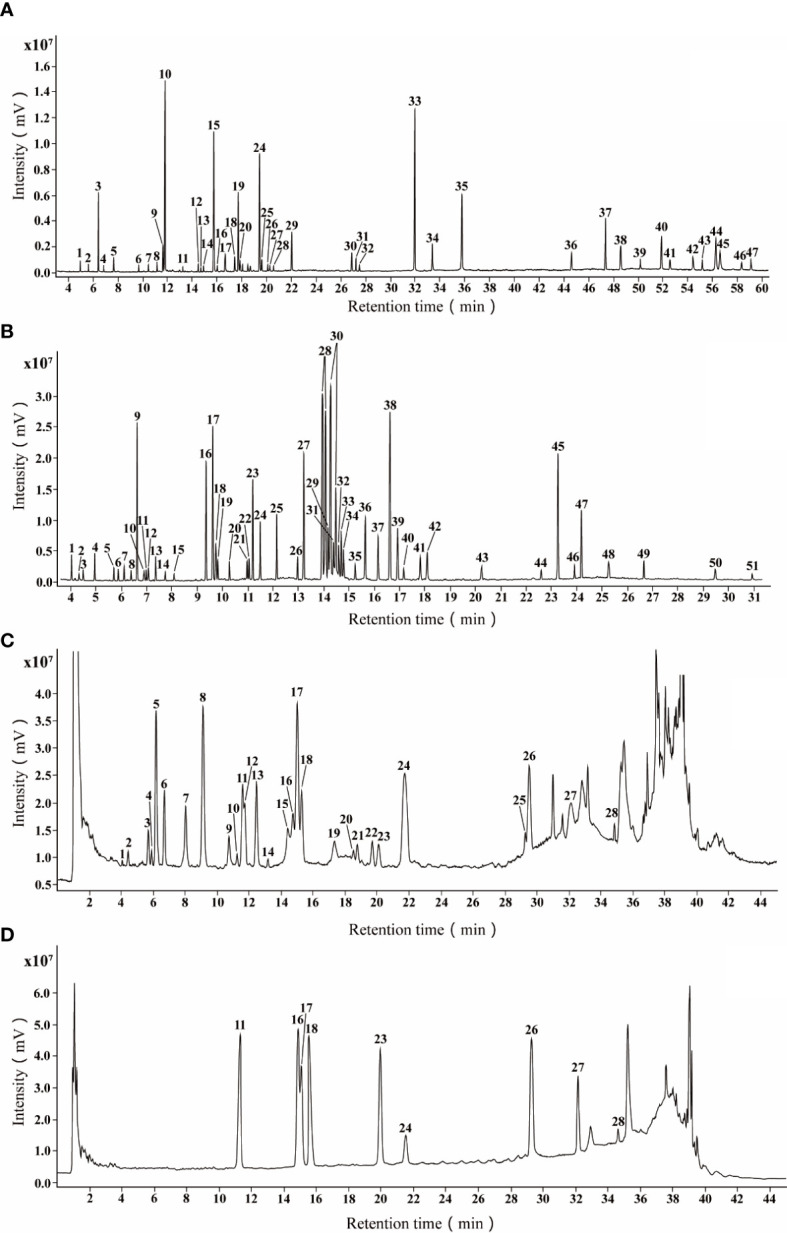
The typical total ion chromatograms of PLs by GC-MS and LC-MS. (A) TIC of volatile metabolites in pooled samples by GC-MS; (B) TIC of non-volatile metabolites in pooled samples by GC-MS after derivatization; (C) TIC of non-volatile metabolites in pooled samples by LC-MS; (D) TIC of reference substances by LC-MS.
Table 2.
Identification of volatile compounds analyzed by GC-MS.
| No. | RT (min) | Compounds | MF | MW | Class | RI |
|---|---|---|---|---|---|---|
| A1 | 5.01 | α-Pinene | C10H16 | 136 | Bicyclic monoterpenoids | 918 |
| A2 | 5.65 | Pseudolimonene | C10H16 | 136 | Mononcyclic monoterpenoids | 964 |
| A3 | 6.44 | D-Limonene | C10H16 | 136 | Mononcyclic monoterpenoids | 1017 |
| A4 | 7.51 | α-Terpinene | C10H16 | 136 | Mononcyclic monoterpenoids | 1082 |
| A5 | 7.69 | Linalool | C10H18O | 154 | Acyclic monoterpenoids | 1093 |
| A6 | 9.71 | α-Terpineol | C10H18O | 154 | Mononcyclic monoterpenoids | 1193 |
| A7 | 10.53 | Nerol | C10H18O | 154 | Acyclic monoterpenoids | 1228 |
| A8 | 11.21 | Perilla ketone | C10H14O2 | 166 | Acyclic monoterpenoids | 1257 |
| A9 | 11.71 | Shisool | C10H18O | 154 | Mononcyclic monoterpenoids | 1277 |
| A10 | 11.86 | Perillaldehyde | C10H14O | 150 | Mononcyclic monoterpenoids | 1283 |
| A11 | 13.43 | γ-Elemene | C15H24 | 204 | Mononcyclic sesquiterpenoids | 1344 |
| A12 | 14.51 | α-Copaene | C15H24 | 204 | Tricyclic sesquiterpenoids | 1385 |
| A13 | 14.76 | β-Bourbonene | C15H24 | 204 | Tricyclic sesquiterpenoids | 1394 |
| A14 | 14.93 | β-Elemene | C15H24 | 204 | Mononcyclic sesquiterpenoids | 1401 |
| A15 | 15.77 | β-Caryophyllene | C15H24 | 204 | Bicyclic sesquiterpenoids | 1431 |
| A16 | 16.16 | Perillic acid | C10H14O2 | 166 | Mononcyclic monoterpenoids | 1446 |
| A17 | 16.68 | α-Humulene | C15H24 | 204 | Mononcyclic sesquiterpenoids | 1465 |
| A18 | 17.44 | β-Copaene | C15H24 | 204 | Tricyclic sesquiterpenoids | 1492 |
| A19 | 17.73 | Cis-α-Bergamotene | C15H24 | 204 | Bicyclic sesquiterpenoids | 1503 |
| A20 | 17.87 | Bicyclogermacrene | C15H24 | 204 | Bicyclic sesquiterpenoids | 1508 |
| A21 | 18.09 | α-Farnesene | C15H24 | 204 | Acyclic sesquiterpenoids | 1516 |
| A22 | 18.51 | Myristicin | C11H12O3 | 192 | Aromatic compounds | 1531 |
| A23 | 18.59 | δ-Cadinene | C15H24 | 204 | Bicyclic sesquiterpenoids | 1534 |
| A24 | 19.43 | Elemicin | C12H16O3 | 208 | Aromatic compounds | 1565 |
| A25 | 19.63 | Nerolidol | C15H26O | 222 | Acyclic sesquiterpenoids | 1572 |
| A26 | 20.11 | Espatulenol | C15H24O | 220 | Tricyclic sesquiterpenoids | 1590 |
| A27 | 20.27 | β-Caryophyllene oxide | C15H24O | 220 | Bicyclic sesquiterpenoids | 1595 |
| A28 | 20.59 | α-Patchoulene | C15H24 | 204 | Tricyclic sesquiterpenoids | 1607 |
| A29 | 22.16 | Isoelemicin | C12H16O3 | 208 | Aromatic compounds | 1666 |
| A30 | 26.89 | Phytyl acetate | C22H42O2 | 338 | Acyclic diterpenoids | 1849 |
| A31 | 27.23 | Pentadecanone | C18H36O | 268 | Acyclic sesquiterpenoids | 1862 |
| A32 | 27.52 | Myristic acid | C14H28O2 | 228 | Aliphatic compounds | 1874 |
| A33 | 31.96 | Palmitic acid | C16H32O2 | 256 | Aliphatic compounds | 2059 |
| A34 | 33.38 | Phytol | C20H40O | 296 | Acyclic diterpenoids | 2118 |
| A35 | 35.75 | α-Linolenic acid | C18H30O2 | 278 | Aliphatic compounds | 2217 |
| A36 | 45.07 | Heptacosane | C27H56 | 380 | Aliphatic compounds | 2607 |
| A37 | 47.41 | Squalene | C30H50 | 410 | Acyclic triterpenoids | 2705 |
| A38 | 48.55 | Nonacosane | C29H60 | 408 | Aliphatic compounds | 2753 |
| A39 | 49.16 | 1-Heptatriacotanol | C37H76O | 536 | Aliphatic compounds | 2779 |
| A40 | 51.90 | Hentriacontane | C31H64 | 436 | Aliphatic compounds | 2893 |
| A41 | 52.60 | α-Tocopherol | C29H50O2 | 430 | Mononcyclic triterpenoids | 2923 |
| A42 | 54.44 | Campesterol | C28H48O | 400 | Steroids | 2999 |
| A43 | 55.19 | β-Stigmasterol | C29H48O | 412 | Steroids | 3031 |
| A44 | 56.32 | Dotriacontane | C32H66 | 450 | Aliphatic compounds | 3078 |
| A45 | 56.67 | γ-Sitosterol | C29H50O | 414 | Steroids | 3093 |
| A46 | 58.29 | β-Amyrone | C30H48O | 424 | Tetracyclic triterpenoids | 3161 |
| A47 | 58.69 | α-Amyrin | C30H50O | 426 | Tetracyclic triterpenoids | 3178 |
RT, retention time.
MF, molecular formula.
MW, molecular weight.
RI, retention index.
Table 3.
Identification of non-volatile metabolites analyzed by pre-column derivatization combining with GC-MS.
| No. | RT | Compounds | MF | MW | RI |
|---|---|---|---|---|---|
| B1 | 4.03 | Lactic acid (2TMS) | C9H22O3Si2 | 234 | 1063 |
| B2 | 4.49 | L-Alanine (2TMS) | C9H23NO2Si2 | 233 | 1102 |
| B3 | 4.67 | Glycine (TMS) | C8H21NO2Si2 | 219 | 1118 |
| B4 | 4.94 | Oxalic acid (2TMS) | C8H18O4Si2 | 234 | 1141 |
| B5 | 5.71 | Propanedioic acid (2TMS) | C9H20O4Si2 | 248 | 1206 |
| B6 | 5.88 | L-Valine (2TMS) | C11H27NO2Si2 | 261 | 1220 |
| B7 | 6.38 | L-Serine (2TMS) | C9H23NO3Si2 | 249 | 1260 |
| B8 | 6.57 | L-Leucine (2TMS) | C12H29NO2Si2 | 275 | 1275 |
| B9 | 6.62 | Glycerol (3TMS) | C12H32O3Si3 | 308 | 1280 |
| B10 | 6.86 | L-Isoleucine (TMS) | C12H29NO2Si2 | 275 | 1299 |
| B11 | 6.91 | L-Proline (2TMS) | C11H25NO2Si2 | 259 | 1303 |
| B12 | 7.03 | Glycine (3TMS) | C11H29NO2Si3 | 291 | 1312 |
| B13 | 7.36 | Glyceric acid (3TMS) | C12H30O4Si3 | 322 | 1339 |
| B14 | 7.73 | L-Serine (3TMS) | C12H31NO3Si3 | 321 | 1368 |
| B15 | 8.08 | L-Threonine (3TMS) | C13H33NO3Si3 | 335 | 1396 |
| B16 | 9.35 | Malic acid (3TMS) | C13H30O5Si3 | 350 | 1499 |
| B17 | 9.61 | Salicylic acid (2TMS) | C13H22O3Si2 | 282 | 1522 |
| B18 | 9.73 | L-Aspartic acid (3TMS) | C13H31NO4Si3 | 349 | 1532 |
| B19 | 9.81 | γ-Aminobutanoic acid (3TMS) | C13H33NO2Si3 | 319 | 1539 |
| B20 | 10.27 | L-Glutamic acid (3TMS) | C14H33NO4Si3 | 363 | 1578 |
| B21 | 10.97 | L-Phenylalanine (2TMS) | C15H27NO2Si2 | 309 | 1639 |
| B22 | 11.05 | L-Asparagine (4TMS) | C16H40N2O3Si4 | 420 | 1646 |
| B23 | 11.19 | Tartaric acid (4TMS) | C16H38O6Si4 | 438 | 1659 |
| B24 | 11.48 | L-Asparagine (3TMS) | C13H32N2O3Si3 | 348 | 1685 |
| B25 | 12.14 | Xylitol (5TMS) | C20H52O5Si5 | 512 | 1745 |
| B26 | 12.84 | L-Glutamine (3TMS) | C14H34N2O3Si3 | 362 | 1810 |
| B27 | 13.21 | Citric acid (4TMS) | C18H40O7Si4 | 480 | 1843 |
| B28 | 13.95 | D-Fructose (5TMS) | C21H52O6Si5 | 540 | 1909 |
| B29 | 14.18 | D-Galactose (5TMS) | C21H52O6Si5 | 540 | 1930 |
| B30 | 14.26 | D-Glucose (5TMS) | C22H55NO6Si5 | 569 | 1936 |
| B31 | 14.32 | L-Lysine (4TMS) | C18H46N2O2Si4 | 434 | 1942 |
| B32 | 14.54 | L-Tyrosine (3TMS) | C18H35NO3Si3 | 397 | 1961 |
| B33 | 14.64 | D-Glucitol (6TMS) | C24H62O6Si6 | 614 | 1970 |
| B34 | 14.72 | D-Sorbitol (6TMS) | C24H62O6Si6 | 614 | 1977 |
| B35 | 15.24 | D-Tagatose (6TMS) | C24H61NO6Si6 | 627 | 2022 |
| B36 | 15.53 | D-Gluconic acid (6TMS) | C24H60O7Si6 | 628 | 2047 |
| B37 | 16.12 | Palmitic acid (TMS) | C19H40O2Si | 328 | 2098 |
| B38 | 16.62 | Myo-Inositol (6TMS) | C24H60O6Si6 | 612 | 2142 |
| B39 | 16.91 | Caffeic acid (3TMS) | C18H32O4Si3 | 396 | 2167 |
| B40 | 17.16 | Oleic acid (TMS) | C21H40O2Si | 352 | 2189 |
| B41 | 17.81 | α-Linolenic acid (TMS) | C21H38O2Si | 350 | 2245 |
| B42 | 18.09 | Stearic acid (TMS) | C21H44O2Si | 356 | 2270 |
| B43 | 20.23 | D-Galacturonic acid (5TMS) | C21H50O7Si5 | 554 | 2456 |
| B44 | 22.57 | Lactulose (8TMS) | C36H86O11Si8 | 918 | 2660 |
| B45 | 23.25 | Sucrose (8TMS) | C36H86O11Si8 | 918 | 2719 |
| B46 | 23.93 | D-Lactose (8TMS) | C36H86O11Si8 | 918 | 2778 |
| B47 | 24.19 | Maltose (8TMS) | C36H86O11Si8 | 918 | 2801 |
| B48 | 25.25 | D-Cellobiose (8TMS) | C36H86O11Si8 | 918 | 2893 |
| B49 | 26.65 | Galactinol (9TMS) | C38H92O11Si9 | 976 | 3015 |
| B50 | 29.49 | Rosmarinic acid (5TMS) | C33H56O8Si5 | 720 | 3262 |
| B51 | 30.95 | D-Mannose (8TMS) | C36H86O11Si8 | 918 | 3389 |
RT, retention time.
MF, molecular formula.
MW, molecular weight.
RI, retention index.
Table 4.
Identification of non-volatile metabolites analyzed by UPLC-ESI-Q-TOF-MS/MS.
| No. | RT (min) | Adduct ions (m/z) | Molecular ions(m/z) | Fragment ions in MS/MS (m/z) | Molecular formula | Molecular weight | Error (ppm) | Identification | References |
|---|---|---|---|---|---|---|---|---|---|
| C1 | 4.06 | [M+NH4]+ | 256.0813 | 237.9925, 196.9654, 181.0494 | C11H10O6 | 238.0415 | -0.99 | Acetyloxycaffeic acid | (Ma et al., 2014) |
| C2 | 4.44 | [M+NH4]+ | 344.1340 | 165.0546, 147.0442, 119.0490 | C15H18O8 | 326.1002 | 0.14 | Coumaric acid-4-O-glucoside | (Chaturvedula and Prakash, 2013; Ma et al., 2014) |
| C3 | 5.69 | [M+H]+ | 209.1535 | 191.1425, 167.1432, 109.0650 | C11H12O4 | 208.1460 | -0.89 | Caffeic acid ethyl ester | (Chaturvedula and Prakash, 2013; Ma et al., 2014) |
| C4 | 5.98 | [M+NH4]+ | 406.2073 | 227.1279, 209.1172, 191.1064, 167.1068, 149.0959, 131.0852 | C18H28O9 | 388.1733 | 0.08 | Tuberonic acid glucoside | (Quirantes-Piné et al., 2010) |
| C5 | 6.26 | [M+H]+ | 227.1279 | 191.1071, 163.1112, 149.0964, 131.0855, 107.0857 | C12H18O4 | 226.1205 | 0.63 | Tuberonic acid | (Quirantes-Piné et al., 2010) |
| C6 | 6.41 | [M+H]+ | 595.1661 | 577.1559, 457.1138, 379.0818, 325.0710, 295.0601 | C27H30O15 | 594.1589 | 0.68 | Apigenin-7-O-dilgucoside | (Yamazaki et al., 2003; Zheng et al., 2020) |
| C7 | 8.03 | [M+H]+ | 639.1201 | 463.0880, 287.0554 | C27H26O18 | 638.1129 | 1.52 | Scutellarin-7-O-diglucuronide | (Yamazaki et al., 2003; Kaufmann et al., 2016) |
| C8 | 9.11 | [M+H]+ | 639.1198 | 463.0876, 287.0553 | C27H26O18 | 638.1126 | 1.14 | Luteolin-7-O-diglucuronide | (Meng et al., 2008; He et al., 2015) |
| C9 | 10.73 | [M+H]+ | 479.0822 | 303.0501 | C21H18O13 | 478.0749 | 0.28 | Quercetin-3-O-glucuronide | (Kaufmann et al., 2016) |
| C10 | 10.90 | [M+H]+ | 757.1977 | 595.1453, 449.1088, 287.0558, | C36H36O18 | 756.1907 | 0.68 | Cis-shisonin | (Yamazaki et al., 2003; He et al., 2015) |
| C11 | 11.59 | [M+H]+ | 449.1087 | 287.0555, 153.0181 | C21H20O11 | 448.1013 | 1.74 | Luteoloside* | (Meng et al., 2008; Kaufmann et al., 2016) |
| C12 | 11.76 | [M+NH4]+ | 374.1449 | 231.0504, 159.0287, 145.0494, 127.0389 | C15H16O10 | 356.1110 | 0.83 | Caffeic acid-3-O-glucuronide | (Zheng et al., 2020) |
| C13 | 12.44 | [M+H]+ | 623.1252 | 447.0927, 271.0607, 141.0182 | C27H26O17 | 622.1178 | 1.36 | Apigenin-7-O-diglucuronide | (Meng et al., 2008; Kaufmann et al., 2016) |
| C14 | 13.15 | [M+H]+ | 465.1029 | 303.0505, 285.0399, 85.0254 | C21H20O12 | 464.0956 | 0.24 | Quercetin-3-O-glucoside | (Pereira et al., 2012; Kaufmann et al., 2016) |
| C15 | 14.73 | [M+H]+ | 757.1975 | 595.1442, 449.1076, 287.0547 | C36H36O18 | 756.1901 | -0.04 | Shisonin | (Yamazaki et al., 2003; He et al., 2015) |
| C16 | 15.00 | [M+H]+ | 463.0877 | 287.0554 | C21H18O12 | 462.0805 | 1.49 | Scutellarin* | (Yamazaki et al., 2003; Kaufmann et al., 2016) |
| C17 | 15.28 | [M+H]+ | 463.0876 | 287.0555 | C21H18O12 | 462.0803 | 0.98 | Luteolin-7-O-glucuronide* | (Kaufmann et al., 2016) |
| C18 | 15.57 | [M+H]+ | 433.1132 | 271.0604, 153.0181, 85.0282 | C21H20O10 | 432.1059 | 0.68 | Apigenin-7-O-glucoside* | (Yamazaki et al., 2003; Kaufmann et al., 2016) |
| C19 | 17.39 | [M+H]+ | 317.1021 | 197.0446, 182.0214, 147.0440 | C13H16O9 | 316.0948 | 0.31 | Protocatechuic acid-3-O-glucoside | (Yamazaki et al., 2003; Zheng et al., 2020) |
| C20 | 18.51 | [M+H]+ | 843.1985 | 595.1451, 535.1078, 287.0547 | C39H38O21 | 842.1912 | 0.73 | Malonyl-shisonin | (Yamazaki et al., 2003; He et al., 2015) |
| C21 | 18.88 | [M+NH4]+ | 392.2282 | 195.1380, 177.1271, 149.1328, 135.1169 | C19H18O8 | 374.1944 | 0.89 | Rosmarinic acid methyl ester | (Kaufmann et al., 2016; Zheng et al., 2020) |
| C22 | 19.67 | [M+NH4]+ | 738.2030 | 523.1245, 343.0818, 181.0496, 163.0390 | C36H32O16 | 720.1693 | 0.43 | Caffeic acid tetramer | (Zheng et al., 2020) |
| C23 | 20.11 | [M+H]+ | 447.0927 | 271.0597, 153.0176 | C21H18O11 | 446.0854 | 1.12 | Apigenin-7-O-glucuronide* | (Yamazaki et al., 2003; Kaufmann et al., 2016) |
| C24 | 21.70 | [2M+Na]+ | 743.1578 | 383.0746, 221.0421, 203.0315, 185.0207 | C18H16O8 | 360.3150 | 0.5 | Rosmarinic acid* | (Zhou et al., 2014; Kaufmann et al., 2016) |
| C25 | 29.25 | [M+H]+ | 287.0553 | 241.0497, 153.0183, 135.0439, | C15H10O6 | 286.0480 | 0.87 | Luteolin* | (Lee et al., 2013; Zhou et al., 2014) |
| C26 | 29.40 | [M+H]+ | 301.1075 | 197.0446, 182.0211, 103.0540 | C16H12O6 | 300.1002 | 1.31 | Chrysoeriol | (Lee et al., 2013; Guan et al., 2014) |
| C27 | 32.00 | [M+H]+ | 271.0601 | 243.0652, 153.0180, 119.0492 | C15H10O5 | 270.2370 | 0.14 | Apigenin* | (Pereira et al., 2012; Lee et al., 2013) |
| C28 | 34.64 | [M+H]+ | 609.2814 | 577.2529, 448.1980, 397.2128, | C33H40N2O9 | 608.2739 | -1.9 | Reserpine | Internal standard |
RT, retention time.
“*”, confirmed with reference substances.
Figure 2.

The chemical fingerprints of PLs at different harvesting by GC-MS and LC-MS. (A) Fingerprints of volatile metabolites by GC-MS; (B) Fingerprints of non-volatile metabolites by GC-MS after derivatization; (C) Fingerprints of non-volatile metabolites by LC-MS.
3.2. Principal component analysis (PCA) reveals metabolic variation of PLs at different harvest times
PCA was carried out for an overview of the dataset. In the PCA plot, three biological replicates of each stage were compactly gathered together ( Figure 3 ) while samples at different harvest time were clearly separated indicating metabolomic changes during PLs development. PC1 and PC2 explained 77.7% of the total variance. Samples collected at harvest time 4 were completely separated with samples harvested at other periods on PC1 indicating a special and significant meaning of this harvest period. The loading values of all the metabolites are listed in Table 5 .
Figure 3.

The principal component analysis (PCA) score plots of of PLs samples at different harvesting times.
Table 5.
The PCA loading values and Duncan’s test result of metabolites identified in developing PLs.
| No. | Compounds | PC1 | PC2 | Stage 1 | Stage 2 | Stage 3 | Stage 4 | Stage 5 | Stage 6 | Stage 7 |
|---|---|---|---|---|---|---|---|---|---|---|
| A1 | α-Pinene | 0.10 | -0.04 | d | bc | cd | a | ab | bc | cd |
| A2 | Pseudolimonene | 0.10 | 0.00 | c | c | b | a | b | b | b |
| A3 | D-limonene | 0.08 | -0.09 | c | bc | bc | a | a | a | b |
| A4 | α-Terpinene | 0.09 | -0.03 | c | d | d | a | bc | b | d |
| A5 | Linalool | 0.09 | 0.08 | bc | bcd | d | a | b | cd | e |
| A6 | α-Terpineol | 0.11 | 0.08 | de | b | bc | a | cd | e | f |
| A7 | Nerol | 0.10 | 0.07 | bcd | bc | b | a | d | cd | e |
| A8 | Perilla ketone | 0.05 | 0.10 | bc | a | a | ab | bc | bc | c |
| A9 | Shisool | 0.11 | -0.09 | e | e | c | a | bc | b | d |
| A10 | Perillaldehyde | 0.12 | 0.01 | f | b | c | a | d | d | e |
| A11 | γ-Elemene | 0.06 | -0.12 | f | f | e | c | b | a | d |
| A12 | α-Copaene | 0.11 | -0.08 | e | d | d | a | b | c | d |
| A13 | β-Bourbonene | 0.11 | -0.01 | d | d | d | a | b | c | e |
| A14 | β-Elemene | 0.10 | 0.06 | c | c | b | a | a | d | d |
| A15 | β-Caryophyllene | 0.11 | 0.06 | c | b | bc | a | bc | bc | d |
| A16 | Perillic acid | 0.11 | 0.03 | d | d | b | a | c | d | d |
| A17 | α-Humulene | 0.10 | 0.10 | c | c | a | a | b | d | f |
| A18 | β-Copaene | 0.11 | 0.05 | c | c | b | a | c | b | d |
| A19 | Cis-α-Bergamotene | 0.10 | 0.09 | e | b | c | a | d | f | f |
| A20 | Bicyclogermacrene | 0.11 | 0.05 | e | c | b | a | d | d | e |
| A21 | α-Farnesene | 0.10 | -0.07 | e | de | cd | a | c | b | cde |
| A22 | Myristicin | 0.12 | 0.00 | f | de | b | a | c | d | e |
| A23 | δ-Cadinene | 0.10 | 0.06 | c | c | ab | a | a | bc | d |
| A24 | Elemicin | 0.11 | 0.02 | cd | cd | bc | a | b | d | d |
| A25 | Nerolidol | 0.11 | -0.04 | e | e | e | a | b | c | d |
| A26 | Espatulenol | 0.11 | 0.08 | bc | b | b | a | b | c | d |
| A27 | β-Caryophyllene oxide | 0.07 | -0.11 | d | bc | c | bc | a | ab | bc |
| A28 | α-Patchoulene | 0.12 | -0.02 | f | f | c | a | b | d | e |
| A29 | Isoelemicin | 0.11 | 0.01 | cd | cd | bc | a | b | d | cd |
| A30 | Phytyl acetate | 0.09 | 0.05 | c | b | b | a | c | c | c |
| A31 | Pentadecanone | 0.11 | 0.01 | d | c | d | a | b | d | d |
| A32 | Myristic acid | 0.12 | 0.00 | d | c | c | a | b | c | d |
| A34 | Phytol | 0.10 | 0.04 | c | c | b | a | d | cd | cd |
| A36 | Heptacosane | 0.03 | -0.06 | c | c | c | c | b | a | d |
| A37 | Squalene | 0.12 | -0.04 | c | c | b | a | b | b | c |
| A38 | Nonacosane | 0.09 | -0.10 | d | c | c | a | bc | ab | bc |
| A39 | 1-Heptatriacotanol | 0.10 | -0.06 | d | c | b | a | a | a | cd |
| A40 | Hentriacontane | 0.06 | -0.14 | c | b | b | a | a | a | a |
| A41 | α-Tocopherol | 0.11 | -0.05 | f | d | c | a | a | b | e |
| A42 | Campesterol | 0.06 | 0.11 | bc | a | a | a | b | c | c |
| A43 | β-Stigmasterol | 0.03 | 0.12 | bc | a | b | bc | bc | c | d |
| A44 | Dotriacontane | 0.06 | -0.14 | d | d | c | b | c | a | bc |
| A45 | γ-Sitosterol | 0.07 | 0.07 | d | a | c | b | c | d | d |
| A46 | β-Amyrone | 0.06 | 0.09 | e | a | b | c | d | e | e |
| A47 | α-Amyrin | 0.02 | 0.10 | cd | a | b | c | c | d | d |
| B1 | Lactic acid | 0.11 | -0.02 | c | b | b | a | b | b | bc |
| B2 | L-Alanine | 0.08 | -0.13 | e | e | d | a | b | c | c |
| B3&B12 | L-Glycine | -0.01 | 0.17 | a | b | c | d | d | e | f |
| B4 | Oxalic acid | 0.11 | -0.03 | d | c | ab | a | bc | c | c |
| B5 | Propanedioic acid | 0.09 | -0.11 | d | c | bc | a | b | b | b |
| B6 | L-Valine | 0.11 | -0.04 | d | c | c | a | b | b | c |
| B8 | L-Leucine | 0.12 | -0.01 | e | d | b | a | b | c | de |
| B9 | Glycerol | 0.12 | 0.00 | d | de | c | a | b | d | e |
| B10 | L-Isoleucine | 0.12 | 0.00 | e | e | b | a | c | d | e |
| B11 | L-Proline | 0.10 | -0.10 | e | d | c | a | b | bc | c |
| B13 | Glyceric acid | 0.11 | 0.03 | c | ab | a | a | a | b | c |
| B7&14 | L-Serine | 0.01 | 0.17 | a | ab | b | c | c | d | e |
| B15 | L-Threonine | 0.12 | -0.04 | f | e | b | a | c | d | d |
| B16 | Malic acid | 0.11 | -0.02 | d | b | a | a | b | bc | c |
| B18 | L-Aspartic acid | 0.10 | 0.10 | d | b | a | a | c | d | e |
| B19 | γ-Aminobutanoic acid | 0.11 | -0.01 | c | b | a | a | a | b | b |
| B20 | L-Glutamic acid | 0.11 | -0.01 | d | cd | ab | a | bc | bcd | cd |
| B21 | L-Phenylalanine | -0.02 | 0.17 | a | b | c | d | e | f | f |
| B22&24 | L-Asparagine | 0.04 | 0.15 | a | a | a | a | b | b | c |
| B23 | Tartaric acid | 0.11 | 0.06 | d | b | a | a | c | c | d |
| B25 | Xylitol | 0.01 | 0.17 | a | b | b | b | c | d | d |
| B26 | L-Glutamine | 0.11 | -0.08 | f | e | b | a | c | c | d |
| B27 | Citric acid | 0.11 | 0.04 | d | ab | ab | a | b | c | cd |
| B28 | D-Fructose | 0.02 | -0.16 | f | e | d | cd | c | b | a |
| B29 | D-Galactose | -0.01 | -0.17 | e | d | c | c | b | a | a |
| B30 | D-Glucose | 0.04 | -0.16 | e | d | c | b | b | a | a |
| B31 | L-Lysine | -0.03 | 0.17 | a | b | c | d | e | f | f |
| B32 | L-Tyrosine | 0.00 | 0.17 | a | a | bc | b | c | d | e |
| B33 | D-Glucitol | -0.02 | 0.17 | a | a | b | bc | c | d | d |
| B34 | D-Sorbitol | -0.07 | -0.15 | d | d | e | e | c | b | a |
| B35 | D-Tagatose | -0.02 | -0.15 | c | c | c | b | b | b | a |
| B36 | D-Gluconic acid | -0.04 | -0.16 | f | e | f | d | c | b | a |
| B37 | Palmitic acid | 0.10 | 0.07 | c | b | b | a | c | c | c |
| B38 | Myo-Inositol | -0.04 | 0.15 | a | b | bc | cd | cd | d | d |
| B39 | Caffeic acid | 0.11 | -0.08 | e | d | b | a | a | b | c |
| B40 | Oleic acid | 0.12 | -0.03 | f | f | b | a | c | d | e |
| B41 | α-Linolenic acid | 0.10 | 0.05 | c | cd | b | a | c | de | e |
| B42 | Stearic acid | 0.12 | 0.01 | d | cd | b | a | bc | cd | d |
| B43 | D-Galacturonic acid | -0.04 | 0.13 | a | b | b | b | bc | c | d |
| B44 | Lactulose | -0.03 | -0.17 | f | ef | de | d | c | b | a |
| B45 | Sucrose | -0.03 | -0.16 | d | cd | cd | c | c | b | a |
| B47 | Maltose | -0.07 | -0.13 | c | c | c | c | c | b | a |
| B46 | D-Lactose | -0.04 | -0.16 | e | d | d | d | c | b | a |
| B48 | D-Cellobiose | -0.03 | -0.13 | c | b | b | b | b | b | a |
| B49 | Galactinol | -0.03 | 0.16 | a | b | b | c | d | d | e |
| B51 | D-Mannose | -0.03 | -0.14 | e | c | cd | d | cd | b | a |
| C1 | Acetyloxycaffeic acid | 0.06 | -0.11 | e | e | c | b | d | a | c |
| C2 | Coumaric acid-4- O- glucoside | 0.11 | -0.02 | c | b | a | a | a | a | d |
| C3 | Caffeic acid ethyl ester | 0.00 | -0.15 | f | g | d | c | e | a | b |
| C4 | Tuberonic acid glucoside | 0.12 | -0.01 | f | e | c | a | b | d | g |
| C5 | Tuberonic acid | 0.12 | 0.00 | f | e | b | a | c | d | f |
| C6 | Apigenin-7-O-dilgucoside | 0.12 | 0.06 | e | c | b | a | c | d | f |
| C7 | Scutellarin-7-O-diglucuronide | 0.11 | -0.01 | d | e | a | a | b | c | e |
| C8 | Luteolin-7-O-diglucuronide | 0.11 | 0.02 | bc | b | b | a | b | c | c |
| C9 | Quercetin-3-O-glucuronide | 0.12 | 0.02 | f | d | b | a | c | d | e |
| C10 | Cis-shisonin | 0.08 | -0.02 | d | d | d | b | a | c | e |
| C11 | Luteoloside | 0.12 | -0.05 | d | c | c | a | b | c | c |
| C12 | Caffeic acid-3-O-glucuronide | 0.06 | -0.13 | f | f | d | b | e | a | c |
| C13 | Apigenin-7-O-diglucuronide | 0.13 | 0.00 | d | c | c | a | b | c | d |
| C14 | Quercetin-3-O-glucoside | 0.11 | 0.05 | d | b | a | a | a | c | e |
| C15 | Shisonin | 0.04 | -0.07 | e | d | cd | c | a | b | cd |
| C16 | Scutellarin | 0.12 | -0.01 | d | c | b | a | b | b | d |
| C17 | Luteolin-7-O-glucuronide | 0.12 | -0.01 | f | d | ab | a | bc | cd | e |
| C18 | Apigenin-7-O-glucoside | 0.12 | -0.03 | e | c | b | a | b | c | d |
| C19 | Protocatechuic acid-3-O-glucoside | 0.10 | 0.08 | e | a | a | a | b | c | d |
| C20 | Malonyl-shisonin | 0.06 | -0.07 | e | d | cd | b | a | b | c |
| C21 | Rosmarinic acid methyl ester | 0.06 | 0.06 | c | d | a | b | e | c | f |
| C22 | Caffeic acid tetramer | 0.11 | -0.05 | f | d | d | a | b | c | e |
| C23 | Apigenin-7-O-glucuronide | 0.12 | -0.03 | e | c | b | a | b | b | d |
| C24 | Rosmarinic acid | 0.11 | -0.09 | e | d | b | a | b | b | c |
| C25 | Luteolin | 0.11 | 0.06 | d | c | b | a | a | cd | e |
| C29 | Chrysoeriol | 0.11 | 0.08 | e | c | b | a | d | e | f |
| C27 | Apigenin | 0.12 | 0.05 | d | c | c | a | b | d | e |
a, b, c, d, e, f indicated significant levels according to Duncan’s test (p < 0.05).
3.3. Clustering analysis reveals dynamic patterns of metabolites in PLs during developmental process
To observe the dynamic changes of metabolites in different harvest periods in a more intuitive manner, a heatmap of the 118 different metabolites was obtained ( Figure 4A ).
Figure 4.

Metabolome dynamics of developing PLs. (A) Overview of the metabolite dynamics with clustering heat map. (B–G) Present the dynamics of volatile oils, sugars, phytosterols and fatty acids, amino acids, phenolic acids and organic acids, derivatives, flavonoids and anthocyanins.
3.3.1. Dynamic patterns of volatile compounds
Volatile oil is a very important and widely studied class of metabolites in perilla. They showed bioactivities such as antibacterial, antiviral, anti-inflammatory, anticarcinogenic, antioxidant, etc (Raut and Karuppayil, 2014). In most flowering plants, the production and emission of volatile metabolites are developmentally regulated and show similar developmental characteristics. Normally, volatile oil accumulates in the early developmental stage when fruits are not mature or before the flowers are ready for pollination. Then a release of volatile components to attract pollinators might cause a decrease of volatile compounds in the early stage of flowering (Dudareva et al., 2000; Dudareva et al., 2013). In the present study, most of volatile oil compounds showed highest level at stage 4 which was pre anthesis period ( Figure 4B ). Only heptacosane and γ-elemene showed the highest level at stage 6 which was a stage before fruiting period ( Figure 4B ). The dynamic patterns of volatile compounds indicated their crucial function in plant pollination and reproduction.
3.3.2. Sugars and derivatives
During photosynthesis, all kinds of carbon is fixed in the forms of sugars and sugar derivatives (Smeekens and Hellmann, 2014; Sakr et al., 2018) Sugars help plants store energy and play essential roles in signalling pathways of plant growth and development. In this study, the main sugars in PLs are D-fructose, D-glucose and sucrose. They accumulated constantly during the developmental process of PLs and were with highest levels in fruiting phase ( Figure 4C ). Most of the sugars and sugar derivatives showed similar dynamic patterns as them ( Figure 4C ). Only five sugar derivatives (xylitol, D-glucitol, myo-inositol, galactinol and galacturonic acid) changed differently, with higher content at early developmental stage and decreased throughout the development process ( Figure 4C ). Accumulation of sugar content during plant development was also observed in Cichorium spinosum (Petropoulos et al., 2018).
3.3.3. Phytosterols and fatty acids
The sterol composition of plants is complex and diverse. The main membrane sterols in higher plants are β-sitosterol, stigmasterol and campesterol (Ruan, 2014). Sterols are not only signal and regulatory molecules involved in plant growth and development, but also play key roles in cell proliferation and differentiation (Guo et al., 1995; Moreau et al., 2018). In this study, all phytosterols were showed the highest level at stage 2, and decreased gradually (γ-sitosterol, β-amyrone, α-amyrin, stigmasterol, campesterol) ( Figure 4D ). This trend may be due to the vigorous metabolism of cells in the nutritional stage.
Fatty acids and lipids provide structural integrity and energy for various metabolic processes (Lim et al., 2017). The predominant fatty acids detected in PLs were palmitic acid, oleic acid and α-linolenic acid which increased pre anthesis period and declined afterwards ( Figure 4D ). Oleic acid and α-linolenic acid are essential unsaturated fatty acids (UFAs) and recommended for consumption for their multiple health benefits, such as anti-obesity (Fan et al., 2020), cardioprotection (Russell et al., 2020), anti-diabetes (Canetti et al., 2014), anti-inflammation (Wang et al., 2020), anti-cancer (Schiessel et al., 2015), neuroprotection (Kumari et al., 2019) and so on. Intake of α-linolenic acid rich P. frutescens leaf powder in Japanese adults showed some cardiovascular protective effects (Hashimoto et al., 2020). Considering the health benefits of these unsaturated fatty acids, stage 4, the pre anthesis period would be suitable harvest time for ensuring high content of these UFAs in perilla leaves.
3.3.4. Amino acids
Amino acids are not only important components for plants to complete their life cycle activities (Paulusma et al., 2022), but also essential nutrients for humans and other animals. PLs are rich in amino acids. Amino acids in PLs showed two distinct dynamic patterns during PLs development. Some amino acids were with higher content at early stages and decreased throughout the developmental process, such as L-serine, L-lysine, L-phenylalanine, L-tyrosine, L-glycine ( Figure 4E ). Other amino acids were showed the highest level at stage 4, and decreased afterwards, such as L-aspartic acid, L-isoleucine, L-threonine, L-leucine, L-glutamine, L-proline, L-valine, L-alanine, etc ( Figure 4E ). Free amino acids could elicit complex gustatory sensation (Kawai et al., 2012), especially the taste of umami. They can bring fresh and brisk tastes to PLs and participate in the formation of aroma substances (Lee et al., 2019). With the maturity and senescence of leaves, there may be two reasons for the decrease of amino acids. First, amino acids might be involved in the synthesis of storage proteins. Second, the complete oxidation of amino acids produces the energy required to meet the special needs of certain organs, such as stressed leaves or roots. The molecular mechanism of regulation of amino acid catabolism in plants is complex and unclear so far (Hildebrandt et al., 2015). Considering the nutritional value and gustatory sensation of amino acids, it would be appropriate to harvest perilla leaves before the pre anthesis period.
3.3.4. Phenolic acids and organic acids
Phenolic acids have various pharmacological activities, such as anti-inflammatory, anti-anxiety, and anti-depressive activities (Tinikul et al., 2018; Deguchi and Ito, 2020). Some of them are connected to the polymer of the cell wall through covalent bonds, which is crucial to the process of plant immune mechanism (Stuper-Szablewska and Perkowski, 2019). The predominant phenolic acids detected in PLs were rosmarinic acid and caffeic acid, which showed highest level at stage 4 ( Figure 4F ).
Organic acids are the intermediate products of cell metabolic tricarboxylic acid (TCA) cycle (Xiao and Wu, 2014). Many environmental stresses stimulate the biosynthesis and release of organic acids. For example, plants secrete organic acids in root exudates to mobilize phosphorus in deficient soil (Panchal et al., 2021). The main organic acids in PLs are lactic acid, malic acid, tartaric acid and citric acid. They also increased at early stages, showed highest level at around pre anthesis period and decreased afterwards ( Figure 4F ). Organic acids contribute to the sourness and fruity taste of plants, while inhibit the bitterness taste (Wang et al., 2021). Therefore, considering the high content of these compounds in PLs at the stage 4, alternative uses for food or pharmaceutical can be proposed.
3.3.5. Flavonoids and natural pigments
Flavonoids play an important role in plant development and defense, have the ability to scavenge reactive oxygen species (ROS) and protect plants against damage from biotic and abiotic stresses (Iwashina, 2003; Pourcel et al., 2007). During perilla leaves development, the detected flavonoids presented an unanimous changing pattern. All the flavonoids accumulated pre anthesis period and showed the highest level at stage 4 ( Figure 4G ). Previous studies reported that flavonoids have many biological functions such as anti-inflammatory, anti-oxidative, anti-diabetic, and anti-hypertensive activities (Kawser Hossain et al., 2016; Jiang et al., 2020).
The color of fruits and flowers is crucial in plant ecology, can attract pollinators and seed-dispersal organisms (Grotewold, 2006). The molecular signals that induce pigment biosynthesis during pollination are unclear, but light plays a central role (Farzad et al., 2002). Natural pigments from PLs have exhibited a wide range of bioactive properties including antioxidant effects, anti-inflammatory effects, etc (Chang et al., 2005; Wang and Stoner, 2008; Lila et al., 2016). Natural pigments detected in PLs including shisonin and its derivatives. They showed the highest level at stage 5 (vigorous flowering period) ( Figure 4G ). According to this result, if the targeted metabolites are these pigments, it is better to harvest PLs during flowering period.
4. Conclusion
In this study, our results showed the advantages of applying an integrated LC-MS and GC-MS metabolomic platforms the evaluation of optimal harvesting period for plants. We employed metabolomic analysis to clarified the evolutionary trajectories and dynamic changes of volatile oil compounds, sugars, flavonoids, amino acids, organic acids, etc. The results of this study provide a theoretical basis for the development of PLs and offer data support for the optimal harvesting period of PLs. Considering the content of most of the nutrients and bioactive components, pre anthesis period is a suitable harvest time for PLs.
Data availability statement
The original contributions presented in the study are included in the article/supplementary material. Further inquiries can be directed to the corresponding author.
Author contributions
LW and YZ conceived and designed the experiments. JC performed the experiments. JC, GY, and AY analyzed the data. JC wrote the manuscript. LW, YZ and LG revised and edited the manuscript. All authors have read and agreed to the published version of the manuscript.
Funding
This research was funded by Natural Science Foundation of Hebei Province (C2020423047); Research Foundation of Hebei Provincial Administration of Traditional Chinese Medicine (2019083); The Innovation Team of Hebei Province Modern Agricultural Industry Technology System (HBCT2018060205).
Acknowledgments
We would like to thank Prof. Chunxiu Wen and her team for providing us the plant materials. We would like to thank the gardeners for their great maintenance of the perilla. We would like to thank all the members in Traditional Chinese Medicine Processing Technology Innovation Center of Hebei Province for fruitful discussions.
Conflict of interest
The authors declare that the research was conducted in the absence of any commercial or financial relationships that could be construed as a potential conflict of interest.
Publisher’s note
All claims expressed in this article are solely those of the authors and do not necessarily represent those of their affiliated organizations, or those of the publisher, the editors and the reviewers. Any product that may be evaluated in this article, or claim that may be made by its manufacturer, is not guaranteed or endorsed by the publisher.
References
- Ahmed H. M. (2018). Ethnomedicinal, phytochemical and pharmacological investigations of perilla frutescens (L.) britt. Mol. (Basel. Switzerland). 24 (1), 102. doi: 10.3390/molecules24010102 [DOI] [PMC free article] [PubMed] [Google Scholar]
- Banno N., Akihisa T., Tokuda H., Yasukawa K., Higashihara H., Ukiya M., et al. (2004). Triterpene acids from the leaves of perilla frutescens and their anti-inflammatory and antitumor-promoting effects. Biosci. Biotechnol. Biochem. 68 (1), 85–90. doi: 10.1271/bbb.68.85 [DOI] [PubMed] [Google Scholar]
- Canetti L., Werner H., Leikin-Frenkel A. (2014). Linoleic and alpha linolenic acids ameliorate streptozotocin-induced diabetes in mice. Arch. Physiol. Biochem. 120 (1), 34–39. doi: 10.3109/13813455.2013.868002 [DOI] [PubMed] [Google Scholar]
- Chang Y. C., Huang H. P., Hsu J. D., Yang S. F., Wang C. J. (2005). Hibiscus anthocyanins rich extract-induced apoptotic cell death in human promyelocytic leukemia cells. Toxicol. Appl. Pharmacol. 205 (3), 201–212. doi: 10.1016/j.taap.2004.10.014 [DOI] [PubMed] [Google Scholar]
- Chang Y., Zhang D., Yang G., Zheng Y., Guo L. (2021). Screening of anti-lipase components of artemisia argyi leaves based on spectrum-effect relationships and HPLC-MS/MS. Front. Pharmacol. 12. doi: 10.3389/fphar.2021.675396 [DOI] [PMC free article] [PubMed] [Google Scholar]
- Chaturvedula V., Prakash I. (2013). Isolation and structure elucidation of two triterpene acids from the leaves of perilla frutescens. J. Pharmacogn. Phytochem. 1 (6), 49–53. doi: 10.3969/j.issn.2095-0837.1998.04.002 [DOI] [Google Scholar]
- Deguchi Y., Ito M. (2020). Caffeic acid and rosmarinic acid contents in genus perilla. J. Natural Medicines 74 (4), 834–839. doi: 10.1007/s11418-020-01418-5 [DOI] [PubMed] [Google Scholar]
- Dudareva N., Klempien A., Muhlemann J. K., Kaplan I. (2013). Biosynthesis, function and metabolic engineering of plant volatile organic compounds. New Phytol. 198 (1), 16–32. doi: 10.1111/nph.12145 [DOI] [PubMed] [Google Scholar]
- Dudareva N., Murfitt L. M., Mann C. J., Gorenstein N., Kolosova N., Kish C. M., et al. (2000). Developmental regulation of methyl benzoate biosynthesis and emission in snapdragon flowers. Plant Cell 12 (6), 949–961. doi: 10.1105/tpc.12.6.949 [DOI] [PMC free article] [PubMed] [Google Scholar]
- Fan R., Kim J., You M., Giraud D., Toney A. M., Shin S. H., et al. (2020). α-linolenic acid-enriched butter attenuated high fat diet-induced insulin resistance and inflammation by promoting bioconversion of n-3 PUFA and subsequent oxylipin formation. J. Nutr. Biochem. 76, 108285. doi: 10.1016/j.jnutbio.2019.108285 [DOI] [PMC free article] [PubMed] [Google Scholar]
- Farzad M., Griesbach R., Weiss M. R. (2002). Floral color change in viola cornuta l. (violaceae): a model system to study regulation of anthocyanin production. Plant Sci. 162 (2), 225–231. doi: 10.1016/S0168-9452(01)00557-X [DOI] [Google Scholar]
- Ghimire B. K., Ji H. Y., Chang Y. Y., Kim S. H., Chung I. M. (2019). Profiling volatile and phenolic compound composition and characterization of the morphological and biological activities of perilla frutescence britton var. Jpn. Accessions. Acta Physiol. Plant. 41, 108. doi: 10.1007/s11738-019-2890-1 [DOI] [Google Scholar]
- Ghimire B. K., Yoo J. H., Yu C. Y., Chung I. M. (2017). GC-MS analysis of volatile compounds of perilla frutescens britton var. japonica accessions: Morphological and seasonal variability. Asian Pac. J. Trop. Med. 10 (7), 643–651. doi: 10.1016/j.apjtm.2017.07.004 [DOI] [PubMed] [Google Scholar]
- Grotewold E. (2006). The genetics and biochemistry of floral pigments. Annu. Rev. Plant Biol. 57, 761–780. doi: 10.1146/annurev.arplant.57.032905.105248 [DOI] [PubMed] [Google Scholar]
- Guan Z., Li S., Lin Z., Yang R., Zhao Y., Liu J., et al. (2014). Identification and quantitation of phenolic compounds from the seed and pomace of perilla frutescens using HPLC/PDA and HPLC-ESI/QTOF/MS/MS. Phytochem. Anal. 25 (6), 508–513. doi: 10.1002/pca.2521 [DOI] [PubMed] [Google Scholar]
- Guo D. A., Venkatramesh M., Nes W. D. (1995). Developmental regulation of sterol biosynthesis in zea mays. Lipids 30 (3), 203–219. doi: 10.1007/BF02537823 [DOI] [PubMed] [Google Scholar]
- Ha T. J., Lee J. H., Lee M. H., Lee B. W., Kwon H. S., Park C. H., et al. (2012). Isolation and identification of phenolic compounds from the seeds of perilla frutescens (L.) and their inhibitory activities against α-glucosidase and aldose reductase. Food Chem. 135 (3), 1397–1403. doi: 10.1016/j.foodchem.2012.05.104 [DOI] [PubMed] [Google Scholar]
- Hashimoto M., Tanabe Y., Hossain S., Matsuzaki K., Ohno M., Kato S., et al. (2020). Intake of alpha-linolenic acid-rich perilla frutescens leaf powder decreases home blood pressure and serum oxidized low-density lipoprotein in Japanese adults. Mol. (Basel. Switzerland). 25 (9), 2099. doi: 10.3390/molecules25092099 [DOI] [PMC free article] [PubMed] [Google Scholar]
- He Y. K., Yao Y. Y., Chang Y. N. (2015). Characterization of anthocyanins in perilla frutescens var. acuta extract by advanced UPLC-ESI-IT-TOF-MSn method and their anticancer bioactivity. Mol. (Basel. Switzerland). 20 (5), 9155–9169. doi: 10.3390/molecules20059155 [DOI] [PMC free article] [PubMed] [Google Scholar]
- Hildebrandt T. M., Nunes Nesi A., Araújo W. L., Braun H. P. (2015). Amino acid catabolism in plants. Mol. Plant 8 (11), 1563–1579. doi: 10.1016/j.molp.2015.09.005 [DOI] [PubMed] [Google Scholar]
- Igarashi M., Miyazaki Y. (2013). A review on bioactivities of perilla: progress in research on the functions of perilla as medicine and food. Evidence-Based Complement. Altern. Med. 2013, 925342. doi: 10.1155/2013/925342 [DOI] [PMC free article] [PubMed] [Google Scholar]
- Ito N., Nagai T., Oikawa T., Yamada H., Hanawa T. (2011). Antidepressant-like effect of l-perillaldehyde in stress-induced depression-like model mice through regulation of the olfactory nervous system. Evidence-Based Complement. Altern. Med. 2011, 512697. doi: 10.1093/ecam/nen045 [DOI] [PMC free article] [PubMed] [Google Scholar]
- Iwashina T. (2003). Flavonoid function and activity to plants and other organisms. Uchu. Seibutsu. Kagaku 17 (1), 24–44. doi: 10.2187/bss.17.24 [DOI] [PubMed] [Google Scholar]
- Jiang T., Guo K., Liu L., Tian W., Xie X., Wen S., et al. (2020). Integrated transcriptomic and metabolomic data reveal the flavonoid biosynthesis metabolic pathway in perilla frutescens (L.) leaves. Sci. Rep. 10 (1), 16207. doi: 10.1038/s41598-020-73274-y [DOI] [PMC free article] [PubMed] [Google Scholar]
- Kaufmann C. M., Grassmann J., Letzel T. (2016). HPLC method development for the online-coupling of chromatographic perilla frutescens extract separation with xanthine oxidase enzymatic assay. J. Pharm. Biomed. Anal. 124, 347–357. doi: 10.1016/j.jpba.2016.03.011 [DOI] [PubMed] [Google Scholar]
- Kawai M., Sekine-Hayakawa Y., Okiyama A., Ninomiya Y. (2012). Gustatory sensation of (L)- and (D)-amino acids in humans. Amino Acids 43 (6), 2349–2358. doi: 10.1007/s00726-012-1315-x [DOI] [PubMed] [Google Scholar]
- Kawser Hossain M., Abdal Dayem A., Han J., Yin Y., Kim K., Kumar Saha S., et al. (2016). Molecular mechanisms of the anti-obesity and anti-diabetic properties of flavonoids. Int. J. Mol. Sci. 17 (4), 569. doi: 10.3390/ijms17040569 [DOI] [PMC free article] [PubMed] [Google Scholar]
- Kim J. K., Park S. Y., Na J. K., Seong E. S., Yu C. Y. (2012). Metabolite profiling based on lipophilic compounds for quality assessment of perilla (Perilla frutescens) cultivars. J. Agric. Food Chem. 60 (9), 2257–2263. doi: 10.1021/jf204977x [DOI] [PubMed] [Google Scholar]
- Kumari S., Mazumder A. G., Bhardwaj A., Singh D. (2019). Early α-linolenic acid exposure to embryo reduces pentylenetetrazol-induced seizures in zebrafish larva. Prostaglandins. Leukotrienes. Essential. Fatty Acids 143, 15–20. doi: 10.1016/j.plefa.2019.02.002 [DOI] [PubMed] [Google Scholar]
- Lee J., Kim D. S., Cho J., Hong S. J., Pan J. H., Kim J. K., et al. (2019). Perilla frutescens britton: A comprehensive study on flavor/taste and chemical properties during the roasting process. Mol. (Basel. Switzerland). 24 (7), 1374. doi: 10.3390/molecules24071374 [DOI] [PMC free article] [PubMed] [Google Scholar]
- Lee J. H., Park K. H., Lee M. H., Kim H. T., Seo W. D., Kim J. Y., et al. (2013). Identification, characterization, and quantification of phenolic compounds in the antioxidant activity-containing fraction from the seeds of Korean perilla (Perilla frutescens) cultivars. Food Chem. 136 (2), 843–852. doi: 10.1016/j.foodchem.2012.08.057 [DOI] [PubMed] [Google Scholar]
- Lila M. A., Burton-Freeman B., Grace M., Kalt W. (2016). Unraveling anthocyanin bioavailability for human health. Annu. Rev. Food Sci. Technol. 7, 375–393. doi: 10.1146/annurev-food-041715-033346 [DOI] [PubMed] [Google Scholar]
- Lim G. H., Singhal R., Kachroo A., Kachroo P. (2017). Fatty acid- and lipid-mediated signaling in plant defense. Annu. Rev. Phytopathol. 55, 505–536. doi: 10.1146/annurev-phyto-080516-035406 [DOI] [PubMed] [Google Scholar]
- Luo Y. J., Guo J. Q., Li W. P., Yao Y., Wen C. M., Guo B. L. (2021). Contents determination of eight phenolic compounds in perilla frutescens leaves of different cultivation years and harvesting periods. Zhongguo. Zhong. Yao. Za. Zhi. 46 (3), 567–574. doi: 10.19540/j.cnki.cjcmm.20201114.101 [DOI] [PubMed] [Google Scholar]
- Ma X. Q., Leung A. K., Chan C. L., Su T., Li W. D., Li S. M., et al. (2014). UHPLC UHD q-TOF MS/MS analysis of the impact of sulfur fumigation on the chemical profile of codonopsis radix (Dangshen). Analyst. 139 (2), 505–516. doi: 10.1039/c3an01561k [DOI] [PubMed] [Google Scholar]
- Mari A., Lyon D., Fragner L., Montoro P., Piacente S., Wienkoop S., et al. (2013). Phytochemical composition of potentilla anserina l. analyzed by an integrative GC-MS and LC-MS metabolomics platform. Metabolomics 9 (3), 599–607. doi: 10.1007/s11306-012-0473-x [DOI] [PMC free article] [PubMed] [Google Scholar]
- Meng L., Lozano Y. F., Gaydou E. M., Li B. (2008). Antioxidant activities of polyphenols extracted from perilla frutescens varieties. Mol. (Basel. Switzerland). 14 (1), 133–140. doi: 10.3390/molecules14010133 [DOI] [PMC free article] [PubMed] [Google Scholar]
- Moreau R. A., Nyström L., Whitaker B. D., Winkler-Moser J. K., Baer D. J., Gebauer S. K., et al. (2018). Phytosterols and their derivatives: Structural diversity, distribution, metabolism, analysis, and health-promoting uses. Prog. Lipid Res. 70, 35–61. doi: 10.1016/j.plipres.2018.04.001 [DOI] [PubMed] [Google Scholar]
- Panchal P., Miller A. J., Giri J. (2021). Organic acids: versatile stress-response roles in plants. J. Exp. Bot. 72 (11), 4038–4052. doi: 10.1093/jxb/erab019 [DOI] [PubMed] [Google Scholar]
- Paulusma C. C., Lamers W. H., Broer S., van de Graaf S. (2022). Amino acid metabolism, transport and signalling in the liver revisited. Biochem. Pharmacol. 201, 115074. doi: 10.1016/j.bcp.2022.115074 [DOI] [PubMed] [Google Scholar]
- Peiretti P. G. (2011). Fatty acid content and chemical composition of vegetative parts of perilla (perilla frutescens l.) after different growth lengths. Res. J. Med. Plant 5 (1), 72–78. doi: 10.3923/rjmp.2011.72.78 [DOI] [Google Scholar]
- Pereira O. R., Silva A., Domingues M., Cardoso S. M. (2012). Identification of phenolic constituents of cytisus multiflorus. Food Chem. 131 (2), 652–659. doi: 10.1016/j.foodchem.2011.09.045 [DOI] [Google Scholar]
- Petropoulos S. A., Fernandes Â., Vasileios A., Ntatsi G., Barros L., Ferreira I. (2018). Chemical composition and antioxidant activity of cichorium spinosum l. leaves in relation to developmental stage. Food. Chem. 239, 946–952. doi: 10.1016/j.foodchem.2017.07.043 [DOI] [PubMed] [Google Scholar]
- Pourcel L., Routaboul J. M., Cheynier V., Lepiniec L., Debeaujon I. (2007). Flavonoid oxidation in plants: from biochemical properties to physiological functions. Trends Plant Sci. 12 (1), 29–36. doi: 10.1038/s41598-020-73274-y [DOI] [PubMed] [Google Scholar]
- Quirantes-Piné R., Arráez-Román D., Segura-Carretero A., Fernández-Gutiérrez A. (2010). Characterization of phenolic and other polar compounds in a lemon verbena extract by capillary electrophoresis-electrospray ionization-mass spectrometry. J. Sep. Sci. 33 (17-18), 2818–2827. doi: 10.1002/jssc.201000228 [DOI] [PubMed] [Google Scholar]
- Raut J. S., Karuppayil S. M. (2014). A status review on the medicinal properties of essential oils. Ind. Crops Products. 62 (62), 250–264. doi: 10.1016/j.indcrop.2014.05.055 [DOI] [Google Scholar]
- Ruan Y. L. (2014). Sucrose metabolism: gateway to diverse carbon use and sugar signaling. Annu. Rev. Plant Biol. 65, 33–67. doi: 10.1146/annurev-arplant-050213-040251 [DOI] [PubMed] [Google Scholar]
- Russell J. S., Griffith T. A., Naghipour S., Vider J., Du Toit E. F., Patel H. H., et al. (2020). Dietary α-linolenic acid counters cardioprotective dysfunction in diabetic mice: Unconventional PUFA protection. Nutrients 12 (9), 2679. doi: 10.3390/nu12092679 [DOI] [PMC free article] [PubMed] [Google Scholar]
- Sakr S., Wang M., Dédaldéchamp F., Perez-Garcia M. D., Ogé L., Hamama L., et al. (2018). The sugar-signaling hub: Overview of regulators and interaction with the hormonal and metabolic network. Int. J. Mol. Sci. 19 (9), 2506. doi: 10.3390/ijms19092506 [DOI] [PMC free article] [PubMed] [Google Scholar]
- Schiessel D. L., Yamazaki R. K., Kryczyk M., Coelho I., Yamaguchi A. A., Pequito D. C., et al. (2015). α-linolenic fatty acid supplementation decreases tumor growth and cachexia parameters in walker 256 tumor-bearing rats. Nutr. Cancer 67 (5), 839–846. doi: 10.1080/01635581.2015.1043021 [DOI] [PubMed] [Google Scholar]
- Smeekens S., Hellmann H. A. (2014). Sugar sensing and signaling in plants. Front. Plant Sci. 5. doi: 10.3389/fpls.2014.00113 [DOI] [PMC free article] [PubMed] [Google Scholar]
- Stuper-Szablewska K., Perkowski J. (2019). Phenolic acids in cereal grain: Occurrence, biosynthesis, metabolism and role in living organisms. Crit. Rev. Food Sci. Nutr. 59 (4), 664–675. doi: 10.1080/10408398.2017.1387096 [DOI] [PubMed] [Google Scholar]
- Tinikul R., Chenprakhon P., Maenpuen S., Chaiyen P. (2018). Biotransformation of plant-derived phenolic acids. Biotechnol. J. 13 (6), e1700632. doi: 10.1002/biot.201700632 [DOI] [PubMed] [Google Scholar]
- Wang H., Hua J., Yu Q., Li J., Wang J., Deng Y., et al. (2021). Widely targeted metabolomic analysis reveals dynamic changes in non-volatile and volatile metabolites during green tea processing. Food Chem. 363, 130131. doi: 10.1016/j.foodchem.2021.130131 [DOI] [PubMed] [Google Scholar]
- Wang T., Sha L., Li Y., Zhu L., Wang Z., Li K., et al. (2020). Dietary α-linolenic acid-rich flaxseed oil exerts beneficial effects on polycystic ovary syndrome through sex steroid hormones-Microbiota-Inflammation axis in rats. Front. Endocrinol. 11. doi: 10.3389/fendo.2020.00284 [DOI] [PMC free article] [PubMed] [Google Scholar]
- Wang L. S., Stoner G. D. (2008). Anthocyanins and their role in cancer prevention. Cancer Lett. 269 (2), 281–290. doi: 10.1016/j.canlet.2008.05.020 [DOI] [PMC free article] [PubMed] [Google Scholar]
- Wang L., Sun X., Jakob W., Wolfram W. (2017). System-level and granger network analysis of integrated proteomic and metabolomic dynamics identifies key points of grape berry development at the interface of primary and secondary metabolism. Front. Plant 8. doi: 10.3389/fpls.2017.01066 [DOI] [PMC free article] [PubMed] [Google Scholar]
- Wang Z., Tu Z., Xie X., Cui H., Kong K. W., Zhang L. (2021). Perilla frutescens leaf extract and fractions: polyphenol composition, antioxidant, enzymes (α-glucosidase, acetylcholinesterase, and tyrosinase) inhibitory, anticancer, and antidiabetic activities. Foods. (Basel. Switzerland). 10 (2), 315. doi: 10.3390/foods10020315 [DOI] [PMC free article] [PubMed] [Google Scholar]
- Weckwerth W., Wenzel K., Fiehn O. (2010). Process for the integrated extraction, identification and quantification of metabolites, proteins and RNA to reveal their co-regulation in biochemical networks. Proteomics 4 (1), 78–83. doi: 10.1002/pmic.200200500 [DOI] [PubMed] [Google Scholar]
- Wei C. L., Zhang C. W., Guo B. L., Li W. P., Gao Z. X., Zhang F., et al. (2017). Research on effects of chemotype and components of perilla frutescens leaf volatile oil I: different phenological periods. Zhong. guo. Zhong. Yao. Za. Zhi. 42 (4), 712–718. doi: 10.19540/j.cnki.cjcmm [DOI] [PubMed] [Google Scholar]
- Xiao M., Wu F. (2014). A review of environmental characteristics and effects of low-molecular weight organic acids in the surface ecosystem. J. Environ. Sci. (China). 26 (5), 935–954. doi: 10.1016/S1001-0742(13)60570-7 [DOI] [PubMed] [Google Scholar]
- Yamazaki M., Nakajima J., Yamanashi M., Sugiyama M., Makita Y., Springob K., et al. (2003). Metabolomics and differential gene expression in anthocyanin chemo-varietal forms of perilla frutescens. Phytochemistry 62 (6), 987–995. doi: 10.1016/s0031-9422(02)00721-5 [DOI] [PubMed] [Google Scholar]
- Yang H., Sun W., Fan Y. N., Li S. Y., Yuan J. Q., Zhang Z. Q., et al. (2021). Perilla leaf extract attenuates asthma airway inflammation by blocking the syk pathway. Mediators Inflammation 2021, 6611219. doi: 10.1155/2021/6611219 [DOI] [PMC free article] [PubMed] [Google Scholar]
- Yu H., Qiu J. F., Ma L. J., Hu Y. J., Li P., Wan J. B. (2017). Phytochemical and phytopharmacological review of perilla frutescens l. (Labiatae), a traditional edible-medicinal herb in China. Food Chem. Toxicol. 108 (Pt B), 375–391. doi: 10.1016/j.fct.2016.11.023 [DOI] [PubMed] [Google Scholar]
- Zhang Y., Shen Q., Leng L., Zhang D., Chen S., Shi Y., et al. (2021). Incipient diploidization of the medicinal plant perilla within 10,000 years. Nat. Commun. 12 (1), 5508. doi: 10.1038/s41467-021-25681-6 [DOI] [PMC free article] [PubMed] [Google Scholar]
- Zheng Y. F., Li D. Y., Sun J., Cheng J. M., Chai C., Zhang L., et al. (2020). Comprehensive comparison of two color varieties of perillae folium using rapid resolution liquid chromatography coupled with quadruple-time-of-flight mass spectrometry (RRLC-Q/TOF-MS)-based metabolic profile and in vivo/in vitro anti-oxidative activity. J. Agric. Food Chem. 68 (49), 14684–14697. doi: 10.1021/acs.jafc.0c05407 [DOI] [PubMed] [Google Scholar]
- Zhou X. J., Yan L. L., Yin P. P., Shi L. L., Zhang J. H., Liu Y. J., et al. (2014). Structural characterisation and antioxidant activity evaluation of phenolic compounds from cold-pressed perilla frutescens var. arguta seed flour. Food Chem. 164, 150–157. doi: 10.1016/j.foodchem.2014.05.062 [DOI] [PubMed] [Google Scholar]
- Zhou P., Yin M., Dai S., Bao K., Song C., Liu C., et al. (2021). Multi-omics analysis of the bioactive constituents biosynthesis of glandular trichome in perilla frutescens. BMC Plant Biol. 21 (1), 277. doi: 10.1186/s12870-021-03069-4 [DOI] [PMC free article] [PubMed] [Google Scholar]
Associated Data
This section collects any data citations, data availability statements, or supplementary materials included in this article.
Data Availability Statement
The original contributions presented in the study are included in the article/supplementary material. Further inquiries can be directed to the corresponding author.