Abstract
Medulloblastoma, a malignant childhood cerebellar tumor, molecularly segregates into biologically distinct subgroups warranting personalized therapy1. Murine modeling and cross-species genomics have provided mounting evidence of discrete, subgroup-specific developmental origins2. However, human-specific anatomic and cellular complexity3, particularly within the rhombic lip germinal zone that produces all glutamatergic neuronal lineages prior to internalization into the cerebellar nodulus, complicates prior murine-derived inferences. Here, we utilized multi-omics to resolve medulloblastoma subgroup origins in the developing human cerebellum. Molecular signatures encoded within a human rhombic lip-derived lineage trajectory aligned with photoreceptor and unipolar brush cell expression profiles maintained in Group 3 and Group 4 medulloblastoma, implicating convergent basis. Systematic diagnostic imaging review of a prospective institutional cohort localized the putative anatomic origins of Group 3 and Group 4 tumors to the nodulus. Our results connect molecular and phenotypic features of clinically challenging medulloblastoma subgroups to their unified beginnings in the early human rhombic lip.
Summary paragraph
Unlike adult cancers attributable to repeated environmental exposures, childhood malignancies are more often the consequence of failed developmental processes4. Solving lineage-specific origins of distinct pediatric cancers is prerequisite to accurate disease modeling and therapeutic advancement. Medulloblastoma (MB), a malignant embryonal brain tumor1, exemplifies a prominent and clinically heterogeneous childhood cancer stemming from aberrant hindbrain development. Molecular subgroups of MB – WNT, SHH, Group 3, and Group 4 – are suspected to originate from discrete neuronal lineages during temporally restricted developmental windows2. In contrast to WNT and SHH-MB, etiology of molecularly diverse and overlapping Group 3 and Group 4-MB remains obscure and genetically engineered mouse models required to decipher the developmental biology of these subgroups are mostly lacking.
Recent single-cell atlases of the developing murine cerebellum provide an unprecedented opportunity for cross-species inference of MB subgroup origins5,6. However, fundamental species-related differences challenge prior insights extrapolated from the mouse7, and the human cerebellar correlates of MB remain unnavigated. Here, we deployed multi-omic mapping of MB subgroups in the context of fetal human cerebellar development (EDF 1a; Supplementary Table 1). Our results align a unified developmental trajectory of the early rhombic lip (RL) with Group 3 and Group 4-MB tumors thereby implicating their common origin in the antero-inferior cerebellar vermis, likely the nodulus. These findings provide normal human developmental context for the molecular signatures, cellular states, biological pathways, and clinical phenotypes of Group 3 and Group 4-MB, resolving a critical knowledge gap that will enhance future modeling and treatment strategies.
Results
Human cerebellar correlates of MB
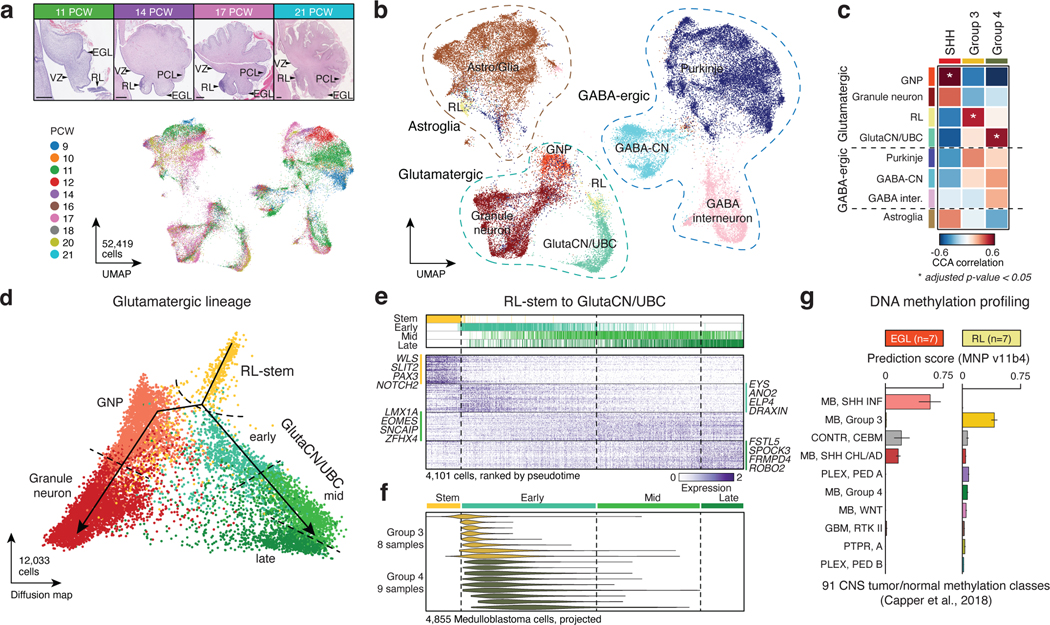
To identify the developmental beginnings of distinct MB subgroups, we leveraged 52,419 single-cells/nuclei from the fetal human cerebellum as a reference transcriptional atlas (9–21 post-conception weeks, PCW; Figure 1a,b; EDF 1b-e; Supplementary Table 2) 8. Since WNT-MBs are believed to arise from mossy fiber neurons of the embryonic dorsal brainstem9,10, we focused our analysis on MB subgroups suspected to be of cerebellar origin (namely SHH, Group 3, and Group 4-MB).
Figure 1. Molecular signatures align Group 3/4-MB with the human fetal RL.
(a,b) UMAP plots summarizing developmental stages (a) and cellular lineages (b) of the fetal human cerebellar atlas. H&E staining images shown in (a) highlight anatomical compartments. Scale bars, 500μm. RL, rhombic lip; VZ, ventricular zone; EGL, external granule layer; PCL, Purkinje cell layer. (c) CCA correlation of bulk MB transcriptomes versus cerebellar lineages. P-values were calculated using a permutation test. (d) Pseudotime diffusion map of glutamatergic lineages and cell states extracted from the human cerebellar atlas. (e) Pseudotime ordering of single-cells derived from the RL-GlutaCN/UBC trajectory according to underlying cell state. (f) Predicted pseudotime ordering of MB single-cells by RL-GlutaCN/UBC cell state. (g) DNA methylation-based classification of micro-dissected human fetal EGL (n=7) and RL (n=7) samples. Error bars represent standard error of the mean.
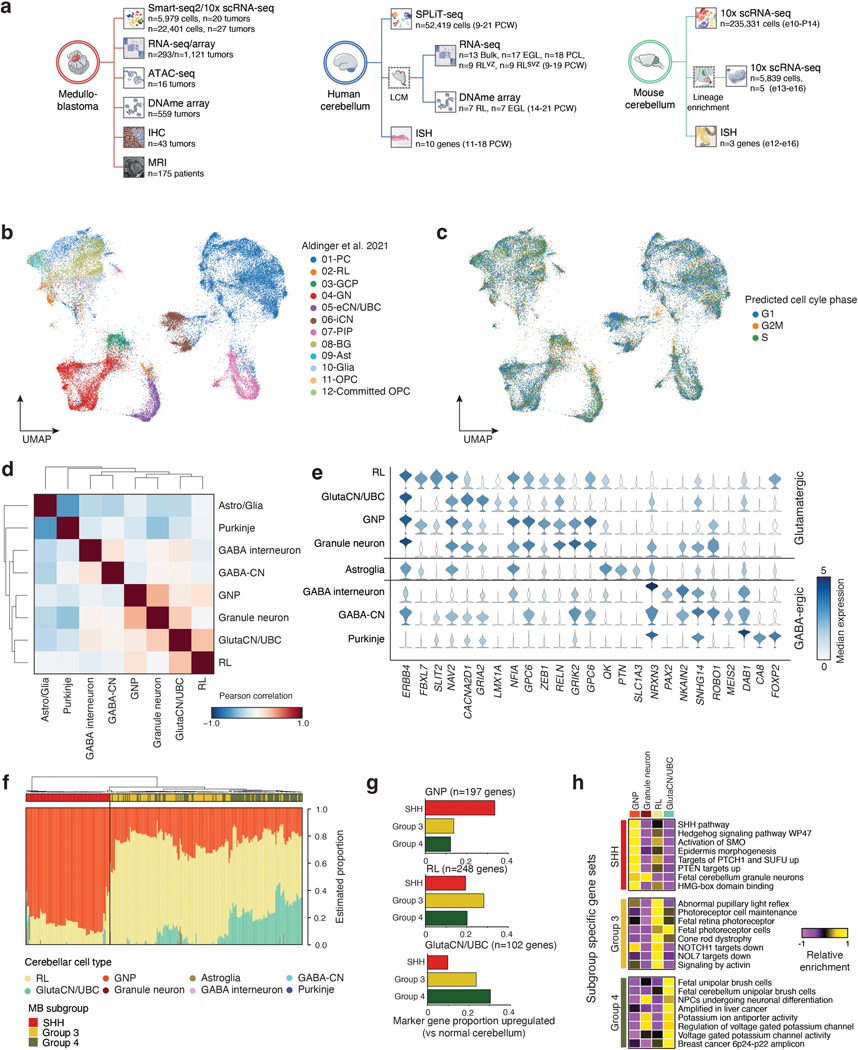
Consistent with prior cross-species analyses5,6, bulk SHH-MB tumors exhibited significant similarity to granule neuron progenitors (GNPs; Figure 1c; EDF 1f; Permutation test, p<0.05). Bulk Group 4-MB tumors aligned to the RL and glutamatergic cerebellar nuclei/unipolar brush cell (GlutaCN/UBC) lineages, the latter of which could not be discriminated (Figure 1b,c; EDF 1f). Notably, Group 3-MB tumors closely aligned with the human fetal RL (Figure 1c; EDF 1f). Genes defining GNP, RL, and GlutaCN/UBC cell types were concordantly up-regulated in the predicted MB subgroup (i.e., GNP signature in the SHH-MB subgroup; EDF 1g). Similarly, gene sets defining SHH-MB were highly enriched in GNPs, whereas Group 3-MB gene sets were enriched in the RL, and Group 4-MB gene sets in GlutaCN/UBCs (EDF 1h; Supplementary Table 3). Concordant gene sets between Group 3-MB and the RL included TGF-beta and Notch signaling, in addition to several retinal and photoreceptor gene sets. In contrast, Group 4-MB and GlutaCN/UBCs concordantly expressed various potassium channel gene sets and those linked to fetal UBCs (EDF 1h).
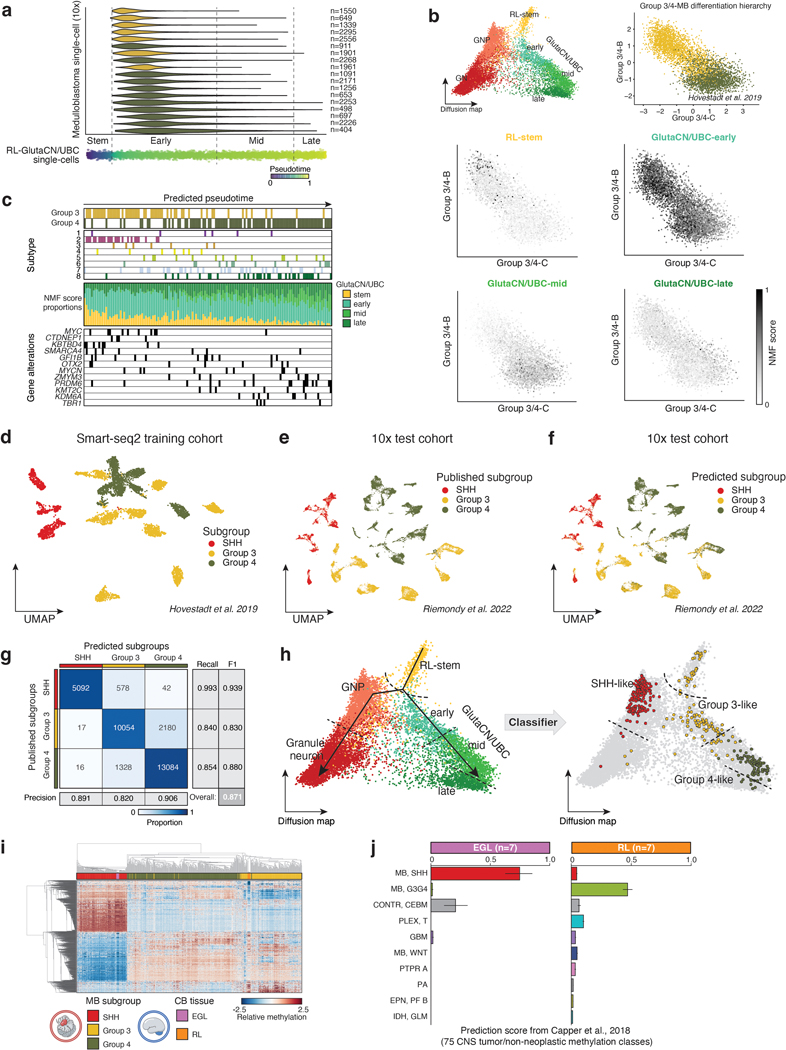
To investigate the putative link between Group 3/4-MB tumors and specific developmental trajectories, we created a diffusion map of glutamatergic lineages extracted from the cerebellar atlas and assigned putative developmental states (Figure 1d,e). Predicted pseudotime, according to GlutaCN/UBC cell states, projected onto Group 3/4-MB single-cells ordered tumors by subgroup (Figure 1f; EDF 2a). Individual MB cells from both subgroups predominantly overlapped the GlutaCN/UBC-early cell state, and a higher proportion of Group 4-MB cells extended into the more differentiated GlutaCN/UBC-mid cell state (Figure 1f; EDF 2a). Projecting the inferred GlutaCN/UBC cell states onto a previously defined differentiation trajectory of Group 3/4-MB single-cells5 revealed that most tumor cells scored highest for the GlutaCN/UBC-early metagene, with a proportion of Group 4-MB cells scoring for the more differentiated GlutaCN/UBC-mid metagene (EDF 2b). Ordering bulk Group 3/4-MB tumors based on predicted GlutaCN/UBC pseudotime also segregated tumors by subgroup, and to some extent, subtype, and genotype (EDF 2c).
Performing the reciprocal analysis, we next classified glutamatergic cerebellar single-cells according to their similarity to MB subgroups (EDF 2d-h). As expected, GNPs best classified as SHH-MB-like cells (EDF 2h). In contrast, early progenitors of the GlutaCN/UBC lineage (i.e., early cell state) predominantly classified as Group 3-MB-like, whereas more differentiated cells of the same trajectory (i.e., mid cell state) classified as Group 4-MB-like (EDF 2h). To further corroborate the relationship between Group 3/4-MB and the human RL-GlutaCN/UBC trajectory, we generated DNA methylation profiles of micro-dissected human fetal RL (n=7) and external granule layer (EGL; n=7) between 14–21 PCW and classified them using a comprehensive CNS tumor database11 (Figure 1g; EDF 2i,j; Supplementary Table 4). During cerebellar development, the EGL is a transitory germinal zone densely populated by proliferating GNPs12. All human fetal EGL samples best classified as infant SHH-MB (Figure 1g). Conversely, all human RL samples were predicted as Group 3-MB, with low prediction scores for Group 4-MB or any other entity (Figure 1g).
Collectively, these findings suggest that Group 3/4-MB tumors, and their constituent single-cells, align with molecular programs encoded within GlutaCN/UBC lineage-committed progenitors of the RL, defined by the extent of their differentiation along this trajectory.
Group 3/4-MB alignment with the RLsvz
During fetal development, the human RL undergoes morphological changes to form a progenitor pool in the base of the posterior lobule of the cerebellar vermis which becomes the nascent nodulus7. Furthermore, the human RL is compartmentalized into anatomically discrete structures separated by a vasculature bed, including a ventricular zone (RLvz) and subventricular zone (RLsvz; Figure 2a). Beginning at 11 PCW, the human RLvz consists of KI67+;SOX2+ cells, whereas the RLsvz is comprised of an expanded KI67+ and largely SOX2-progenitor pool (Figure 2a) 7. To complement the human cerebellar transcriptional atlas, we leveraged bulk RNA-seq datasets derived from micro-dissected fetal human cerebellar sub-compartments7 and defined compartment-specific gene sets (Supplementary Table 5). Quantification of these gene sets in glutamatergic single-cells confirmed enrichment of the RLvz signature in primitive RL cells (i.e., RL-stem cell state), whereas the RLsvz signature was more broadly distributed across transitory progenitors of the RL-GlutaCN/UBC trajectory (i.e., early and mid cell states; Figure 2b).
Figure 2. Conservation of human fetal RLsvz gene signatures in Group 3/4-MB.
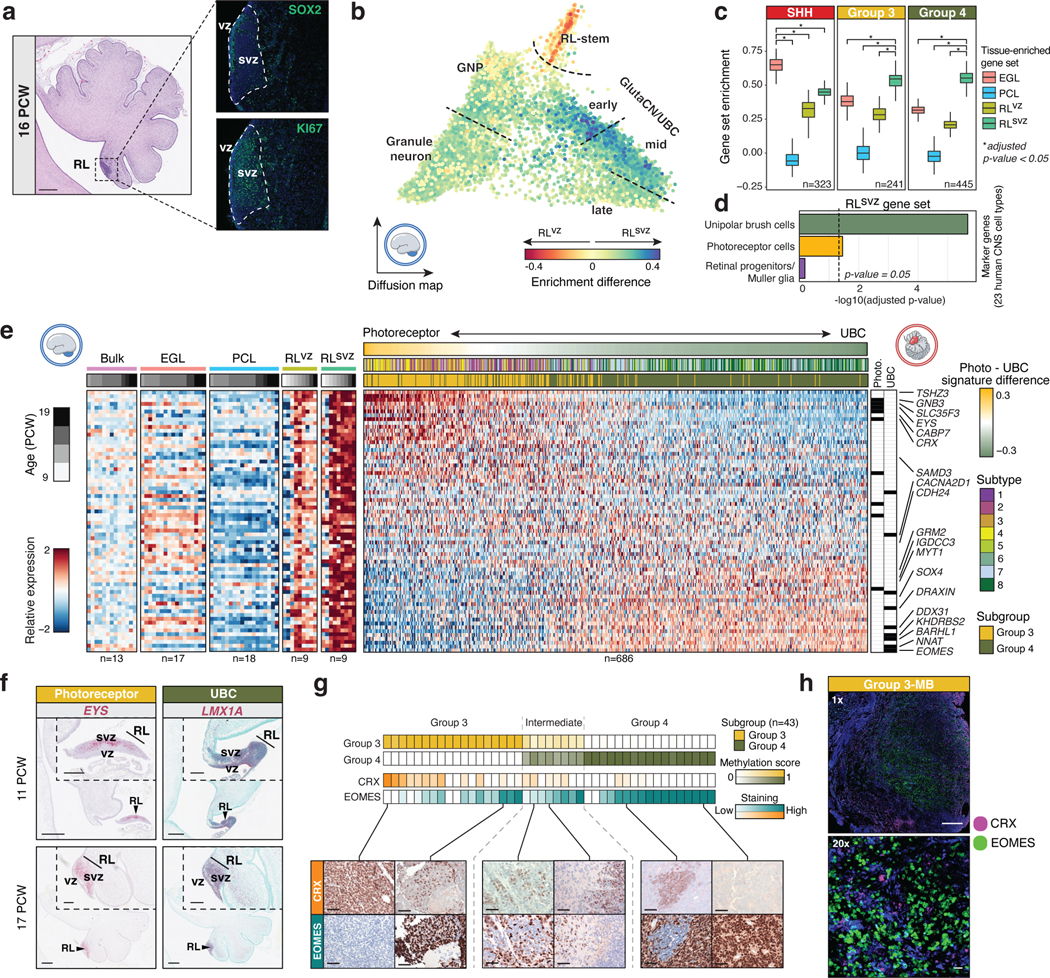
(a) (Left panel) H&E staining of the early (16 PCW) human cerebellum highlighting the densely populated RL. Scale bar, 500μm. (Right panels) SOX2 and KI67 immunostaining illustrate compartmentalization of the human fetal RL. (b) Enrichment of bulk RLvz and RLsvz expression signatures in human cerebellar glutamatergic lineages. (c) Enrichment of cerebellar compartment-specific gene sets by MB subgroup. P-values were calculated using the two-sided Mann–Whitney U-test and were adjusted for multiple comparisons using FDR correction. Boxes represent the median, first and third quartiles, with whiskers extending to 1.5x the interquartile range. (d) Enrichment of the RLsvz gene set in human CNS cell types. P-values were calculated using a one-sided Fisher’s exact test. (e) Expression heatmap of RLsvz marker genes in micro-dissected human cerebellar and Group 3/4-MB samples. (f) ISH of RLsvz-derived photoreceptor (EYS) and UBC (LMX1A) gene set markers in the fetal human cerebellum. Scale bars, 500μm and 200μm (inset). (g) IHC of CRX and EOMES in a series of Group 3/4-MB tumors (n=43). Scale bars, 40μm. (h) Dual immunofluorescence imaging of CRX and EOMES expression in a Group 3-MB. Scale bars, 1mm (upper panel) and 20μm (lower panel).
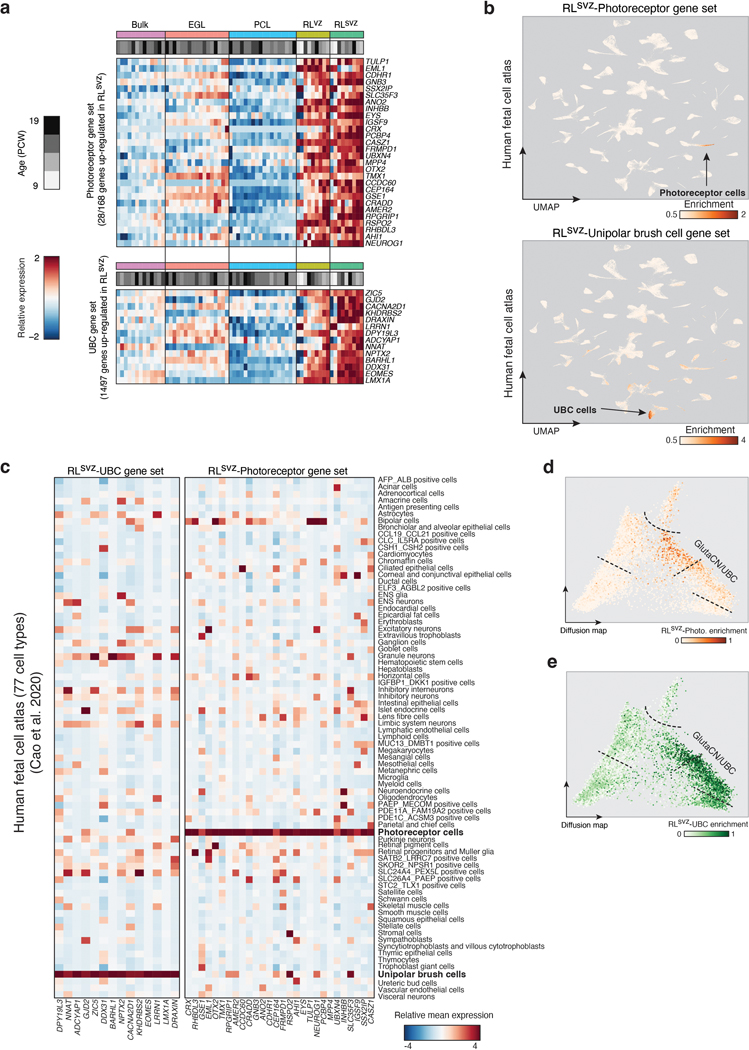
Analysis of compartment-specific gene sets in bulk MB expression profiles (n=1,009) confirmed significant enrichment of the EGL expression signature in SHH-MB, and comparable enrichment of the RLsvz signature, but not the RLvz, in both Group 3 and Group 4-MB (adjusted p<0.05; Figure 2c). Querying the same compartment-specific gene sets against a human fetal reference atlas13, including 23 different CNS cell types, identified significant enrichment of UBC and photoreceptor expression signatures within the RLsvz (adjusted p<0.05; Figure 2d; EDF 3a-c; Supplementary Table 6). Enrichment of the UBC signature within the RLsvz is consistent with the established trajectory of UBCs arising from the RL14–16. However, identification of a photoreceptor signature typically associated with the retina (EDF 3b,c), was unexpected. Quantification of RLsvz-filtered photoreceptor and UBC gene signatures within cerebellar glutamatergic trajectories corroborated their enrichment at largely discrete positions (EDF 3d,e).
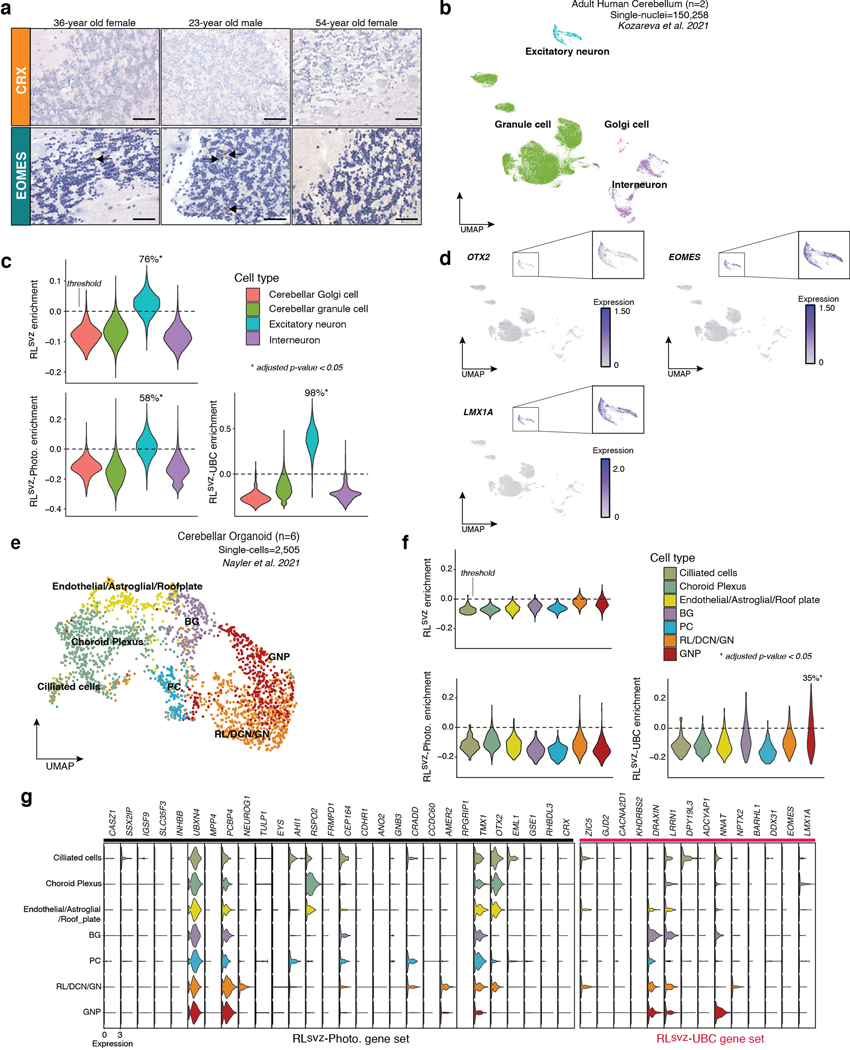
To determine whether RLsvz-derived photoreceptor and UBC gene signatures are developmentally restricted, we stained a limited series of adult cerebellar sections (n=3 donors; 2 sections/donor/antibody) for CRX (photoreceptor marker17) and EOMES (UBC marker14). These sections were negative for CRX and exhibited rare EOMES positivity (EDF 4a). Interrogation of an adult human cerebellar atlas (>150,000 single-nuclei) 18 revealed significant enrichment of the RLsvz, UBC, and photoreceptor signatures (adjusted p<0.05; 76%, 98%, and 58% of cells, respectively) in EOMES+;LMX1A+ excitatory neurons (i.e., UBCs; EDF 4b-d). Attempts to further corroborate these signatures in single-cells derived from human cerebellar organoids19 revealed no enrichment of the RLsvz-photoreceptor gene set, and modest enrichment of the UBC gene set (35% of cells) in GNPs (EDF 4e-g).
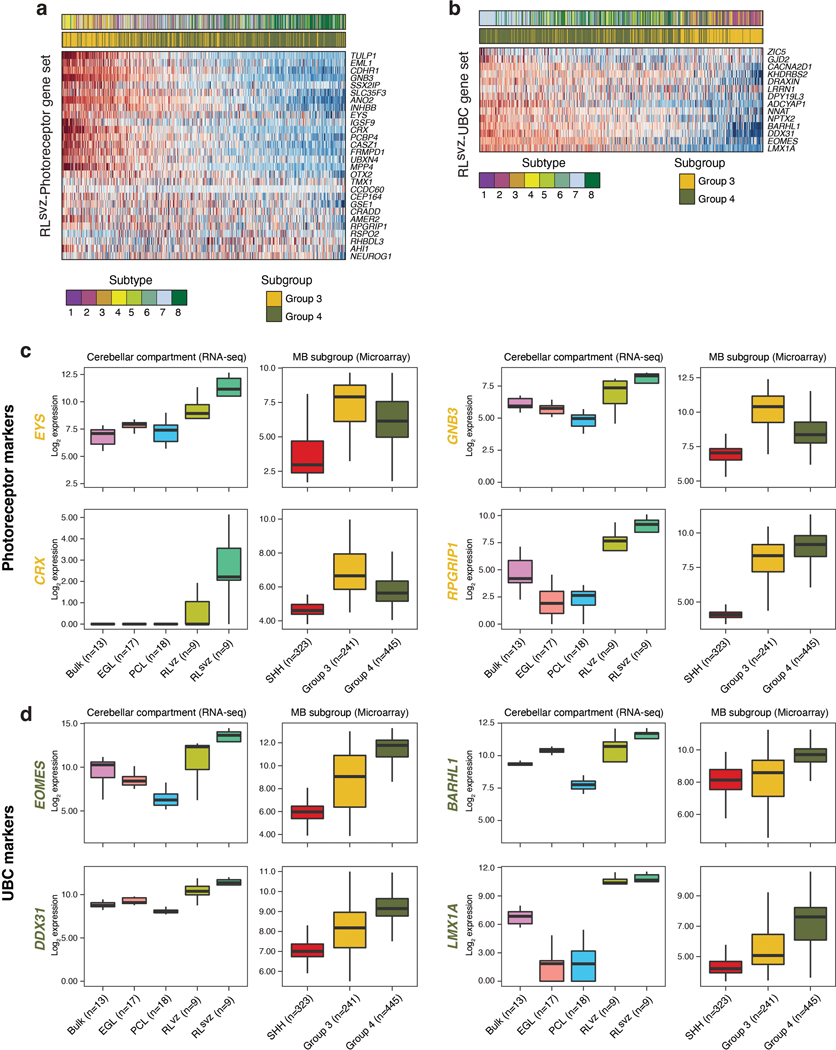
Subtypes of Group 3-MB express markers associated with photoreceptor identity20–23; however, etiology of this expression program is poorly understood. Photoreceptor and UBC gene signatures were highly expressed in Group 3 and Group 4-MB, respectively (EDF 5a,b). To further enlighten Group 3/4-MB origins in the context of the RLsvz, we investigated discriminatory marker genes in a large series of patient tumors (n=686; Figure 2e). Expression of RLsvz-photoreceptor and UBC markers broadly separated Group 3/4-MB subgroups and ordered their underlying molecular subtypes along a continuum24,25 (Figure 2e; EDF 5a,b).
Exemplary RLsvz genes highly expressed in Group 3-MB included numerous canonical photoreceptor markers, such as EYS, GNB3, CRX, and RPGRIP1 (Figure 2e; EDF 5c). Conversely, RLsvz genes expressed highly in Group 4-MB included various UBC markers, such as EOMES, BARHL1, DDX31, and LMX1A (Figure 2e; EDF 5d). In situ hybridization (ISH) validated RLsvz expression of photoreceptor (EYS) and UBC (LMX1A) markers (Figure 2f). To interrogate these signatures in patient tumors, we immunostained CRX and EOMES across a series of 43 MBs. Sorting tumors based on methylation subgroup and immunopositivity for these proteins revealed a relatively continuous expression pattern (Figure 2g). Group 3-MB tumors exhibited high CRX positivity, whereas Group 4-MB tumors were consistently positive for EOMES. Tumors of intermediate classification expressed both markers, yet at reduced levels compared to prototypical CRX+ Group 3 and EOMES+ Group 4-MBs (Figure 2g). Notably, double-positive tumors exhibited mutually exclusive expression (Figure 2g,h), indicating that these tumors are characterized by both photoreceptor-like and UBC-like expression profiles.
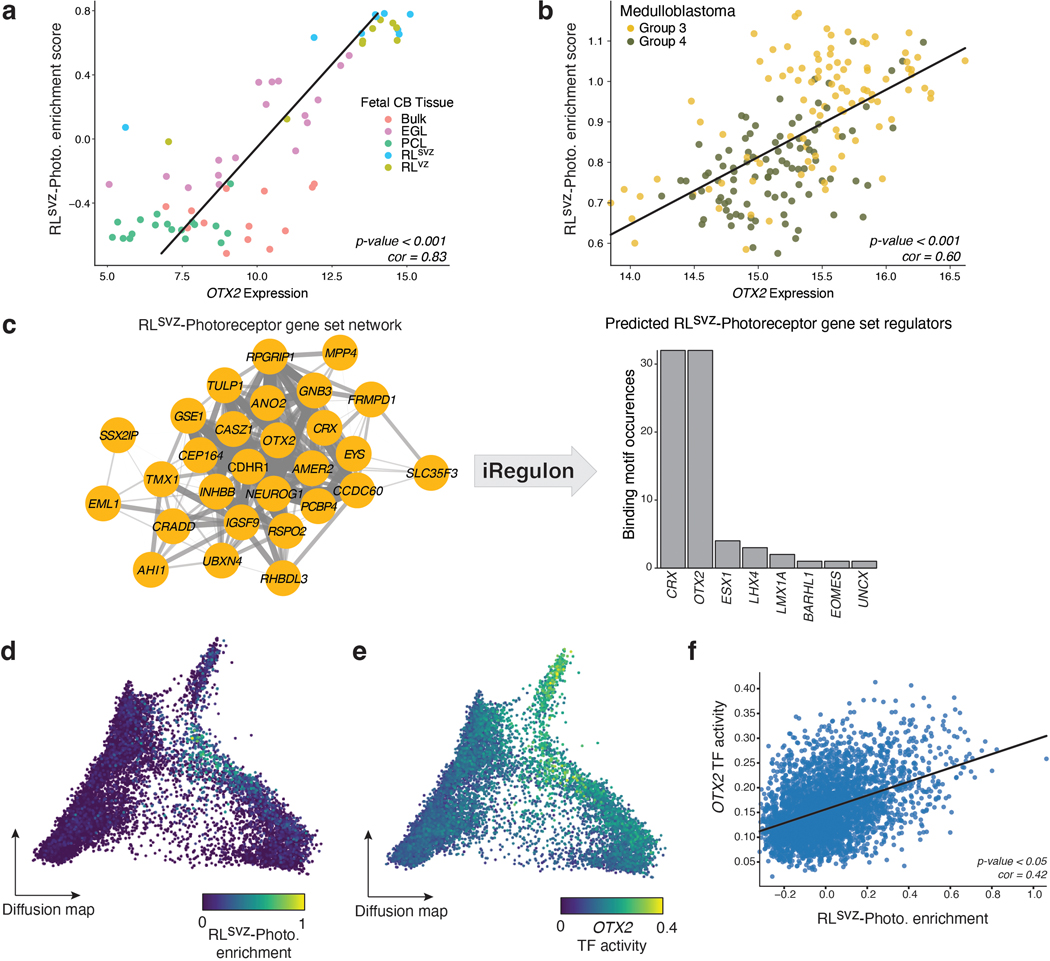
Prior studies have established that master transcription factors (TFs) of photoreceptor identity (i.e., NRL, CRX, and OTX2) are highly active in Group 3-MB26, and that this identity is required for tumor maintenance in MB cell lines and xenografts21. In both the fetal human cerebellum and MB, we observed significant correlation between OTX2 expression and the RLsvz-photoreceptor signature (Pearson correlation=0.83 and 0.60, respectively; EDF 6a,b). iRegulon analysis identified enrichment of OTX2 and CRX binding motifs in gene promoters linked to the RLsvz-photoreceptor gene set (EDF 6c). Single-cell regulatory network analysis applied to the RL-GlutaCN/UBC trajectory confirmed significant correlation between OTX2 TF activity and expression of the photoreceptor gene set in the developmental setting (Pearson correlation=0.42; EDF 6d-f).
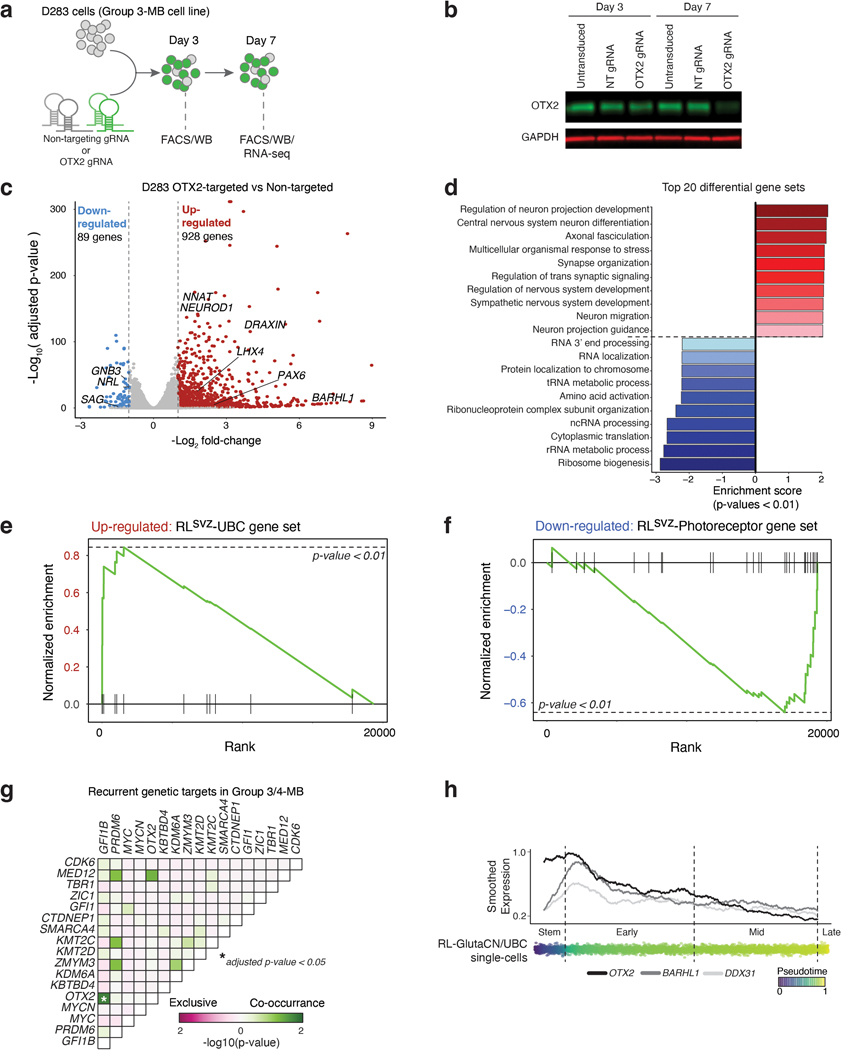
To confirm the requirement of OTX2 in maintenance of photoreceptor identity in Group 3-MB cells, we used CRISPR/Cas9 gene editing to inhibit endogenous OTX2 and performed RNA-seq analysis (EDF 7a,b). OTX2-edited cells exhibited significant up-regulation of several neuronal differentiation gene sets and downregulation of RNA processing and translation gene sets (EDF 7c,d). The RLsvz-derived UBC gene set was upregulated in the context of OTX2 inactivation, whereas the photoreceptor signature was attenuated (EDF 7e,f). These findings, contextualized with prior literature21,27, reinforce an essential role for OTX2 in maintenance of the photoreceptor signature, and inhibition of glutamatergic neuronal differentiation in MB.
Collectively, these results support a model that bridges expression phenotypes characteristic of Group 3/4-MB tumors to a common lineage trajectory within the RLsvz of the developing human cerebellum.
Somatic alterations expose MB origins
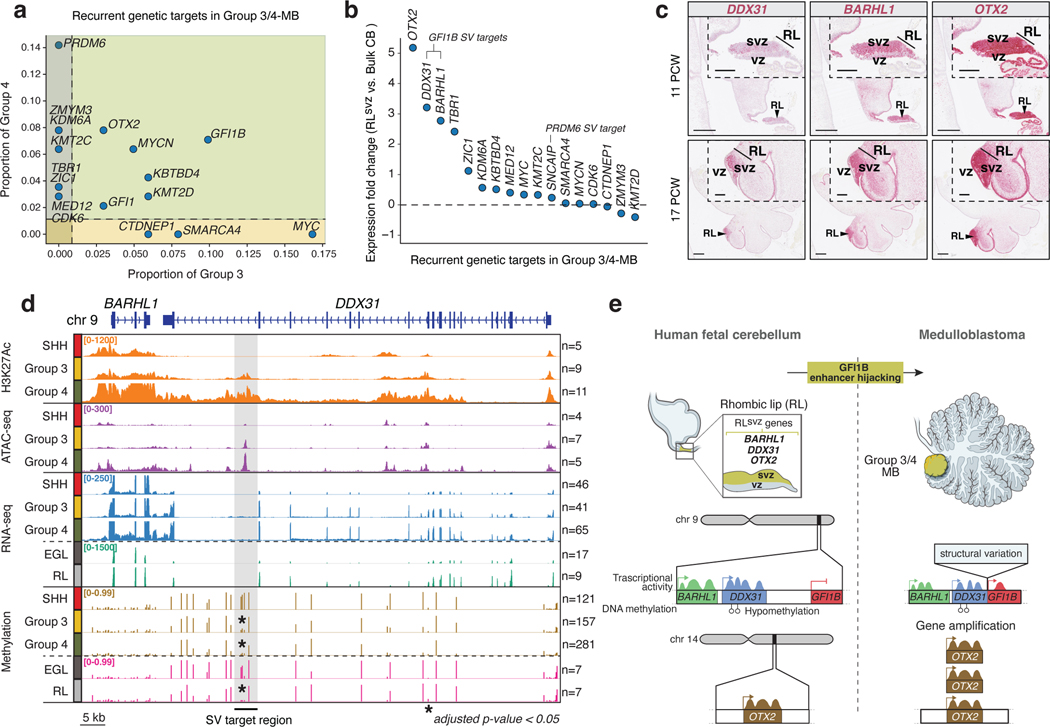
Recurrent mutations targeting developmentally-regulated genes is a prevailing theme in the pathobiology of most pediatric cancers4,28,29. With this principle in mind, we postulated that if Group 3/4-MBs originate from a common lineage trajectory of the RLsvz, that recurrent genetic targets in these subgroups should be specifically active within this cerebellar sub-compartment. To investigate this concept, we revisited recurrent somatic alterations annotated in a large compendium of Group 3/4-MBs (n=324) 24. Although most driver alterations are subgroup-restricted, a subset of genes are impacted at comparable frequencies in both subgroups, including prominent GFI1B enhancer hijacking (Figure 3a). GFI1B enhancer hijacking is linked to structural variants (SVs) targeting highly active enhancers/super-enhancers overlapping the BARHL1/DDX31 locus on chr9q3430. Among driver events contributing to both subgroups, only GFI1B and OTX2 alterations were significantly coincident in the same tumors (adjusted p<0.05, Fisher’s exact test; EDF 7g). OTX2, DDX31, and BARHL1 ranked as the most highly expressed Group 3/4-MB-associated genes in the RLsvz (Figure 3b), exhibiting overlapping expression patterns along the RL-GlutaCN/UBC trajectory (EDF 7h). ISH analysis confirmed highly specific expression of BARHL1 and DDX31 in the RLsvz, whereas OTX2 is known to be expressed throughout RL sub-compartments (Figure 3c) 7.
Figure 3. Genetic targeting of RLsvz markers in Group 3/4-MB.
(a) Incidence and distribution of MB-associated driver gene alterations in Group 3/4-MB. (b) Expression fold-change of Group 3/4-MB genetic targets in human fetal RLsvz versus bulk cerebellum. (c) ISH confirmation of spatially restricted DDX31, BARHL1, and OTX2 expression in the RL. Scale bars, 500μm and 200μm (inset). (d) Chromatin, transcriptional, and DNA methylation signatures at the BARHL1/DDX31 locus in MB and fetal human cerebellum. Shaded region indicates the minimal SV target region associated with GFI1B enhancer hijacking. Asterisks indicate differential DNA methylation patterns within the SV target region. P-values were calculated using a permutation test. (e) Proposed model of the epigenetic and transcriptional determinants associated with GFI1B enhancer hijacking in the RLsvz.
Since the BARHL1/DDX31 locus is hijacked at similar frequencies in Group 3/4-MB, and our finding that both genes exhibit comparable expression patterns in the RLsvz, we hypothesized that multi-omic evaluation of this locus in MB tumors and human fetal cerebellar sub-compartments would further substantiate the putative RL origins of Group 3/4-MB. Summarization of enhancers (i.e., H3K27ac ChIP-seq), open chromatin (i.e., ATAC-seq), gene expression (i.e., RNA-seq), and DNA methylation (i.e., EPIC array) at this locus confirmed the presence of transcriptionally active, accessible chromatin overlapping DDX31 in Group 3/4-MB that was mostly inactive in SHH-MB (Figure 3d). Mining published MB SV datasets24,30 (see Methods) implicated a ~4.6kb window (demarcated in grey shadow) within the terminal intron of DDX31 as the critical SV target region in GFI1B-activated Group 3/4-MB. Close inspection of this locus revealed the presence of a single dominant ATAC-seq peak overlapping a valley of the broader super-enhancer present in Group 3/4-MB (Figure 3d). The presence of CpG sites proximal to this accessible chromatin peak, and within the critical SV target region, facilitated comparative evaluation of DNA methylation states, confirming significant differential methylation between RL and EGL (p=0.045) and Group 3/4-MB and SHH-MB (p<0.001). Notably, SHH-MB tumors and human fetal EGL samples were comparably hypermethylated at these CpG sites, whereas Group 3/4-MB and human fetal RL were concordantly hypomethylated (Figure 3d).
Together, these observations expose a molecular association between Group 3/4-MB and the human fetal RL, linked by the developmental profile of a transcriptionally hyperactive locus that is genetically targeted in tumors (Figure 3e).
Species-specificity of RL signatures
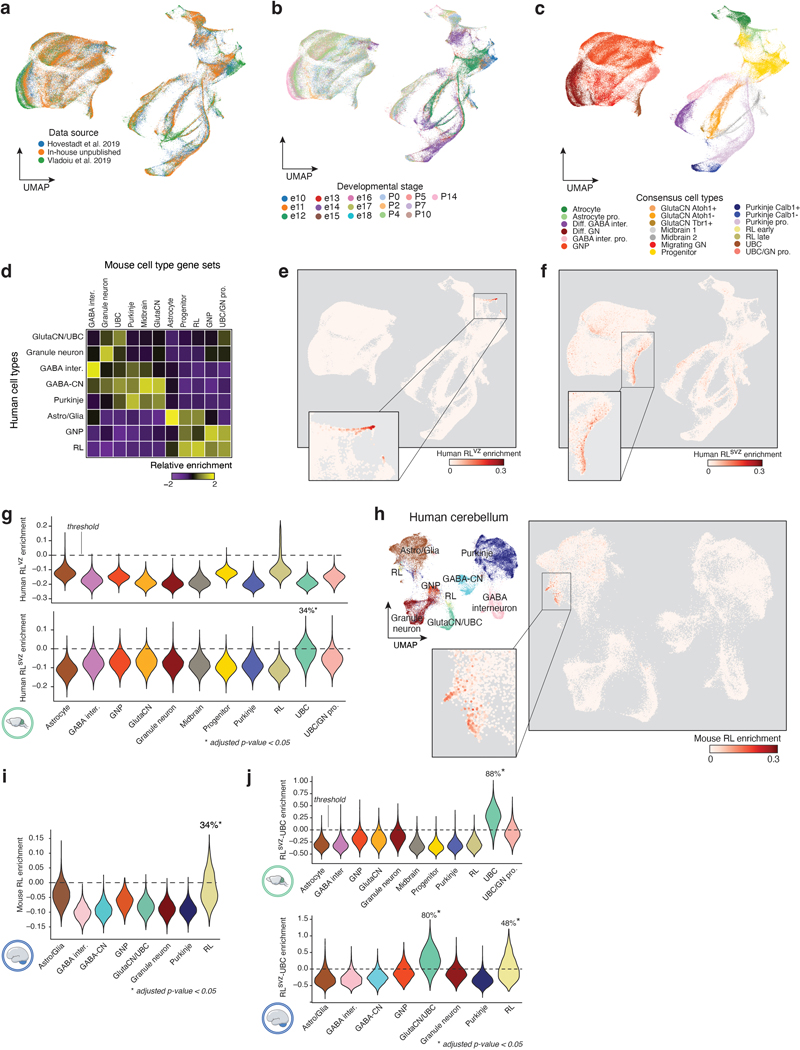
Prior attempts to map developmental origins of MB have relied on cross-species genomics and genetically engineered mouse models5,6,10,31–34. Given our insights aligning Group 3/4-MB tumors to the human RLsvz, we harmonized a large murine cerebellar single-cell atlas (235,331 single-cells; Figure 4a,b; EDF 8a-c; Supplementary Table 7; see Methods) and compared cerebellar cell types between human and mouse (EDF 8d). Quantifying human RLvz and RLsvz gene signatures in the murine cerebellar atlas revealed enrichment of the RLsvz signature in murine UBCs (34% of cells; adjusted p<0.05; EDF 8e-g). Conversely, the murine RL gene signature was enriched in human RL (34% of cells; p-value < 0.05; EDF 8h,i). To determine the status of MB-relevant, RLsvz gene sets in the developing mouse cerebellum, we quantified the RLsvz-photoreceptor and UBC signatures. This approach confirmed significant enrichment of the UBC signature in murine UBCs (Figure 4c; EDF 8j). In contrast, the RLsvz-derived photoreceptor signature lacked enrichment in any murine cerebellar cell type (Figure 4c,d). Collectively, these cross-species analyses demonstrate varying degrees of transcriptional conservation and divergence between human and mouse RL, consistent with prior reports7,8.
Figure 4. Absence of the human RLsvz-photoreceptor signature in murine cerebellum.
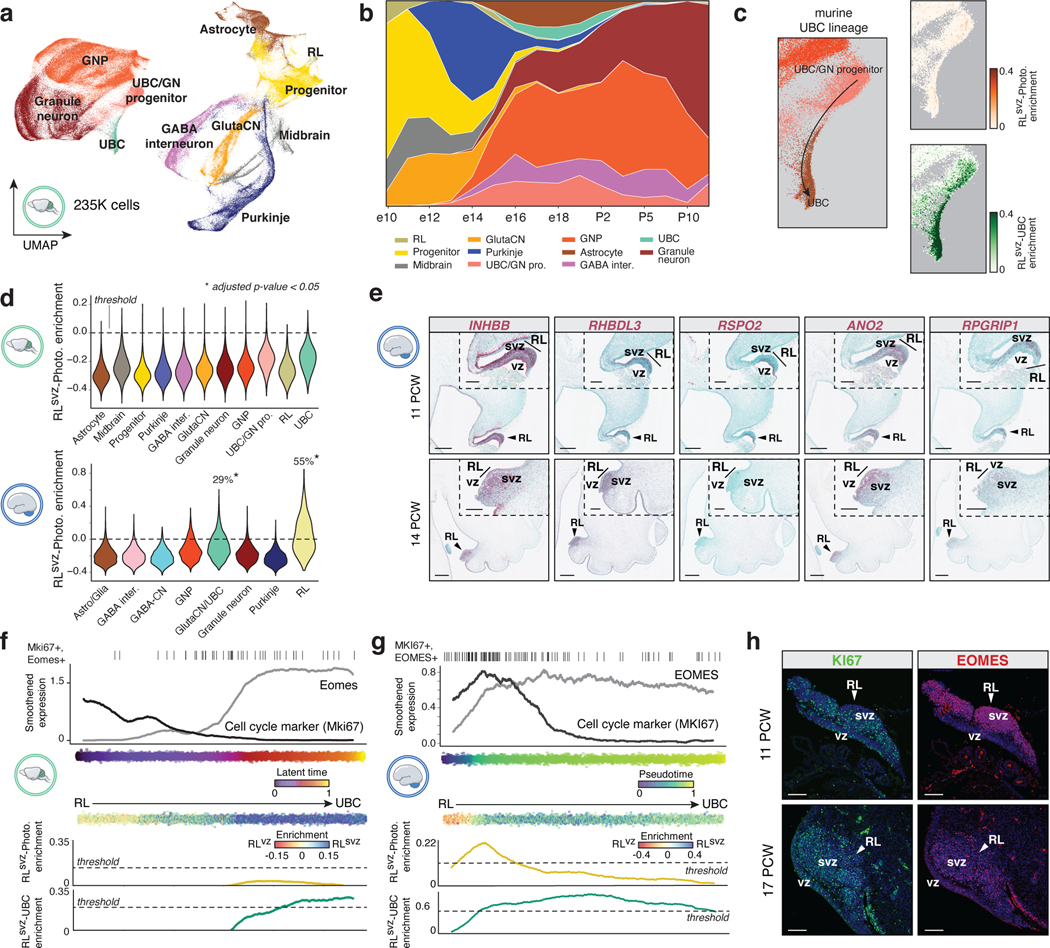
(a) UMAP plot of developing murine cerebellar atlas. (b) Murine cell type proportions across developmental stages. (c) Human RLsvz-derived photoreceptor and UBC gene set quantification in the murine UBC cerebellum. (d) Mouse (upper panel) and human (lower panel) violin plots quantifying enrichment of the RLsvz-photoreceptor signature across cell types. Violin plots extend to the minimum and maximum range of the data. P-values were calculated using a one-sided Mann-Whitney U-test for cell types with more than 25% of cells above the permuted expression threshold. (e) ISH of photoreceptor marker genes in human cerebellum. Scale bars, 500μm and 200μm (inset). (f,g) Eomes/EOMES and Mki67/MKI67 in the mouse (latent time; f) and human (pseudotime; g) RL-UBC trajectories. RLsvz-photoreceptor and UBC gene signatures are quantified along the corresponding trajectories. (h) Immunofluorescence imaging of EOMES and KI67 in human fetal RL. Scale bars, 100μm.
Given the relative alignment of the human RLsvz with murine UBCs, and the rarity of UBCs in the murine cerebellar atlas (Figure 4a,b), we sought to further evaluate the murine RL-UBC lineage trajectory and its potential relevance to MB using a combination of micro-dissection and lineage enrichment strategies (EDF 9a,b see Methods). Latent time analysis established the developmental trajectory from RL progenitors to differentiated UBCs (EDF 9c). Quantification of RLsvz-photoreceptor and UBC gene signatures in this trajectory corroborated findings from the broader murine cerebellar atlas (Figure 4c,d; EDF 8j; EDF 9c). ISH analysis validated RLsvz-photoreceptor markers in the fetal human cerebellum, revealing highly compartmentalized, RL-specific expression of EYS, INHBB, RHBDL3, RSPO2, ANO2, and RPGRIP1 (Figures 2f; 4e). Select photoreceptor genes (Inhbb, Rhbdl3, and Rspo2) were also verified in the developing murine cerebellum, although expression patterns were less specific and robust, especially at later developmental stages (EDF 9d). Transcriptome analysis of a broad selection of published MB mouse models (n=14) indicated an absence of both the photoreceptor and UBC expression signatures (EDF 9e,f).
In mouse, Eomes expression predominantly marks postmitotic, migratory and mature UBCs born out of the RL14. However, in humans, robust EOMES expression is seen in the expanded pool of proliferating RLsvz progenitors, in addition to subsequent, more differentiated UBCs7. To directly evaluate EOMES expression in the context of murine and human RL-UBC trajectories and overlapping gene signatures, we used latent time (mouse) and pseudotime (human) as a proxy of cellular state in both species. Relative to mouse, EOMES expression in humans more broadly overlapped with proliferative KI67+ progenitors, consistent with prior findings7 (Figure 4f-h).
Collectively, these results support a model that implicates cellular vulnerabilities relevant to Group 3/4-MB tumorigenesis within the proliferative human RLsvz that are lacking in mouse.
Diagnosis of Group 3/4-MB in the nodulus
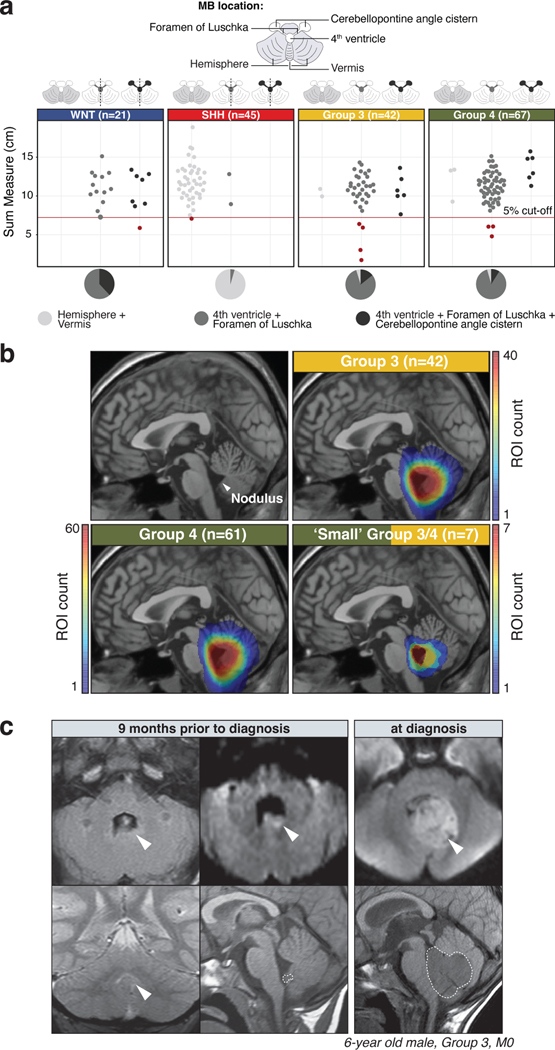
At the time of MRI diagnosis, MB tumors typically occupy a large volume of the posterior fossa. Group 3/4-MB tumors are diagnosed along the midline anterior to the cerebellar vermis and occupy most or the entirety of the 4th ventricle35,36, making it difficult for neuroradiologists to determine their anatomic origin. We hypothesized that ‘small MBs’, captured at an earlier stage in their genesis, might provide important clues into their initiation. To this end, we systematically inferred tumor size and location of an institutional cohort (SJMB0337 and SJYC0738; n=175; Figure 5a; Supplementary Table 8). Consistent with prior reports35,36,39, tumor location was significantly associated with MB subgroup (Fisher’s Exact Test, p<0.05; Supplementary Table 8). SHH-MBs were predominantly localized in the cerebellar hemispheres and vermis, whereas WNT-MBs were found within or near the Foramen of Luschka, including the 4th ventricle or the cerebellopontine angle cistern (Figure 5a). In contrast, Group 3/4-MBs were localized in the midline and expanded into the 4th ventricle (Figure 5a). To focally delineate anatomical origins of MB, we extracted the smallest tumors (≤5th percentile) to analyze their pre- and post-surgical MRIs in more detail (Figure 5a; see Methods), identifying four Group 3, three Group 4, and one each of WNT and SHH-MB. Composite analysis of the combined series of ‘small’ Group 3/4-MB tumors identified a focal region of overlap highlighting the nodulus and 4th ventricle, macroscopically suggesting a shared point of origin (Figure 5b). Included among these cases was a 6-year-old male with Group 3-MB that had incidentally undergone MRI for non-oncological purposes nine months prior to formal diagnosis. Retrospective evaluation of this early MRI revealed a small mass (sum measure=1.73cm) localized completely within the nodulus (Figure 5c). Analysis of additional ‘small’ Group 3/4-MBs identified tumors exhibiting exophytic growth emerging from the nodulus and bulging towards the lumen of the 4th ventricle (EDF 10a,b). In contrast, the anecdotal ‘small’ WNT-MB localized within the cerebellopontine angle cistern, extending towards the lateral recess of the 4th ventricle (EDF 10c). The ‘small’ SHH-MB appeared to originate from the inferomedial cerebellar cortex and grow towards the 4th ventricle (EDF 10d).
Figure 5. MRI mapping of Group 3/4-MB origins in the cerebellum.
(a) Beeswarm plots summarizing the sum measure and tumor location by MRI estimated for an institutional MB cohort (n=175) according to subgroup. Tumors in the lower 5th percentile of the cohort based on size are indicated in red and classified as ‘small’ MBs. Dashed lines indicate lateralization of tumor location50. (b) Composite heatmaps summarizing MRI-based diagnostic location of Group 3 (n=42) and Group 4-MB (n=61). A composite summary of ‘small’ Group 3/4-MB tumors (n=7) is also indicated. (c) Incidental diagnosis of Group 3-MB in the nodulus of a 6-year-old male. White arrows indicate tumor location. Dashed white outline indicates tumor mass in sagittal sections.
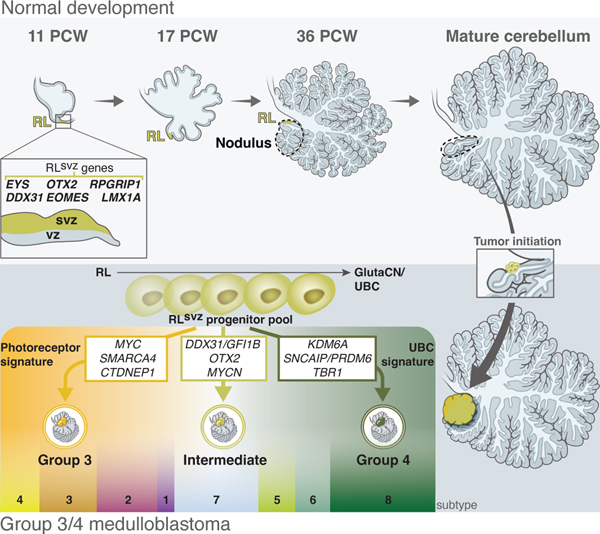
Collectively, these findings substantiate a common anatomic origin of Group 3/4-MB in the nodulus, the cerebellar vermian lobule containing the internalized RL. This is consistent with their characteristic diagnosis in the 4th ventricle and provides a unifying connection to their lineage-of-origin within the RLsvz (Figure 6).
Figure 6. Model summarizing the origins of Group 3/4-MB in the RLsvz and anatomical tumor localization in the nodulus.
Discussion
Solving the etiology of pediatric brain tumors, the leading cause of cancer-related death among children, is an essential step towards development of curative therapies40,41. We provide compelling evidence supporting a unified developmental origin of Group 3 and Group 4-MB, clinically heterogeneous MB subgroups that collectively account for >65% of pediatric diagnoses.
Molecularly, Group 3 and Group 4-MBs can be challenging to discriminate20,22,23, with up to 20% of tumors exhibiting overlapping signatures of both subgroups and designated as ‘intermediate’. In the clinical setting, this ambiguity has posed a significant problem for treating physicians, hampering progress towards more refined risk-stratification, and forcing the amalgamated diagnosis and treatment of non-WNT/non-SHH-MB patients. Recent single-cell genomics studies have begun to provide a cellular composition and cell state-based explanation for ambiguous Group 3 and Group 4-MB5. Herein, we have enhanced this premise in the context of fetal human cerebellar development, implicating a glutamatergic lineage trajectory of the RLsvz as the common origin of Group 3 and Group 4-MB tumors. This advance argues against the recognition of Group 3/4-MB as entirely independent disease entities (based on divergent molecular signatures) 42, while disclosing a developmental foundation that clarifies established molecular, demographic, and clinical overlap.
Although epigenomes and transcriptomes of cancer cells are considered a ‘snapshot’ of their normal developmental context, deregulation of oncogenes and aberrant gene fusions can promote cellular dedifferentiation and activation of tissue-irrelevant or mixed lineage differentiation programs43,44. The origins of the Group 3-MB photoreceptor expression signature have remained unclear for more than a decade20,22,23. We provide the first tangible evidence supporting the activity of photoreceptor-associated developmental genes during the genesis of the human fetal RL. Substantiated by the expression of well-defined photoreceptor identity genes, our results identify a molecular bridge between discriminatory expression signatures of Group 3-MB and the human fetal RLsvz. The precise role(s) of these signature genes during human cerebellar development remains to be defined, although developmental control genes can function across multiple distinct lineages and tissues.
Numerous MYC/MYCN-driven mouse models of Group 3-MB have been reported, providing insights into molecular and biological mechanisms driving tumorigenesis and serving as a basis for preclinical studies45,46. These models have been derived in multiple cellular contexts, including Atoh1+ GNPs32, CD133+ neural stem cells30,33, and Sox2+ astrocyte progenitors47, suggesting that the oncogenicity of certain MB drivers (i.e., MYC, GFI1, GFI1B) is not universally restricted by cell type or cell state48. However, MYC amplifications are largely confined to Group 3-MB, and GFI1B enhancer hijacking has not been reported outside of Group 3/4-MB, indicating that lineage-of-origin plays a fundamental role in MB etiology. In the case of GFI1B-activated MB, our findings propose that prerequisite epigenetic and transcriptional states render human fetal RL progenitors vulnerable to developing this MB subtype. Conversely, GNPs of the EGL that lack these molecular features are likely insensitive or intolerant to the SVs underlying GFI1B enhancer hijacking.
Effective molecularly guided therapies for Group 3/4-MB are largely non-existent, necessitating the generation of a more diverse spectrum of models for drug discovery. In this study, we demonstrate critical species-specific differences between mouse and human RL development that explain prior challenges encountered modeling these aggressive MB subgroups and suggest that the mouse lacks developmental prerequisites required for model generation. Indeed, despite concerted efforts, genetically and phenotypically faithful murine models of Group 4-MB are non-existent. Our deep molecular characterization of the developing human RL, and more specifically the RLsvz, identified a proliferative glutamatergic trajectory towards the UBC lineage that mirrored the continuous differentiation path shared by Group 3 and Group 4-MB tumors5. This contrasts with prior cross-species reports, including our own, that implicated more differentiated UBC and glutamatergic cerebellar nuclei as putative origins of Group 4-MB5,6,26. It is imperative to recognize that mouse and human RL populations are both anatomically and molecularly distinct7. Together, our insights into RL development demonstrate the disease relevance of human-specific progenitors in the RL, identify shortcomings of current murine MB models, and provide directionality for manipulating putative drivers of Group 3/4-MB in the murine RL-UBC trajectory using lineage-specific targeting strategies. Additionally, future advances in cerebellar organoid differentiation protocols that promote the generation of the RL-UBC lineage, akin to methods that have been developed for enhancing production of the granule neuron lineage49, may provide an avenue for modeling Group 3/4-MB in the context of human cells.
Systematic anatomical localization of a large institutional cohort of Group 3/4-MB tumors narrowed a common concentric region of interest within the cerebellum pinpointing the nodulus that was further supported by focused analysis of ‘small’ MBs. During late fetal and early postnatal cerebellar development in humans, the RL is internalized into the nodulus7, providing anatomical support for our conclusion that progenitors in the human RLsvz are central to the origin of Group 3/4-MB tumors. Our fine mapping of Group 3/4-MB origins to the nodulus in the current study will provide treating neurosurgeons and radiation oncologists with an opportunity to enhance the precision of intervention focusing on the point of tumor origin, reducing inadvertent collateral damage to neighboring normal tissues.
In conclusion, we define a unified lineage-of-origin for Group 3/4-MB within the human fetal RLsvz that explains their underlying molecular signatures, biological and clinical overlap, and anatomic site of diagnosis. These advances profoundly enhance our understanding of the developmental basis underlying prominent, poorly understood subgroups of childhood brain tumors, replacing the longstanding notion that Group 3 and Group 4-MB tumors represent entirely distinct disease entities with their more accurate definition as a continuous spectrum of developmentally linked subtypes2,25. Finally, this study emphasizes the importance of studying the origins of childhood cancer in human developmental contexts and will serve as a methodological framework for solving the origins of other pediatric and adult malignancies.
Methods
Tissue sample collection and dissociation
Murine candidate populations
To lineage trace unipolar brush cells in the developing mouse cerebellum, EomesCreER mice were crossed with tdTomato (tdT) mice. EomesCreER;tdT males were then crossed with CD1 females. To isolate UBCs, tamoxifen was administrated to the pregnant female crossed with a EomesCreER;tdT male by oral gavage (0.1 mg/g body weight) at e14.5 when UBCs emerge5 and the embryos were collected at e16.5.
For the micro-dissection of the rhombic lip, the brains of e13.5 and e14.5 embryos (on a mixed genetic background comprising C57Bl6 and CD1) were dissected and embedded into 4 % low-melting agarose prepared in Hanks’ BSS (1X). The embedded brains were sectioned sagitally into 400 μm thick slices using a Leica VT1000S vibratome. The rhombic lip was, then, micro-dissected under the Olympus Microscope SZX9. A total number of four slices were micro-dissected per embryo and four to six embryos were combined per experiment.
Cerebella and micro-dissected rhombic lip were dissociated for 10–20 min at 37 °C in papain solution (10 units/ml, Worthington, LS003126) containing N-acetyl-L-cysteine (160 μg/ml, Sigma-Aldrich, A9165) and DNase I (12 μg/ml, Sigma-Aldrich, DN25) and rinsed in Neurobasal medium.
Patient derived xenografts (PDX)
PDXs were acquired from R. Wechsler-Reya (Sanford Burnham Prebys Medical Discovery Institute), X.-N. Li (Baylor College of Medicine) and the Brain Tumour Resource Laboratory (https://www.btrl.org). Informed consent was obtained at each contributing institution prior to generation of PDX models. Each PDX was injected into the cerebellum of NSG mice which were observed daily and euthanized when signs of sickness, including lethargy and neurological abnormalities, appeared. All clinical signs at the time of euthanasia did not exceed humane endpoint as determined by our Institutional Animal Care and Use Committee (IACUC) approved protocol. Low passage PDXs (<10) were dissected, pre-cut, and dissociated for 30 min at 37 °C in papain solution (10 units/ml, Worthington, LS003126) containing N-acetyl-L-cysteine (160 μg/ml, Sigma-Aldrich, A9165) and DNase I (12 μg/ml, Sigma-Aldrich, DN25), rinsed in Neurobasal medium and filtered using a 40-μm strainer.
Mice were housed with a 12-hour light/dark cycle set with lights on from 6 AM to 6 PM, with room temperature kept between 21–23°C, and humidity between 30–80%. Temperature and humidity were continuously controlled and monitored. The experiments were conducted in accordance with the National Institute of Health’s Guide for the Care and Use of Laboratory Animals and according to the guidelines established by the St. Jude Children’s Research Hospital Institutional Animal Care and Use Committee (IACUC; Animal Assurance Number: A3077–01).
Human tissue collection
Specimens from fetal human cerebellum were obtained from the Birth Defects Research Laboratory at the University of Washington or the Joint MRC/Wellcome Human Developmental Biology Resource (https://www.hdbr.org/) with ethics board approval and maternal written consent obtained before specimen collection.
Fluorescence-activated cell sorting
Murine candidate populations
Dissociated cerebella were resuspended in cold 1% bovine serum albumin in phosphate buffered saline (PBS-BSA 1%). Cells were stained with DAPI to verify the viability of the cell suspension. For the lineage tracing experiments, tdTomato-positive and DAPI-negative cells were sorted. For the micro-dissection experiments, DAPI-negative cells were sorted. Sorting was performed with FACSAria Fusion (Becton Dickinson) using 561 nm (tdTomato, 582/15 filter) and 405 nm (DAPI, 450/50 filter) lasers and BD FACSDiva 8.01 software.
PDXs
Dissociated tumor cells from PDXs were resuspended in cold 1% bovine serum albumin in phosphate buffered saline (PBS-BSA 1%). Cells were co-stained with 1 μM calcein AM (Life Technologies, C3100MP) and 0.33 μM TO-PRO-3 iodide (Life Technologies, T3605) in PBS-BSA 1%. Sorting was performed with FACSAria Fusion (Becton Dickinson) using 488 nm (calcein AM, 530/30 filter) and 640 nm (TO-PRO-3, 670/30 filter) lasers and BD FACSDiva 8.01 software. Non-stained controls were included with all PDXs.
Murine scRNA-seq data generation and processing
Single cells from developing mouse cerebellar tissue were processed using the microfluidics-based 10x Chromium protocol, as previously described. Single cells were processed using the Chromium v3 and v.3.1 Single Cell 3′ Library and Gel Bead Kit according to the manufacturers’ protocol. Quantification and quality checks for the libraries were performed using an Agilent Technologies high sensitivity DNA 1000 chip. Libraries were sequenced on a NovaSeq 6000 (Illumina).
An aggregate developing mouse cerebellum atlas was derived from the combination of two previous published datasets5,6 and a newly created in-house dataset. We extracted reads from bam files and re-aligned all datasets using cellranger (v4), thereby removing technical effects between datasets caused by differences in their original alignment pipelines. Furthermore, gene-level batch effects due to 10x platform were regressed out from the normalized data using ComBat and UMAP-level batch effects corrected for using bbknn prior to downstream clustering and visualization52. Initial cell type annotations were assigned using a combination of approaches including PCA projection, as implemented in Seurat, of parental cerebellar atlas cell types onto the integrated atlas. Unsupervised Leiden clustering and manual curation informed by known lineage markers resulted in final consensus cell type annotations. Harmonization of these datasets produced a combined atlas consisting of ~235,000 cells after QC filtering (min. detection of 500 genes/cell and <10% of reads mapping to mitochondrial genes).
For the murine micro-dissected RL and lineage traced UBC single-cell experiments, single cells were filtered and corrected for batch effect at the UMAP-level using bbknn. RNA-velocity was measured using velocyto and analyzed using the scvelo Python package53,54. Trajectory inference was conducted using a root cell in the RL, latent time was calculated from RNA-velocity. All enrichment scores were calculated using mean expression enrichment as implemented in the scanpy score_genes function using a same length control gene set. For human derived gene sets, gene expression matrices were restricted to the 16,919 high-confidence homologous genes with gene order conservation and whole-genome alignment scores greater than 75%, as defined by Ensembl.
Quantification of gene sets in single nuclei was done using the AddModuleScore function in Seurat55 and/or score_genes function in scanpy56. To establish a threshold for gene set enrichment we randomly created 1,000 gene sets, equal in length to the input gene set, which were each scored to derive a permuted null distribution with the enrichment threshold representing the 95th percentile. This threshold was then subtracted from the enrichment scores for visualization so that all cells above zero represent enriched cells. Any cell type with at least 25% of cells above the enrichment threshold and that had a significant difference from all other cell types based on a Wilcoxon rank-sum test (p-adjusted < 0.05) were considered enriched.
Human scRNA-seq data processing
A previously published SPLiT-seq single-cell human fetal cerebellum atlas was filtered of all non-cerebellar populations and re-clustered8. In order to compensate for the major sequencing batches in the dataset, UMAP-level batch effects were corrected for using bbknn prior to downstream clustering and visualization52. Unsupervised Leiden clustering, previous annotations, and manual curation informed by known lineage markers resulted in final cell type classifications.
The glutamatergic lineages of the cerebellum consisting of RL, GlutaCN/UBC, and Granule neurons were extracted for more in-depth evaluation. Using a single cell in the RL as a root, diffusion mapping and pseudotime analysis was conducted via scanpy56. The resulting graph was using for downstream comparisons and gene set enrichments. All enrichment scores were calculated using mean expression enrichment as implemented in the scanpy score_genes function using a same length control gene set. Transcription factor activity was quantified using pySCENIC.
Comparison of human scRNA-seq and MB bulk RNA-seq
For CCA, the first 25 canonical correlation vectors were calculated to project each expression matrix into the maximally correlated subspace, as previously implemented5. The analysis was run after regressing out individual-specific effects in the single-cell and bulk data, then centering both datasets. Significance is assessed by 10,000 permutations, followed by FDR correction.
Estimation of cell type proportions within bulk expression profiles was conducted using a deconvolution approach as implemented in MuSiC57. MB bulk RNA-seq Combat-seq batch corrected counts and human fetal cerebellum raw counts were used as inputs.
To determine molecular signatures driving the similarities between MB-subgroups and putative cell types of origin, we first quantified MB bulk RNA-seq expression profiles into gene set space using ssGSEA. Gene sets were obtained from the following MSigDB gene set collections: hallmark, curated, ontology, oncogenic signatures, and cell type signatures; gene sets were excluded if they had less than 12 genes or more than 400 genes58. We trained a random forest classification model to predict MB-subgroup from gene set enrichment profiles to identify subgroup-specific gene sets based on a Gini coefficient greater than 0.0005 for a subgroup and a greater median enrichment score compared to other subgroups. Gene sets were then sorted based on the difference in normalized enrichment scores between putative cell-of-origin vs other cell types for each subgroup (i.e., GNP vs other for SHH), we selected 8 representative gene sets for each subgroup to visualize, with the full list shown in (Supplementary Table 3).
Comparison of human scRNA-seq and MB scRNA-seq
To train a neural network to classify individual non-tumor cells according to MB subgroup, first we harmonized all gene names and removed cell cycle associated, ribosome, and mitochondrial genes. Additionally, we restricted our feature space to highly variable genes determined from the normalized counts of the human glutamatergic SPLiT-seq dataset. Biases in gene count and mitochondrial read proportion were regressed out in each independent dataset and then scaled using the robust scaler provided by scikit-learn. Next, the multi-layer perceptron (MLP) classifier, from the scikit-learn Python package, was initialized with a hidden layer size of 500 and L2 penalty of 0.01. The MLP classifier was trained on the Smart-seq2 MB cohort5 and tested on the 10x MB cohort51. Classifier benchmarking metrics such as precision, recall, and F score were calculated on the test dataset. Finally, cells of the human glutamatergic lineage were classified as SHH, Group 3, or Group 4 if the associated prediction probability was above 0.95.
Conversely, we utilized a combination of Non-negative Matrix Factorization (NMF) projection and linear regression of predict cerebellar pseudotime of single-cell MB samples. Metagenes that discriminate cellular states of the glutamaterigic lineages were quantified by NMF, as implemented in scikit-learn, with the number of components determined by cophenetic correlation. Identified metagenes were projected onto the MB single-cells as previously published. Resulting metagene scores were used to train a linear regression model to predict pseudotime across the human RL-GlutaCN/UBC trajectory. The same regression model was used to predict pseudotime of the MB single-cells.
Human Fetal Cerebellum RNA-seq gene set analysis
Raw gene counts from micro-dissected cerebellum profiled by RNA-seq was obtained from a published series of human fetal samples7. We first defined tissue-enriched gene sets for the EGL, PCL, RLvz and RLsvz by using DESeq2 (R package, v.1.32.0) for differential expression of each tissue compared to bulk cerebellum (adjusted P < 0.01, Log2 Fold-change > 1) 59. To derive unique tissue-specific gene sets we filtered the tissue enriched gene sets by excluding genes present in multiple tissue gene sets and not present in the bulk MB microarray dataset. To make each tissue-specific gene set comparable size for gene set enrichment analysis, we filtered each gene set to be at most 150 genes by selecting genes with the highest fold-change compared to bulk cerebellum. Single-sample gene set enrichment analysis (ssGSEA) was performed, using GSVA (R package, v.1.40.1), in our bulk MB microarray dataset to derive normalized enrichment scores for each gene set which were evaluated for significance within each subgroup using a Mann Whitney U-test (adjusted p-value < 0.05) 60. The RLsvz specific gene set was then functionally annotated against 23 gene sets representing CNS cell type markers from a reference human single-cell atlas13 using a Fischer’s exact test (adjusted p-value < 0.05).
To select discriminatory genes from the RLsvz to visualize in a heatmap we filtered the RLsvz enriched gene set to exclude genes up-regulated in 3 or more different tissue gene sets (relative to bulk CB), then selected genes which had the highest median expression in the RLsvz and had a fold-change greater than 1.5 compared to the RLvz. We visualized these genes in both the human fetal micro-dissected cerebellum RNA-seq and Group 3/4-MB microarray datasets, with genes being sorted based on the mean expression difference between Group-3 and Group 4-MB. Human CB samples were primarily sorted by tissue type and then age in post-conception weeks. Using the photoreceptor and unipolar brush cell gene sets identified previously, we scored enrichment of these two gene sets within each MB tumor using ssGSEA, then used the difference between the two signatures to sort Group 3/4-MB tumors.
Human Adult Cerebellum snRNA-seq
Adult human single-nuclei RNA-seq for two donors was obtained from the following study (accession number: GSE165371) as a gene count matrix with previously defined cell type labels18. Gene count matrices were filtered to require nuclei to have greater than 500 genes expressed, less than 8,000 genes expressed and less than 20% of reads mapping to mitochondrial genes, which were then pre-processed using the standard Seurat workflow55. Enrichment scores were calculated using the previously described permutation thresholding.
Human cerebellum organoid 10X Genomics single-cell RNA-sequencing data
10X Genomics scRNA-seq data from published19 human cerebellum organoids was downloaded from GEO (GSE150153). Six organoids were pooled and processed using Seurat workflow (v4.1.0) 61. Cell cycle and mitochondrial effects were regressed out. Two batches (GSM4524697 and GSM4524699) were integrated using Harmony (v0.1.0) 62. Markers for each cluster were defined by Seurat function FindAllMarkers. Cell types were characterized by comparing cluster-specific markers to the annotations used in the original publication19. Quantification of gene sets in organoids was done using the same method as described in human adult cerebellum snRNA-seq.
OTX2-targeting in D283 MB-cells
D283 cells (ATCC, HTB-185) were infected with GFP expressing lentiviruses encoding either non-targeting control gRNA or gRNA targeting OTX2 in triplicate. Aliquots of cells were collected after 4 days culture for western blot to examine OTX2 knockout using antibodies against OTX2 (Proteintech, 13497–1-AP, 1:500) and GAPDH (Santa Cruz, SC365062, 1:200). A small aliquot of cells was also collected for flow cytometry analysis to examine the percentage of GFP+ cells to ensure more than 95% of cells are infected. After 7 days culture, cells were collected for flow cytometry analysis, RNA-seq or western blot. Paired-end stranded RNA-sequencing was performed using three biological replicates for the OTX2-targeted vs non-targeting gRNA controls. Raw FASTQs were aligned to the human genome (hg38) using STAR (23104886) to generate gene count matrices. Differentially expressed genes were identified using DESeq259 (|Log2 fold-change| > 1 & adjusted p-value < 0.05). Differential gene sets were quantified by pre-ranked gene set enrichment analysis (adjusted p-value < 0.01). D283 cells were authenticated by STR profiling in March 2022 and were mycoplasma negative based on routine testing.
Generation and processing of DNA methylation data
Fetal cerebella were embedded in OCT, frozen at −80°C, and cryosectioned at 16-μm in the sagittal plane through the cerebellar vermis onto PEN Membrane Glass Slides (VWR, 76414–898). The section on PEN slide was stained with 1% cresyl violet /100% EtOH before LMD. The LMD was performed using LMD-7000 Laser Microdissection System to capture the rhombic lip and the granule layer regions into separate collection tubes. DNA was then isolated from LCM-enriched samples using the QIAamp DNA Micro Kit (Qiagen, 56304). DNA quality was assessed by running E-Gel EX 2% Agarose (Invitrogen, G401002).
DNAs of LCM-enriched samples were analyzed using Illumina Infinium Methylation EPIC BeadChip arrays according to the manufacturer’s instructions. MB subgroup predictions were obtained from a web-platform for DNA methylation-based classification of central nervous system tumors (www.molecularneuropathology.org, version 11b4) 11. Resulting assignment of samples to WNT, SHH, Group 3 and Group 4 subgroups were used for all downstream analyses. A similar classification system was used for predicting MB subtypes. All downstream analysis were conducted on beta values as calculated by minfi.
ATAC-seq library preparation and sequencing
We used the protocols from Buenrostro et al. 63,64 and Corces et al. 65. 50,000 sorted PDX cells were spun at 400 g for 5 min at 4°C. Cell pellets were resuspended in 50 ul of cold lysis buffer (10 mM Tris-HCl, pH 7.5, 10 mM NaCl, 3mM MgCl2, 0.1% NP-40, 0.1% Tween-20 and 0.01% Digitonin) and incubated on ice for 3 min. 1 mL of wash buffer (10 mM Tris-HCl pH 7.5, 10 mM NaCl, 3mM MgCl2, and 0.1% Tween-20) was added to the suspension and was then spun at 500 g for 10 min at 4°C. The nuclei were then resuspended in the transposition reaction mix, using the Illumina Tagment DNA Enzyme and Buffer Kit (Illumina, 20034197) (25 ul of 2X TD buffer, 5 ul of TDE1 tagment DNA enzyme, 16.5 ul of 1X PBS, 0.1% Tween-20, 0.01% Digitonin and 5ul of nuclease free water). The suspension was incubated for 30 min at 37°C on thermomixer at 1,000 rpm. DNA was then isolated using the Qiagen MinElute kit (Qiagen, 28204). We then amplified the fragments using the NEBNext High-Fidelity 2X PCR master mix (NEB, M0541S) and 1.25 μM of custom Nextera PCR primer63 using the previously described protocol64. Once amplified, the libraries were purified using AMPure XP beads (Beckman Coulter, A63880) and eluted into 20 μL of nuclease-free H2O. Quality checks for the libraries were performed using an Agilent Technologies high sensitivity DNA 1000 chip. Libraries were sequenced on a NovaSeq 6000 (Illumina).
PDX ATAC-seq fastq files were aligned to both the human (GRCh38) and mouse (Mm10) genome using bwa (version 0.7.17) 66. BAM files were sorted using samtools (version 1.9). Reads were then assigned to either the human or mouse genome using disambiguate. Unambiguous reads aligned to human were converted back to fastq files. These reads were then processed using PEPATAC pipeline (http://pepatac.databio.org/).
MB mutation frequencies
Previously published gene alterations of MB were annotated by their occurrence in each subgroup and filtered by their potential driver status. Co-occurrence and mutual exclusivity significance were determined by binarizing gene alterations and fitting a generalized linear model considering age and gender as cofactors as implemented in the bglm R package. All p-values were adjusted for multiple testing correction via FDR.
BARHL1/DDX31 locus analysis
MB structural variation breakpoints, H3K27ac ChIP-seq, and RNA-seq data were generated in our previous studies24,26,30. BAM files were converted to the coverage BigWig files using bamCoverage function in deeptools67. The mean coverage for the samples in each subgroup was calculated using WiggleTools (https://github.com/Ensembl/WiggleTools) and visualized using the Integrated Genome Viewer (IGV) 68. The reference genome used in this analysis was hg19.
Mouse model gene set enrichment analysis
Processed gene expression matrices were obtained from the following published murine mouse model datasets for single-sample gene set enrichment analysis (GSE3319932; GSE11476047, GSE10203769, GSE12340970,GSE6588848, GSE3412633. A list of all mouse models, including mouse ID, genotype, expression platform and proposed class model are shown in (Supplementary Table 1d). All expression matrices were filtered to mouse-human orthologs which were present in all datasets to ensure all murine models were represented by the same genes. Each filtered gene expression matrix was then quantified for gene set enrichment of the photoreceptor and unipolar brush cell gene sets using ssGSEA to derive normalized enrichment scores.
In situ hybridization
In situ hybridization assays were run using commercially available probes from Advanced Cell Diagnostics following manufacturer’s instructions. OTX2 (484581), DDX31 (1083621), BARHL1 (1083611), EYS (1059631), LMX1A (540661), INHBB (435741), RHBDL3 (1159811), RSPO2 (423991), ANO2 (1047461) and RPGRIP1 (1146201) human probes were used. Inhbb (475271), Rhbdl3 (855061) and Rspo2 (402001) murine probes were used.
Immunofluorescence
Sections were subjected to heat mediated antigen retrieval followed by blocking and permeabilization with 5% normal goat serum (Vector laboratories, S-1000) containing 0.35% triton X. Primary antibodies against KI67 (DAKO, M7240, 1:50) and EOMES (Thermofisher, 14–4875-82, 1:250) were incubated overnight at 4ºC. Alexa Fluor 488 and 568 secondary antibodies (A-11001 and A-11004, 1:1000) were used. Sections were counterstained using Vectashield mounting medium containing DAPI (4’,6-diamidino-2-phenylindole, Vector laboratories, H-1200).
All tissue sections used for double immunofluorescence labeling underwent antigen retrieval in a prediluted Cell Conditioning Solution (ULTRA CC1, 950–224, Ventana Medical Systems, Indianapolis, IN) for 32 min before the serial application of the primary antibodies, using the U DISCOVERY 5-Plex IF procedure and the following kits (all from Ventana Medical Systems): ready-to-use DISCOVERY OmniMap anti-Rb HRP (760–4311; single drop per experiment), and visualization of EOMES using a DISCOVERY CY5 Kit (760–238) and CRX using a DISCOVERY FAM Kit (760–243). Coverslips were mounted on slides with Prolong Gold Antifade reagent containing DAPI (Thermo Fisher Scientific, P36935). Fluorescence slide scanning was performed using a Zeiss Axio Scan.Z1 with a Hamamatsu ORCA-Flash4.0 V3 camera using Zeiss ZEN 3.1 software. Images were created with a Zeiss Plan-Apochromat 20X/0.8 objective lens with illumination by HXP 120V metal halide lamp, using matching filters for DAPI, FAM, and Cy5 images (Zeiss filter set 49, Chroma 49308 – ET Green#2 FISH, and Zeiss filter set 50, respectively).
Immunohistochemistry
Immunohistochemistry on human tumor samples was performed using a 1:1000 dilution of anti-CRX (rabbit polyclonal, Biorbyt orb192904) and a 1:100 dilution of anti-EOMES (clone WD1928, Invitrogen 14–4877-82) diluted in Ventana antibody diluent (Roche Tissue Diagnostics, 251–018) and detected using the UltraView DAB (Roche Tissue Diagnostics, 760–500) and BOND Refine Polymer DAB (Leica Biosystems, DS9800) detection kits, respectively. Each target was evaluated using a semiquantitative system to construct a H-score, obtained by multiplying the intensity of the stain (0: no staining; 1: weak staining; 2: moderate staining, and 3: strong staining) by the percentage (0 to 100) of cells showing that staining intensity (H-score range, 0 to 300).
Group 3 and Group 4-MB methylation scores were predicted from Illumina Infinium Methylation EPIC arrays using the Molecular Neuropathology MNP classifier (v11b4) 11. Samples were defined as Group 3/Group 4 intermediates if they had a calibrated classification score greater than 0.2 for both Group 3 and Group 4-MB. Samples were first sorted by methylation subgroup, then by difference between CRX H-score and the EOMES H-score.
Tumor size measurement
MRIs from a series of 175 MB patients were reviewed, including 21 WNT, 45 SHH, 42 Group 3 and 67 Group 4 MB patients. Participants were recruited based on their being treated on St. Jude protocols, having MR imaging, and enrolled on one of two institutional clinical trials (SJMB03, NCT00085202; SJYC07, NCT00602667). The protocols (SJMB03 and SJYC07) were approved by the St. Jude Institutional Review Board and all patients and/or their legal guardians provided written informed consent prior to study entry. For the SJMB03 clinical trial, the enrollment period was between September 2003 and June 2013. Children, adolescents, and young adults were treated according to protocol at eight centers within the United States, Canada, and Australia. For the SJYC07 clinical trial, the enrollment period was between November 2007 and April 2017. Young children were treated according to protocol at six centers within the United States and Australia.
Tumor volume estimates were made based on 3-dimensional measurements using a PACS workstation. For cranio-caudal (c-c) and antero-posterior (a-p) tumor measurements sagittal pre- and/or postcontrast T1-weighted images were used, typically the one in the midline. The c-c diameter was measured parallel to the floor of the 4th ventricle, the a-p diameter perpendicular to that. The largest tumor diameter in the left-right (l-r) direction was measured in transverse images (pre- and/or postcontrast T1-weighted, T2-weighted, T2-weighted FLAIR), choosing the image type that provided the best tumor delineation. Sum Measure was calculated as the sum of c-c, a-p, and l-r with the threshold for ‘small’ MBs represented as the 5th percentile of Sum Measure (7.21 cm).
Heatmap of MB location
MRI images from 103 patients were used in the tumor localization analysis. When available, midsagittal 3D T1 images were used for normalization and segmentation. In the absence of 3D imaging, 2D sagittal images were used. Both pre- and post-contrast images were evaluated, and the image displaying the clearest tumor boundaries was selected for segmentation. Patients were excluded if imaging was of insufficient quality to discern tumor or failed normalization (e.g., digitized films). Images were “brain-extracted” and spatially normalized to the International Consortium for Brain Mapping (ICBM) brain template by using Advanced Normalization Tools (ANTs). Spatial normalization results were validated by inspection. Manual segmentation was performed on the center slice (x = 0.0) of the normalized images. The cross-sectional area of the tumor was drawn by trained personnel and included intralesional fluid collections (tumor cysts) if they were encapsulated by tumor tissue. Metastases and leptomeningeal enhancements were excluded. Manual segmentations were reviewed by a neuroradiologist and adjusted if necessary. Heatmaps were generated by using Python Matplotlib (v3.1.0) package. Tumor ROI counts were color coded using the jet colormap.
A total of 111 (42 Group 3, 69 Group 4) MRI examinations were reviewed. Two cases were excluded for lack of pre-surgical MR imaging (i.e., only CT imaging was available allowing for measurements and tumor localization to the 4th ventricle). Six others were excluded because only digitized films were available, and these could not be processed.
Extended Data
Extended Data Figure 1. Transcriptional atlas of the fetal human cerebellum.
(a) Schematic summary of the molecular datasets utilized to interconnect murine and human cerebellar profiles with MB. Single-cell and bulk sample counts for each data source are indicated. (b,c) UMAP plots showing published cell-type annotation (b) and predicted cell cycle phase (c) of the fetal human cerebellar atlas8. (d) Correlation heatmap of human cerebellar cell types. (e) Violin plots showing expression of cerebellar lineage markers in the fetal human cerebellar atlas. (f) Inferred cerebellar cell-type proportions in deconvoluted bulk MB transcriptomes. (g) Proportion of cerebellar lineage-associated genes up-regulated in MB subgroups. (h) MB subgroup-specific gene set enrichment in cerebellar cell types.
Extended Data Figure 2. Reciprocal classification of human fetal cerebellar and MB datasets using developmental and tumorigenic signatures.
(a) Predicted pseudotime of MB single-cells according to underlying cellular states. (b) RL-GlutaCN/UBC cell state metagenes projected onto Group 3/4-MB single-cells. MB single-cells are positioned according to the previously reported cellular hierarchy5. (c) Predicted pseudotime of bulk MB expression profiles according to underlying developmental cell states. Molecular subgroup, subtype, and driver gene alteration status is annotated for each individual tumor. Inferred cellular proportions of GluCN/UBC cell states are annotated for each tumor profile. (d) UMAP plot of MB Smart-seq2 training dataset, annotated with published subgroup assignments5. (e) UMAP plot of MB 10x scRNA-seq test dataset, annotated with published subgroup assignments51. (f) UMAP plot of MB 10x scRNA-seq test dataset, labelled with predicted subgroup assignments based on the neural-net classifier. (g) Confusion matrix summarizing performance of the neural-net classifier. (h) (Left panel) Pseudotime diffusion map of glutamatergic lineages extracted from the human cerebellar atlas. (Right panel) Classification of glutamatergic single-cells according to MB subgroup based on the neural-net classifier. (i) Heatmap showing unsupervised clustering of human RL (n=7), EGL (n=7), and MB (n=559) DNA methylation profiles. (j) DNA methylation-based classification of micro-dissected human fetal EGL (n=7) and RL (n=7) samples. Reference entities represent an aggregated set of CNS tumor and non-neoplastic methylation classes. Error bars represent standard error of the mean.
Extended Data Figure 3. Enrichment of photoreceptor and UBC gene signatures in the RLsvz.
(a) Heatmaps showing expression of RLsvz-enriched photoreceptor (upper panel) and UBC (lower panel) marker genes in human cerebellar sub-compartments. (b) UMAP plots showing mean expression of the photoreceptor (upper panel) and UBC (lower panel) gene sets across 77 human cell types13. (c) Heatmaps showing mean expression of RLsvz-enriched UBC (left panel) and photoreceptor (right panel) marker genes across 77 human cell types. (d,e) Quantification of RLsvz-enriched photoreceptor (d) and UBC (e) gene sets in human cerebellar glutamatergic lineages.
Extended Data Figure 4. Status of RLsvz-photoreceptor and RLsvz-UBC gene signatures in adult human cerebellum and cerebellar organoids.
(a) IHC of CRX (photoreceptor marker) and EOMES (UBC marker) in the adult human cerebellum. The precise localization of EOMES positivity was unconfirmed. Scale bars, 40μm. (b) UMAP summarizing snRNA-seq data derived from >150,000 nuclei isolated from the adult human cerebellum according to published cell types18. (c) Quantification of the RLsvz, photoreceptor, and UBC gene expression signatures in the adult human cerebellar atlas by cell type. Proportion of excitatory neurons positive for each expression signature is indicated. P-values were calculated as described in Figure 4d. (d) Expression of select marker genes in the adult human cerebellar atlas. (e) UMAP summary of cell types annotated in published human cerebellar organoids19. (f) Violin plots quantifying enrichment of the RLsvz, photoreceptor, and UBC gene sets in cell types annotated in human cerebellar organoids. P-values were calculated as described in Figure 4d. (g) Photoreceptor and UBC marker gene expression in cell types annotated in published human cerebellar organoids.
Extended Data Figure 5. Expression of RLsvz marker genes across cerebellar sub-compartments and MB subgroups.
(a,b) Heatmaps of RLsvz-photoreceptor (a) and RLsvz-UBC (b) marker gene expression in Group 3/4-MB. (c,d) Boxplots of select RLsvz-photoreceptor (c) and RLsvz-UBC (d) marker genes summarizing expression across human cerebellar sub-compartments and MB subgroups. All boxplots were created as described in Figure 2c.
Extended Data Figure 6. Correlation of OTX2 expression and TF activity with the RLsvz-photoreceptor signature.
(a,b) Correlation of OTX2 and RLsvz-photoreceptor gene set expression across human cerebellar sub-compartments (a) and Group 3/4-MB (b). P-values were calculated using a two-sided Pearson’s correlation test. (c) iRegulon analysis of the RLsvz-photoreceptor gene set. (d) Enrichment of the RLsvz-derived photoreceptor gene set in the RL-GlutaCN/UBC lineage trajectory. (e) OTX2 TF activity in the RL-GlutaCN/UBC lineage trajectory. (f) Correlation of OTX2 TF activity and expression of the RLsvz-photoreceptor gene set in single-cells derived from the RL-GlutaCN/UBC lineage. P-values were calculated using a two-sided Pearson’s correlation test.
Extended Data Figure 7. OTX2 is required for maintenance of the photoreceptor signature in Group 3-MB.
(a) Experimental approach for inactivating OTX2 in Group 3-MB cells. (b) Western blot showing efficient reduction of OTX2 protein expression at day 7 in OTX2-edited D283 MB cells. (c) Volcano plot highlighting differentially expressed genes in OTX2-edited versus non-targeted D283 cells. P-values were calculated using a two-sided Wald test and were adjusted for multiple comparisons using FDR correction. (d) GSEA results showing the top up-regulated and down-regulated gene sets in OTX2-edited D283 cells compared to non-targeted controls. (e) Significant up-regulation of the RLsvz-derived UBC gene set in OTX2-edited D283 cells.(f) Significant down-regulation of the RLsvz-photoreceptor gene set in OTX2-edited D283 cells. P-values for all gene set enrichment analyses were calculated using the Monte Carlo method. (g) Pairwise analysis of recurrent genetic alterations in Group 3/4-MB. P-values were calculated using a linear regression model and adjusted for multiple comparisons using the FDR correction. (h) Smoothed expression of DDX31, BARHL1, and OTX2 in the fetal human GlutaCN/UBC lineage sorted by pseudotime.
Extended Data Figure 8. Single-cell profiles of the developing murine cerebellum and lineage-enriched subpopulations.
(a,b) UMAP plots of the harmonized murine cerebellar atlas summarized by data origin (a) and developmental stage (b). (c) UMAP plot of the harmonized murine cerebellar atlas indicating consensus cell type annotations. (d) Heatmap showing relative enrichment of murine cerebellar lineage gene sets in fetal human cerebellar cell types. (e,f) UMAP plots showing enrichment of the human RLvz (e) and RLsvz (f) gene signatures in the murine cerebellar atlas. (g) Violin plots quantifying enrichment of RLvz (upper panel) and RLsvz (lower panel) gene sets in murine cerebellar cell types. Cell types with enrichment in >25% of cells are indicated; adjusted p<0.05. (h) Enrichment of the murine RL gene signature in the human cerebellar atlas. (i) Violin plots quantifying enrichment of the murine RL gene signature in human cerebellar cell types. (j) Violin plots quantifying enrichment of the human RLsvz-UBC gene signature across murine (upper panel) and human (lower panel) cell types. P-values for all violin plots were calculated as described in Figure 4d. Additional details regarding the harmonization of the murine cerebellar atlas are summarized in the Supplementary Information.
Extended Data Figure 9. Quantification of photoreceptor and UBC gene sets in murine MB models.
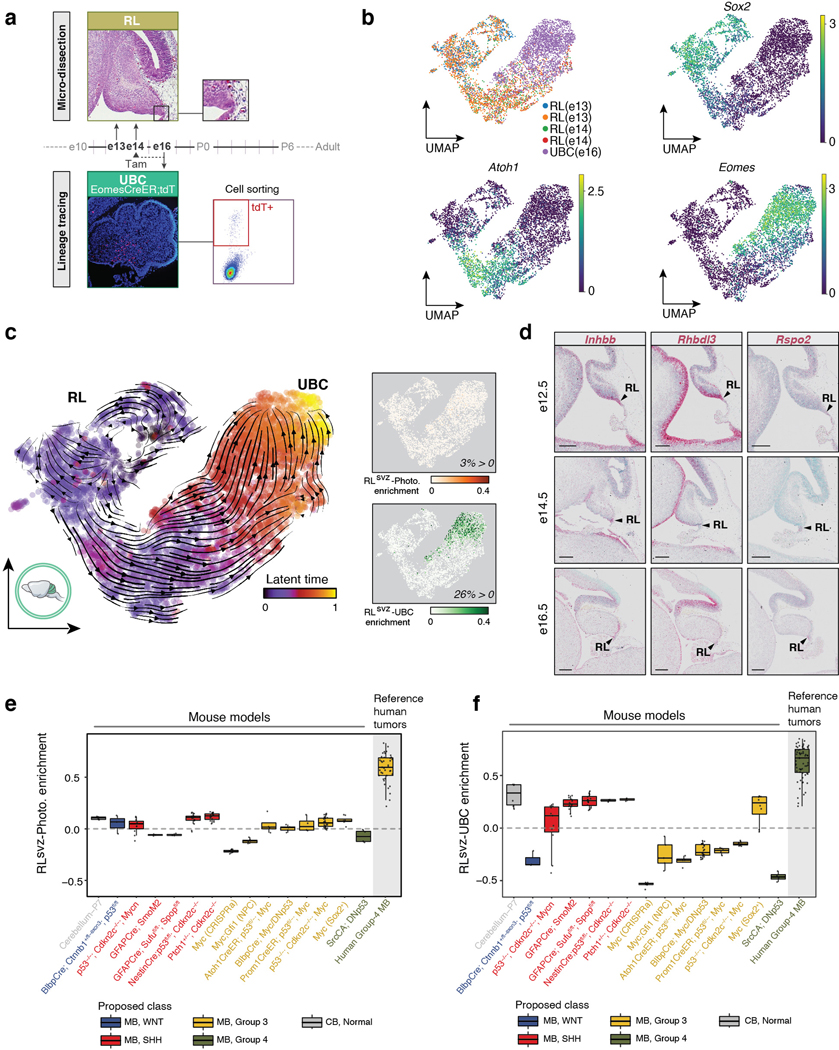
(a) Enrichment strategy for isolating the murine RL-UBC lineage. (b) UMAP plots of the enriched murine RL-UBC trajectory, showing experimental source and select marker gene expression. (c) (Left panel) Latent time analysis of RL-UBC lineage-enriched single-cells. (Right panels) Enrichment quantification of the RLsvz-photoreceptor and -UBC gene sets in the murine RL-UBC lineage trajectory. (d) ISH of photoreceptor marker genes in murine cerebellum. Scale bars, 200μm. (e,f) Boxplots summarizing enrichment of the RLsvz-photoreceptor (e) and UBC (f) gene sets across published murine MB transcriptional datasets (n=14). Human MB and normal P7 cerebellum datasets were included as a reference. All boxplots were created as described in Figure 2c.
Extended Data Figure 10. Anatomical mapping of MB diagnosis in the cerebellum.
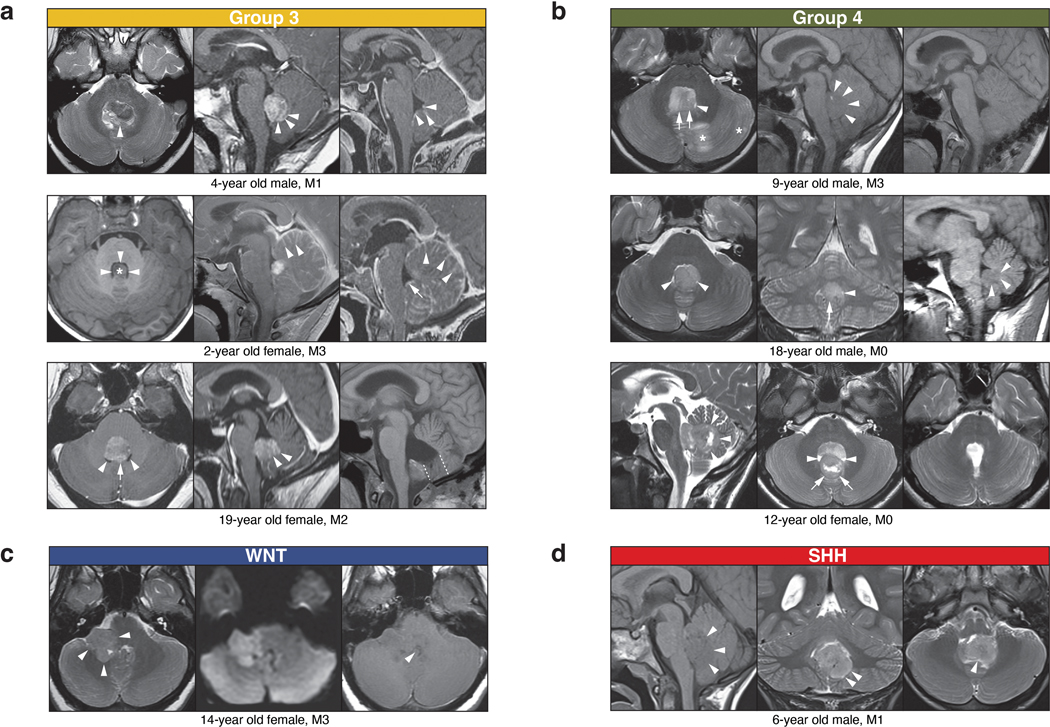
(a-d) Select pre- and post-surgical MRIs of ‘small’ MBs according to subgroup. Group 3 (a) and Group 4 (b) tumors indicate a common anatomic point of origin in the nodulus. Additional details for each ‘small’ MB are summarized in the Supplementary Information.
Supplementary Material
Acknowledgements
This work was principally supported by the American Lebanese Syrian Associated Charities and St. Jude (P.A.N.), The Sontag Foundation (Distinguish Scientist Award; P.A.N.), St. Baldrick’s Foundation (Robert J. Arceci Innovation Award; P.A.N), and the National Cancer Institute (PAN; P01CA096832-16A1). P.A.N. is a Pew-Stewart Scholar for Cancer Research (Margaret and Alexander Stewart Trust). L.B. was supported by a Future Leaders Award from The Brain Tumour Charity (GN-000518). V.C. acknowledges funding from R01NS093009. From St. Jude, we thank the Flow Cytometry Core Laboratory (Department of Developmental Neurobiology), the Flow Cytometry and Cell Sorting Shared Resource Facility, the Hartwell Center (supported in part by NCI grant P30 CA021765) and the Center for In Vivo Imaging and Therapeutics (supported in part by NCI grants R50CA211481 (WJA) and P30CA021765 (Cancer Center)). We thank G. Campbell for assistance with immunostaining. Images were acquired at the Cell & Tissue Imaging Center which is supported by St. Jude and NCI P30 CA021765. We also thank A. Vasilyeva for coordination of clinical study information, M. Batts for animal care support, and B. Stelter for assistance with artwork. Normal human material was provided by the Birth Defects Research Laboratory at the University of Washington (supported by NICHD R24 HD000836 to IAG) and the Joint Medical Research Council/Wellcome (MR/R006237/1) Human Developmental Biology Resource, UK. Human tissue used in this study was covered by a material transfer agreement between SCRI and HDBR.
Footnotes
Competing interests
None.
Supplementary information is available for this paper online.
Data availability
Previously unpublished scRNA-seq, bulk RNA-seq, and array-based DNA methylation datasets described in this study have been deposited in Gene Expression Omnibus (GEO) with the accession code GSE207266. The harmonized murine single-cell cerebellar atlas expression matrix is accessible in GEO under the same accession code (GSE207266).
References
- 1.Northcott PA et al. Medulloblastoma. Nat Rev Dis Primers 5, 11, doi: 10.1038/s41572-019-0063-6 (2019). [DOI] [PubMed] [Google Scholar]
- 2.Hovestadt V et al. Medulloblastomics revisited: biological and clinical insights from thousands of patients. Nat Rev Cancer 20, 42–56, doi: 10.1038/s41568-019-0223-8 (2020). [DOI] [PMC free article] [PubMed] [Google Scholar]
- 3.Haldipur P, Millen KJ & Aldinger KA Human Cerebellar Development and Transcriptomics: Implications for Neurodevelopmental Disorders. Annu Rev Neurosci, doi: 10.1146/annurev-neuro-111020-091953 (2022). [DOI] [PMC free article] [PubMed]
- 4.Jones DTW et al. Molecular characteristics and therapeutic vulnerabilities across paediatric solid tumours. Nat Rev Cancer 19, 420–438, doi: 10.1038/s41568-019-0169-x (2019). [DOI] [PubMed] [Google Scholar]
- 5.Hovestadt V et al. Resolving medulloblastoma cellular architecture by single-cell genomics. Nature 572, 74–79, doi: 10.1038/s41586-019-1434-6 (2019). [DOI] [PMC free article] [PubMed] [Google Scholar]
- 6.Vladoiu MC et al. Childhood cerebellar tumours mirror conserved fetal transcriptional programs. Nature 572, 67–73, doi: 10.1038/s41586-019-1158-7 (2019). [DOI] [PMC free article] [PubMed] [Google Scholar]
- 7.Haldipur P et al. Spatiotemporal expansion of primary progenitor zones in the developing human cerebellum. Science 366, 454–460, doi: 10.1126/science.aax7526 (2019). [DOI] [PMC free article] [PubMed] [Google Scholar]
- 8.Aldinger KA et al. Spatial and cell type transcriptional landscape of human cerebellar development. Nat Neurosci 24, 1163–1175, doi: 10.1038/s41593-021-00872-y (2021). [DOI] [PMC free article] [PubMed] [Google Scholar]
- 9.Jessa S et al. Stalled developmental programs at the root of pediatric brain tumors. Nat Genet 51, 1702–1713, doi: 10.1038/s41588-019-0531-7 (2019). [DOI] [PMC free article] [PubMed] [Google Scholar]
- 10.Gibson P et al. Subtypes of medulloblastoma have distinct developmental origins. Nature 468, 1095–1099, doi: 10.1038/nature09587 (2010). [DOI] [PMC free article] [PubMed] [Google Scholar]
- 11.Capper D et al. DNA methylation-based classification of central nervous system tumours. Nature 555, 469–474, doi: 10.1038/nature26000 (2018). [DOI] [PMC free article] [PubMed] [Google Scholar]
- 12.Consalez GG, Goldowitz D, Casoni F & Hawkes R Origins, Development, and Compartmentation of the Granule Cells of the Cerebellum. Front Neural Circuits 14, 611841, doi: 10.3389/fncir.2020.611841 (2020). [DOI] [PMC free article] [PubMed] [Google Scholar]
- 13.Cao J et al. A human cell atlas of fetal gene expression. Science 370, doi: 10.1126/science.aba7721 (2020). [DOI] [PMC free article] [PubMed] [Google Scholar]
- 14.Englund C et al. Unipolar brush cells of the cerebellum are produced in the rhombic lip and migrate through developing white matter. J Neurosci 26, 9184–9195, doi: 10.1523/JNEUROSCI.1610-06.2006 (2006). [DOI] [PMC free article] [PubMed] [Google Scholar]
- 15.Hagan N & Zervas M Wnt1 expression temporally allocates upper rhombic lip progenitors and defines their terminal cell fate in the cerebellum. Mol Cell Neurosci 49, 217–229, doi: 10.1016/j.mcn.2011.11.008 (2012). [DOI] [PMC free article] [PubMed] [Google Scholar]
- 16.McDonough A et al. Unipolar (Dendritic) Brush Cells Are Morphologically Complex and Require Tbr2 for Differentiation and Migration. Front Neurosci 14, 598548, doi: 10.3389/fnins.2020.598548 (2020). [DOI] [PMC free article] [PubMed] [Google Scholar]
- 17.Furukawa T, Morrow EM & Cepko CL Crx, a novel otx-like homeobox gene, shows photoreceptor-specific expression and regulates photoreceptor differentiation. Cell 91, 531–541, doi: 10.1016/s0092-8674(00)80439-0 (1997). [DOI] [PubMed] [Google Scholar]
- 18.Kozareva V et al. Author Correction: A transcriptomic atlas of mouse cerebellar cortex comprehensively defines cell types. Nature 602, E21, doi: 10.1038/s41586-021-04373-7 (2022). [DOI] [PMC free article] [PubMed] [Google Scholar]
- 19.Nayler S, Agarwal D, Curion F, Bowden R & Becker EBE High-resolution transcriptional landscape of xeno-free human induced pluripotent stem cell-derived cerebellar organoids. Sci Rep 11, 12959, doi: 10.1038/s41598-021-91846-4 (2021). [DOI] [PMC free article] [PubMed] [Google Scholar]
- 20.Cho YJ et al. Integrative genomic analysis of medulloblastoma identifies a molecular subgroup that drives poor clinical outcome. J Clin Oncol 29, 1424–1430, doi: 10.1200/JCO.2010.28.5148 (2011). [DOI] [PMC free article] [PubMed] [Google Scholar]
- 21.Garancher A et al. NRL and CRX Define Photoreceptor Identity and Reveal Subgroup-Specific Dependencies in Medulloblastoma. Cancer Cell 33, 435–449 e436, doi: 10.1016/j.ccell.2018.02.006 (2018). [DOI] [PMC free article] [PubMed] [Google Scholar]
- 22.Kool M et al. Integrated genomics identifies five medulloblastoma subtypes with distinct genetic profiles, pathway signatures and clinicopathological features. PLoS One 3, e3088, doi: 10.1371/journal.pone.0003088 (2008). [DOI] [PMC free article] [PubMed] [Google Scholar]
- 23.Northcott PA et al. Medulloblastoma comprises four distinct molecular variants. J Clin Oncol 29, 1408–1414, doi: 10.1200/JCO.2009.27.4324 (2011). [DOI] [PMC free article] [PubMed] [Google Scholar]
- 24.Northcott PA et al. The whole-genome landscape of medulloblastoma subtypes. Nature 547, 311–317, doi: 10.1038/nature22973 (2017). [DOI] [PMC free article] [PubMed] [Google Scholar]
- 25.Sharma T et al. Second-generation molecular subgrouping of medulloblastoma: an international meta-analysis of Group 3 and Group 4 subtypes. Acta Neuropathol 138, 309–326, doi: 10.1007/s00401-019-02020-0 (2019). [DOI] [PMC free article] [PubMed] [Google Scholar]
- 26.Lin CY et al. Active medulloblastoma enhancers reveal subgroup-specific cellular origins. Nature 530, 57–62, doi: 10.1038/nature16546 (2016). [DOI] [PMC free article] [PubMed] [Google Scholar]
- 27.Bunt J et al. OTX2 directly activates cell cycle genes and inhibits differentiation in medulloblastoma cells. Int J Cancer 131, E21–32, doi: 10.1002/ijc.26474 (2012). [DOI] [PubMed] [Google Scholar]
- 28.Sweet-Cordero EA & Biegel JA The genomic landscape of pediatric cancers: Implications for diagnosis and treatment. Science 363, 1170–1175, doi: 10.1126/science.aaw3535 (2019). [DOI] [PMC free article] [PubMed] [Google Scholar]
- 29.Grobner SN et al. The landscape of genomic alterations across childhood cancers. Nature 555, 321–327, doi: 10.1038/nature25480 (2018). [DOI] [PubMed] [Google Scholar]
- 30.Northcott PA et al. Enhancer hijacking activates GFI1 family oncogenes in medulloblastoma. Nature 511, 428–434, doi: 10.1038/nature13379 (2014). [DOI] [PMC free article] [PubMed] [Google Scholar]
- 31.Goodrich LV, Milenkovic L, Higgins KM & Scott MP Altered neural cell fates and medulloblastoma in mouse patched mutants. Science 277, 1109–1113, doi: 10.1126/science.277.5329.1109 (1997). [DOI] [PubMed] [Google Scholar]
- 32.Kawauchi D et al. A mouse model of the most aggressive subgroup of human medulloblastoma. Cancer Cell 21, 168–180, doi: 10.1016/j.ccr.2011.12.023 (2012). [DOI] [PMC free article] [PubMed] [Google Scholar]
- 33.Pei Y et al. An animal model of MYC-driven medulloblastoma. Cancer Cell 21, 155–167, doi: 10.1016/j.ccr.2011.12.021 (2012). [DOI] [PMC free article] [PubMed] [Google Scholar]
- 34.Swartling FJ et al. Distinct neural stem cell populations give rise to disparate brain tumors in response to N-MYC. Cancer Cell 21, 601–613, doi: 10.1016/j.ccr.2012.04.012 (2012). [DOI] [PMC free article] [PubMed] [Google Scholar]
- 35.Perreault S et al. MRI surrogates for molecular subgroups of medulloblastoma. AJNR Am J Neuroradiol 35, 1263–1269, doi: 10.3174/ajnr.A3990 (2014). [DOI] [PMC free article] [PubMed] [Google Scholar]
- 36.Wefers AK et al. Subgroup-specific localization of human medulloblastoma based on pre-operative MRI. Acta Neuropathol 127, 931–933, doi: 10.1007/s00401-014-1271-5 (2014). [DOI] [PubMed] [Google Scholar]
- 37.Gajjar A et al. Outcomes by Clinical and Molecular Features in Children With Medulloblastoma Treated With Risk-Adapted Therapy: Results of an International Phase III Trial (SJMB03). J Clin Oncol 39, 822–835, doi: 10.1200/JCO.20.01372 (2021). [DOI] [PMC free article] [PubMed] [Google Scholar]
- 38.Robinson GW et al. Risk-adapted therapy for young children with medulloblastoma (SJYC07): therapeutic and molecular outcomes from a multicentre, phase 2 trial. Lancet Oncol 19, 768–784, doi: 10.1016/S1470-2045(18)30204-3 (2018). [DOI] [PMC free article] [PubMed] [Google Scholar]
- 39.Patay Z et al. MR Imaging Characteristics of Wingless-Type-Subgroup Pediatric Medulloblastoma. AJNR Am J Neuroradiol 36, 2386–2393, doi: 10.3174/ajnr.A4495 (2015). [DOI] [PMC free article] [PubMed] [Google Scholar]
- 40.Aldape K et al. Challenges to curing primary brain tumours. Nat Rev Clin Oncol 16, 509–520, doi: 10.1038/s41571-019-0177-5 (2019). [DOI] [PMC free article] [PubMed] [Google Scholar]
- 41.Gajjar AJ & Robinson GW Medulloblastoma-translating discoveries from the bench to the bedside. Nat Rev Clin Oncol 11, 714–722, doi: 10.1038/nrclinonc.2014.181 (2014). [DOI] [PubMed] [Google Scholar]
- 42.Cavalli FMG et al. Intertumoral Heterogeneity within Medulloblastoma Subgroups. Cancer Cell 31, 737–754 e736, doi: 10.1016/j.ccell.2017.05.005 (2017). [DOI] [PMC free article] [PubMed] [Google Scholar]
- 43.Poli V et al. MYC-driven epigenetic reprogramming favors the onset of tumorigenesis by inducing a stem cell-like state. Nat Commun 9, 1024, doi: 10.1038/s41467-018-03264-2 (2018). [DOI] [PMC free article] [PubMed] [Google Scholar]
- 44.Friedmann-Morvinski D et al. Dedifferentiation of neurons and astrocytes by oncogenes can induce gliomas in mice. Science 338, 1080–1084, doi: 10.1126/science.1226929 (2012). [DOI] [PMC free article] [PubMed] [Google Scholar]
- 45.Morfouace M et al. Pemetrexed and gemcitabine as combination therapy for the treatment of Group3 medulloblastoma. Cancer Cell 25, 516–529, doi: 10.1016/j.ccr.2014.02.009 (2014). [DOI] [PMC free article] [PubMed] [Google Scholar]
- 46.Pei Y et al. HDAC and PI3K Antagonists Cooperate to Inhibit Growth of MYC-Driven Medulloblastoma. Cancer Cell 29, 311–323, doi: 10.1016/j.ccell.2016.02.011 (2016). [DOI] [PMC free article] [PubMed] [Google Scholar]
- 47.Tao R et al. MYC Drives Group 3 Medulloblastoma through Transformation of Sox2(+) Astrocyte Progenitor Cells. Cancer Res 79, 1967–1980, doi: 10.1158/0008-5472.CAN-18-1787 (2019). [DOI] [PMC free article] [PubMed] [Google Scholar]
- 48.Kawauchi D et al. Novel MYC-driven medulloblastoma models from multiple embryonic cerebellar cells. Oncogene 36, 5231–5242, doi: 10.1038/onc.2017.110 (2017). [DOI] [PMC free article] [PubMed] [Google Scholar]
- 49.Behesti H, Kocabas A, Buchholz DE, Carroll TS & Hatten ME Altered temporal sequence of transcriptional regulators in the generation of human cerebellar granule cells. Elife 10, doi: 10.7554/eLife.67074 (2021). [DOI] [PMC free article] [PubMed] [Google Scholar]
- 50.Patay Z et al. MR Imaging Characteristics of Wingless-Type-Subgroup Pediatric Medulloblastoma. AJNR Am J Neuroradiol 36, 2386–2393, doi: 10.3174/ajnr.A4495 (2015). [DOI] [PMC free article] [PubMed] [Google Scholar]
Additional references:
- 51.Riemondy KA et al. Neoplastic and immune single cell transcriptomics define subgroup-specific intra-tumoral heterogeneity of childhood medulloblastoma. Neuro Oncol, doi: 10.1093/neuonc/noab135 (2021). [DOI] [PMC free article] [PubMed]
- 52.Polanski K et al. BBKNN: fast batch alignment of single cell transcriptomes. Bioinformatics 36, 964–965, doi: 10.1093/bioinformatics/btz625 (2020). [DOI] [PMC free article] [PubMed] [Google Scholar]
- 53.La Manno G et al. RNA velocity of single cells. Nature 560, 494–498, doi: 10.1038/s41586-018-0414-6 (2018). [DOI] [PMC free article] [PubMed] [Google Scholar]
- 54.Bergen V, Lange M, Peidli S, Wolf FA & Theis FJ Generalizing RNA velocity to transient cell states through dynamical modeling. Nat Biotechnol 38, 1408–1414, doi: 10.1038/s41587-020-0591-3 (2020). [DOI] [PubMed] [Google Scholar]
- 55.Stuart T et al. Comprehensive Integration of Single-Cell Data. Cell 177, 1888–1902 e1821, doi: 10.1016/j.cell.2019.05.031 (2019). [DOI] [PMC free article] [PubMed] [Google Scholar]
- 56.Wolf FA, Angerer P & Theis FJ SCANPY: large-scale single-cell gene expression data analysis. Genome Biol 19, 15, doi: 10.1186/s13059-017-1382-0 (2018). [DOI] [PMC free article] [PubMed] [Google Scholar]
- 57.Wang X, Park J, Susztak K, Zhang NR & Li M Bulk tissue cell type deconvolution with multi-subject single-cell expression reference. Nat Commun 10, 380, doi: 10.1038/s41467-018-08023-x (2019). [DOI] [PMC free article] [PubMed] [Google Scholar]
- 58.Subramanian A et al. Gene set enrichment analysis: a knowledge-based approach for interpreting genome-wide expression profiles. Proc Natl Acad Sci U S A 102, 15545–15550, doi: 10.1073/pnas.0506580102 (2005). [DOI] [PMC free article] [PubMed] [Google Scholar]
- 59.Love MI, Huber W & Anders S Moderated estimation of fold change and dispersion for RNA-seq data with DESeq2. Genome Biol 15, 550, doi: 10.1186/s13059-014-0550-8 (2014). [DOI] [PMC free article] [PubMed] [Google Scholar]
- 60.Hanzelmann S, Castelo R & Guinney J GSVA: gene set variation analysis for microarray and RNA-seq data. BMC Bioinformatics 14, 7, doi: 10.1186/1471-2105-14-7 (2013). [DOI] [PMC free article] [PubMed] [Google Scholar]
- 61.Hao Y et al. Integrated analysis of multimodal single-cell data. Cell 184, 3573–3587 e3529, doi: 10.1016/j.cell.2021.04.048 (2021). [DOI] [PMC free article] [PubMed] [Google Scholar]
- 62.Korsunsky I et al. Fast, sensitive and accurate integration of single-cell data with Harmony. Nat Methods 16, 1289–1296, doi: 10.1038/s41592-019-0619-0 (2019). [DOI] [PMC free article] [PubMed] [Google Scholar]
- 63.Buenrostro JD, Giresi PG, Zaba LC, Chang HY & Greenleaf WJ Transposition of native chromatin for fast and sensitive epigenomic profiling of open chromatin, DNA-binding proteins and nucleosome position. Nature Methods 10, 1213–1218, doi: 10.1038/nmeth.2688 (2013). [DOI] [PMC free article] [PubMed] [Google Scholar]
- 64.Buenrostro JD, Wu B, Chang HY & Greenleaf WJ ATAC-seq: A Method for Assaying Chromatin Accessibility Genome-Wide. Curr Protoc Mol Biol 109, 21.29.21–21.29.29, doi: 10.1002/0471142727.mb2129s109 (2015). [DOI] [PMC free article] [PubMed] [Google Scholar]
- 65.Corces MR et al. An improved ATAC-seq protocol reduces background and enables interrogation of frozen tissues. Nature Methods 14, 959–962, doi: 10.1038/nmeth.4396 (2017). [DOI] [PMC free article] [PubMed] [Google Scholar]
- 66.Li H Aligning sequence reads, clone sequences and assembly contigs with BWA-MEM. arXiv preprint arXiv:1303.3997 (2013).
- 67.Ramírez F, Dündar F, Diehl S, Grüning BA & Manke T deepTools: a flexible platform for exploring deep-sequencing data. Nucleic acids research 42, W187–W191 (2014). [DOI] [PMC free article] [PubMed] [Google Scholar]
- 68.Robinson JT et al. Integrative genomics viewer. Nature biotechnology 29, 24–26 (2011). [DOI] [PMC free article] [PubMed] [Google Scholar]
- 69.Vo BT et al. Mouse medulloblastoma driven by CRISPR activation of cellular Myc. Sci Rep 8, 8733, doi: 10.1038/s41598-018-24956-1 (2018). [DOI] [PMC free article] [PubMed] [Google Scholar]
- 70.Lee C et al. Lsd1 as a therapeutic target in Gfi1-activated medulloblastoma. Nat Commun 10, 332, doi: 10.1038/s41467-018-08269-5 (2019). [DOI] [PMC free article] [PubMed] [Google Scholar]
Associated Data
This section collects any data citations, data availability statements, or supplementary materials included in this article.
Supplementary Materials
Data Availability Statement
Previously unpublished scRNA-seq, bulk RNA-seq, and array-based DNA methylation datasets described in this study have been deposited in Gene Expression Omnibus (GEO) with the accession code GSE207266. The harmonized murine single-cell cerebellar atlas expression matrix is accessible in GEO under the same accession code (GSE207266).


