

Abstract
Putidaredoxin (Pdx) is the exclusive reductase and a structural effector for P450cam (CYP101A1). However, the mechanism of how Pdx modulates the conformational states of P450cam remains elusive. Here we report a putative communication pathway for the Pdx-induced conformational change in P450cam using results of double electron−electron resonance (DEER) spectroscopy and molecular dynamics simulations. Use of solution state DEER measurements allows us to observe subtle conformational changes in the internal helices in P450cam among closed, open, and P450cam−Pdx complex states. Molecular dynamics simulations and dynamic network analysis suggest that Pdx binding is coupled to small coordinated movements of several regions of P450cam, including helices C, B′, I, G, and F. These changes provide a linkage between the Pdx binding site on the proximal side of the enzyme and helices F/G on the distal side and the site of the largest movement resulting from the Pdx-induced closed-to-open transition. This study provides a detailed rationale for how Pdx exerts its long-recognized effector function at the active site from its binding site on the opposite face of the enzyme.
Graphical Abstract
The cytochromes P450 form a large superfamily of hemethiolate monooxygenases, which utilize O2 to oxidize a vast variety of substrates.1–4 Examples can be found in bacteria, plants, humans, and even viruses. Even with more than 350000 gene members in this superfamily,5 P450s share a similar tertiary structure and catalytic cycle.6,7 P450cam (CYP101A1) from Pseudomonas putida is one of the best studied P450 enzymes.8–10 It receives two electrons from NADH to hydroxylate camphor to form 5-exohydroxycam-phor. The catalytic cycle starts when the substrate (camphor) binds to P450cam, which lowers the reduction potential to allow the first electron transfer from its specific reductase, putidaredoxin (Pdx).11–13 A dioxygen molecule then binds to the heme and forms a ferric−superoxide complex.14–17 After a second electron transfer occurs exclusively from Pdx and subsequent proton transfers, heterolytic cleavage of the peroxy bond forms Compound Ι, which is an iron(IV)−oxo complex with a radical on the porphyrin ring, and this intermediate enables substrate hydroxylation.18–20 A variety of P450cam conformational states that depend on substrate and/or Pdx binding are correlated with the catalytic cycle. For instance, several studies have established that helices F/G of P450cam undergo an open−closed conformational change upon camphor binding.21–23 A library of 30 crystal structures of the enzyme bound to different substrate analogues have shown three conformational states of P450cam: open, closed, and intermediate.24 An intermediate state has also been recently observed in the complex formed by binding both CN− and Pdx.25 In addition, a movement of helices C/D of ferrous CO-bound P450cam was observed by nuclear magnetic resonance (NMR) in response to substrate binding.26 Therefore, the presence of multiple conformational states of P450cam is an important part of substrate recognition and function for this enzyme.
The effector role for Pdx has long been recognized to facilitate the catalytic reaction of P450cam, but only recently has the structural basis for this role become better understood. Recent crystallography and double electron−electron resonance (DEER) spectroscopy studies have indicated that oxidized Pdx shifts camphor-bound ferric P450cam from the closed to the open state.27–29 In support of this, isothermal titration calorimetry (ITC) has shown that Pdx binds more strongly to the open form of P450cam than the closed form.30 In addition, molecular dynamics (MD) simulations support the proposal that binding of Pdx to the proximal side of the enzyme favors the open conformation.31 Importantly, a recent DEER study has shown that in the ferric−CN− complex, a structural mimic of the ferrous−O2 complex, Pdxox induces a conformational state that is intermediate between open and closed.25 It was proposed that this intermediate state represents the catalytically competent form in which the peroxy bond is cleaved to generate Compound I.24,32 The intermediate pose stabilizes the catalytic water that is involved in critical proton transfer during Compound I formation.21,33–37 Thus, Pdx’s effector role may be to generate the intermediate conformation of P450cam to complete the catalytic cycle. However, several other studies suggest that the effector role is even more complex and unresolved. Early NMR work pioneered the discovery of Pdx’s effector role and noted perturbations in helices B′, C, and I,38–41 which originally inspired us to explore the effector role of Pdx by DEER.27,28 However, the open−closed transition of the P450cam conformation upon substrate binding was not observed by NMR studies,26,42 which are in contrast with other reports.21,27,31,43 Perhaps the most significant reason is the need to use the ferrous−CO complex of P450cam for NMR studies. However, our recent studies have shown that the ferrous−CO complex does not undergo the closed−open conformational change upon binding of oxidized Pdx.28,29 Results of the Spiro group have suggested a potential explanation, where the linear mode of the CO adduct in ferrous P450cam, which is distinct from the bent O2 adduct,16 probably causes this structural discrepancy in CO-bound P450cam.44
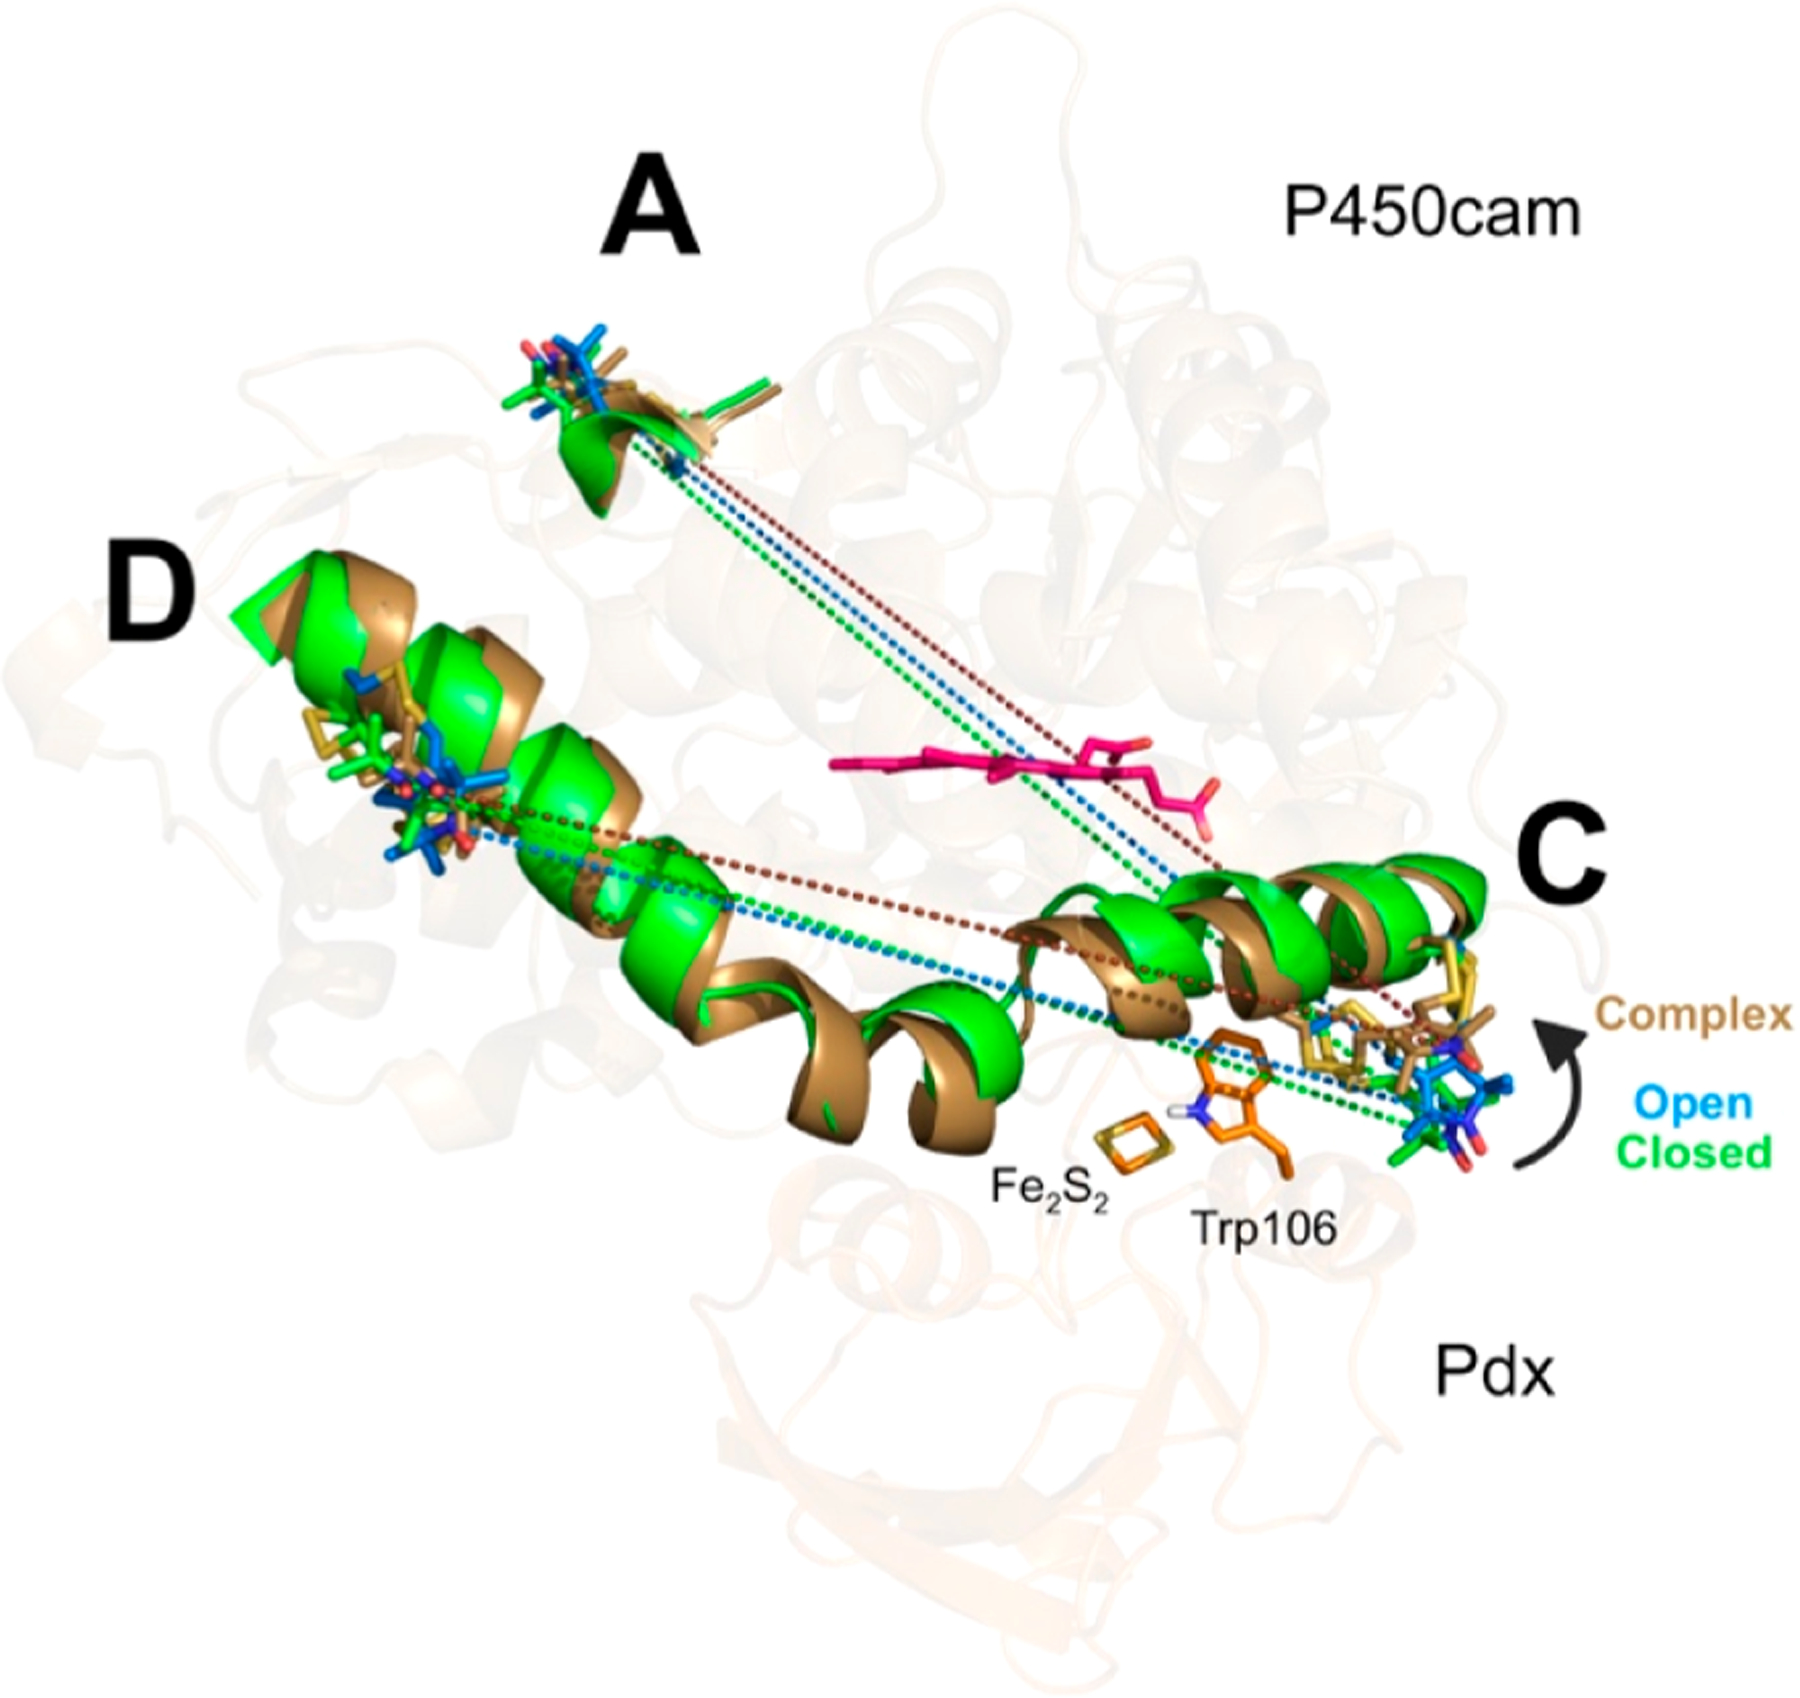
The central question of our study is how Pdx binding at the proximal face of P450cam causes conformational changes at the substrate binding site on the opposite distal side of the enzyme. Two models have been proposed to explain this long-range effector role in the past two decades (Figure 1). One hypothesis suggests that Pdx-induced heme ruffling causes a long-range conformational change in P450cam.45 To clarify this hypothesis, a P450cam mutant, L358P, has been of interest because this mutant introduces an additional movement on the heme pyrrole ring and enhances the donation of an electron from C357 to the heme.46 However, a previous study of L358P P450cam suggests heme ruffling is less relevant to the Pdx-induced conformational change.47 Another model for the effector role of Pdx emphasizes the interaction between the C-terminus of Pdx and helix C of P450cam.43,48–51 The camphor-bound P450cam−Pdx crystal structure suggests that helix C of P450cam moves 2−3 Å toward the Pdx binding site, while PdxW106 adopts a new conformer to maintain its interaction with A113 and N116 of P450cam,27,49,52 which is significant for both the second electron transfer reaction and the binding affinity for P450cam.10,49 However, as the effector role of Pdx is still under debate, the relative movements of elements of the P450cam structure upon Pdx binding in solution require further investigation. Herein, we report the combination of DEER measurements53,54 and MD simulations to characterize movements of specific marker sites within the P450cam structure, including helices A, C, D, F/G, and J, that occur upon binding of Pdx.
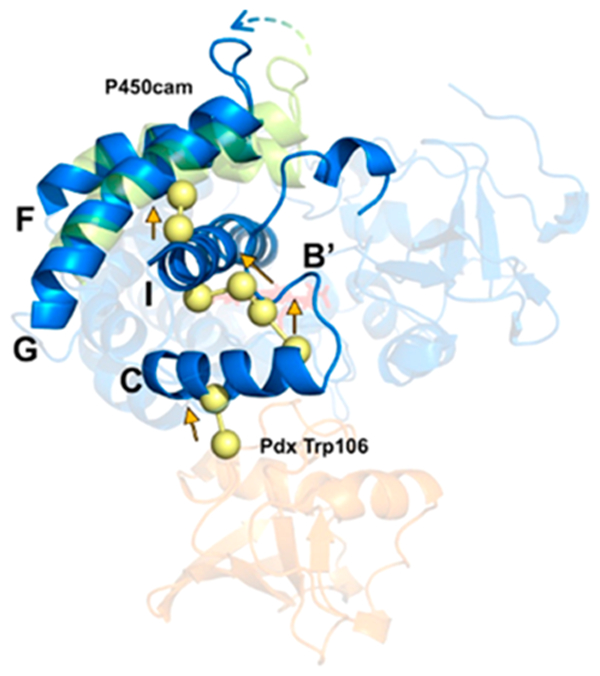
Figure 1.
Proposed models for the linkage between Pdx binding and movement of helices F/G. One model (shown with red arrows) includes a small movement of helix C of P450cam as it interacts with W106 of Pdx and propagation of this change through helix I. Another model (shown with black arrows) involves a direct effect of Pdx on heme ruffling that changes the distal active site environment.
METHODS
Mutagenesis, Protein Expression, and Purification.
All mutants of P450cam (BSL-AC, BSL-CD, BSL-AJ, and MTSL-P450cam) were prepared by site-directed mutagenesis, with four additional mutated amino acids (C58S, C85S, C136S, and C285S) to remove surface accessible cysteines.22 P450cam and Pdx were expressed and purified as previously described,29 except for the following mutants. The expression of P450cam BSL-AC and BSL-CD was induced with 0.3 mM isopropyl β-d-1-thiogalactopyranoside (IPTG) after the OD600 reached 0.5−0.6, and the culture was maintained for 36−48 h at 26 °C while being shaken. Cells were harvested and lysed using a French press; the crude lysate was clarified by centrifugation, loaded on a 70 mL DEAE-anion exchange column (DEAE Sepharose Fast Flow, GE Healthcare), and eluted with a salt gradient from 30 to 270 mM KCl in 840 mL, and the fractions with A417/A280 values of >0.6 were pooled. After concentration by ultrafiltration, the sample was purified on a 1.8 L bed volume Sephacryl S-200 gel-filtration column, and the fractions with A417/A280 values of >1.1 were retained. To increase the purity, the sample was further polished with a 6 mL Resource Q column (GE Healthcare) with an initial buffer that consisted of 50 mM KPi, 1 mM camphor, and 1 mM dithiothreitol (pH 6.5). The protein was eluted with a salt gradient from 15 to 300 mM KCl in 84 mL, and the fractions with A417/A280 values of >1.6 were collected for later usage.
Site-Directed Spin Labeling and DEER Sample Preparation.
The MTSL [(1-oxyl-2,2,5,5-tetramethyl-Δ3-pyrroline-3-methyl) methanethiosulfonate] and BSL [3,4-bis(methanethiosulfonylmethyl)-2,2,5,5-tetramethyl-2,5-dihy-dro-1H-pyrrol-1-yloxy] spin-labels were purchased from Toronto Research Chemicals. Experimental procedures used to introduce spin-labels into P450cam mutants were described previously.29 The extent of labeling was measured by ESI mass spectroscopy with an Agilent 1260/6120 series liquid chromatograph−mass spectrometer (Table S1 and Figures S1 and S2). All electron paramagnetic resonance (EPR) samples contained 100 μM P450cam, 250 μM Pdx (if applicable), and 30% d8-glycerol (cryogenic glassing agent) and were loaded into quartz tubes (100 mm length, 1.1 mm inside diameter, and 1.6 mm outside diameter, VitroCom) and hand-frozen in liquid nitrogen for later experiments.
EPR and DEER Spectroscopy.
Continuous-wave EPR measurements were performed at X-band (9.8 GHz) using an Elexsys E500 spectrometer with a superhigh Q resonator (ER4122SHQE). The temperature and microwave power of high-spin spectra were 15 K and 2 mW, respectively (unsaturated conditions), and those of low-spin spectra were 50 K and 0.2 mW, respectively (unsaturated conditions). Q-Band (∼34 GHz) DEER spectra were recorded with a Bruker EN5107D2 EPR/ENDOR probe-head at 30 K by applying a four-pulse sequence with probe pulses (*) and pump pulse (#) as indicated, and T was advanced in 20 ns steps. The probe pulse lengths were 16 and 32 ns for the π/2 and π pulses, respectively. The length of the π pulse at the pump frequency was determined by nutation experiments, usually at either 16 or 20 ns. The frequency difference between the pump and probe pulse was 80 MHz.55 Thirty-two-step phase cycling was used to remove any unwanted echo. DeerAnalysis2013 was used to analyze DEER data.56 After background subtraction, least-squares fits were performed using Tikhonov regularization with L-curve selection to suppress artifact peaks and oversmoothing (Figures S3−S6).57
Experiments to exclude the effects of orientation selection were performed. Different orientations of the nitroxide were excited by a series of DEER measurements at intervals of the probe and pump frequency (90, 80, 70, and 60 MHz).58 During these experiments, the pump frequency was kept at the maximum absorption of the nitroxide field-swept echo spectrum (Figures S7−S9).
Molecular Dynamics Simulations.
Starting structures for MD simulations were obtained from the RCSB for closed P450cam [Protein Data Bank (PDB) entry 2CPP], open P450cam (PDB entry 4JX1, with Pdx, camphor, and hydroxycamphor removed), and the open P450cam−Pdx complex (PDB 4JX1, hydroxycamphor replaced with camphor). All crystallographic water molecules were retained in the simulation. In addition, each system was solvated in a truncated octahedral water box with TIP3P waters using a 10 Å cushion, and potassium or chloride ions were added to neutralize the system. The B3LYP/6–31G* level of theory was used to calculate geometry optimization and the electrostatic potential for the heme moiety and Fe2−S2 cluster, and force-field parameters were built by MCPB.py in AmberTools. The force-field and charge parameters for camphor were calculated by using the Antechamber package59 with the BCC charge fitting method.60,61 The molecular structure of BSL was obtained from the PDB (3L2X).62 To calculate atomic partial charges for BSL and its attached cysteine residues, two cysteines were attached to the BSL through disulfide bonds and capped with ACE and NME on the N- and C-termini of cysteines, respectively.63 The geometry optimization and the electrostatic potential of the whole molecule were calculated with the Gaussian09 program at the Hartree−Fock level with the 6–31G* basis set, and the Antechamber package was used for RESP charge fitting.64
The MD simulations were carried out using the GPU compatible Amber1665 with the ff14SB force field.66 Each simulation started with energy minimization and a steepest descent algorithm for 10000 steps with 100 kcal mol−1 Å−2 harmonic restraints first on the entire protein and then on heavy atoms only, followed by another energy minimization without restraints to minimize the entire system. The system was then gradually annealed to 300 K with a Langevin thermostat with a 2.0 ps−1 collision frequency. After a 7 ns equilibration with gradually weaker restraints, the production run was conducted for 100 ns at a constant pressure (1 atm) employing periodic boundary conditions. The nonbonded interaction cutoff was 10.0 Å, and the hydrogen bonds were constrained by the SHAKE algorithm.67 For BSL-labeled systems, distance restraints were applied to maintain the DEER-observed distance during equilibration and production runs, followed by a gradual restraint release and another 100 ns production run without restraints.
Data Analysis and Dynamical Network Analysis of MD Trajectories.
MD trajectories were analyzed by using CPPTRAJ.65 The root-mean-square deviation (RMSD) was calculated using the crystal structures as the reference. Cluster analysis was performed using the average-linkage method, and the coordinate RMSD was the distance metric. The analysis stops when either five clusters are reached or the minimum distance between clusters is 3.0 Å.68
Dynamic network analysis was performed by the Network-View plugin in VMD.69 In this analysis, either Cα, Cβ, or the center of mass of each residue is defined as a node. An edge was generated between nodes if their distance is <4.5 Å over 75% of the 100 ns MD trajectory. The correlation between the two nodes is calculated by normalized covariance: , where is the deviation of the ith node Cartesian position at time t to its time average. The weight of the edge (as the width in the network figure) is defined as , which depends on the correlated motion between nodes. To classify the community of substructures in the dynamic network, the Girvan−Newman algorithm was applied. The nodes belonging to the same community are shown in the same color code. To simplify community substructures, the generated communities maintain a modularity of 95%.70
RESULTS
Role of Specific Pdx Residues in Effector Function.
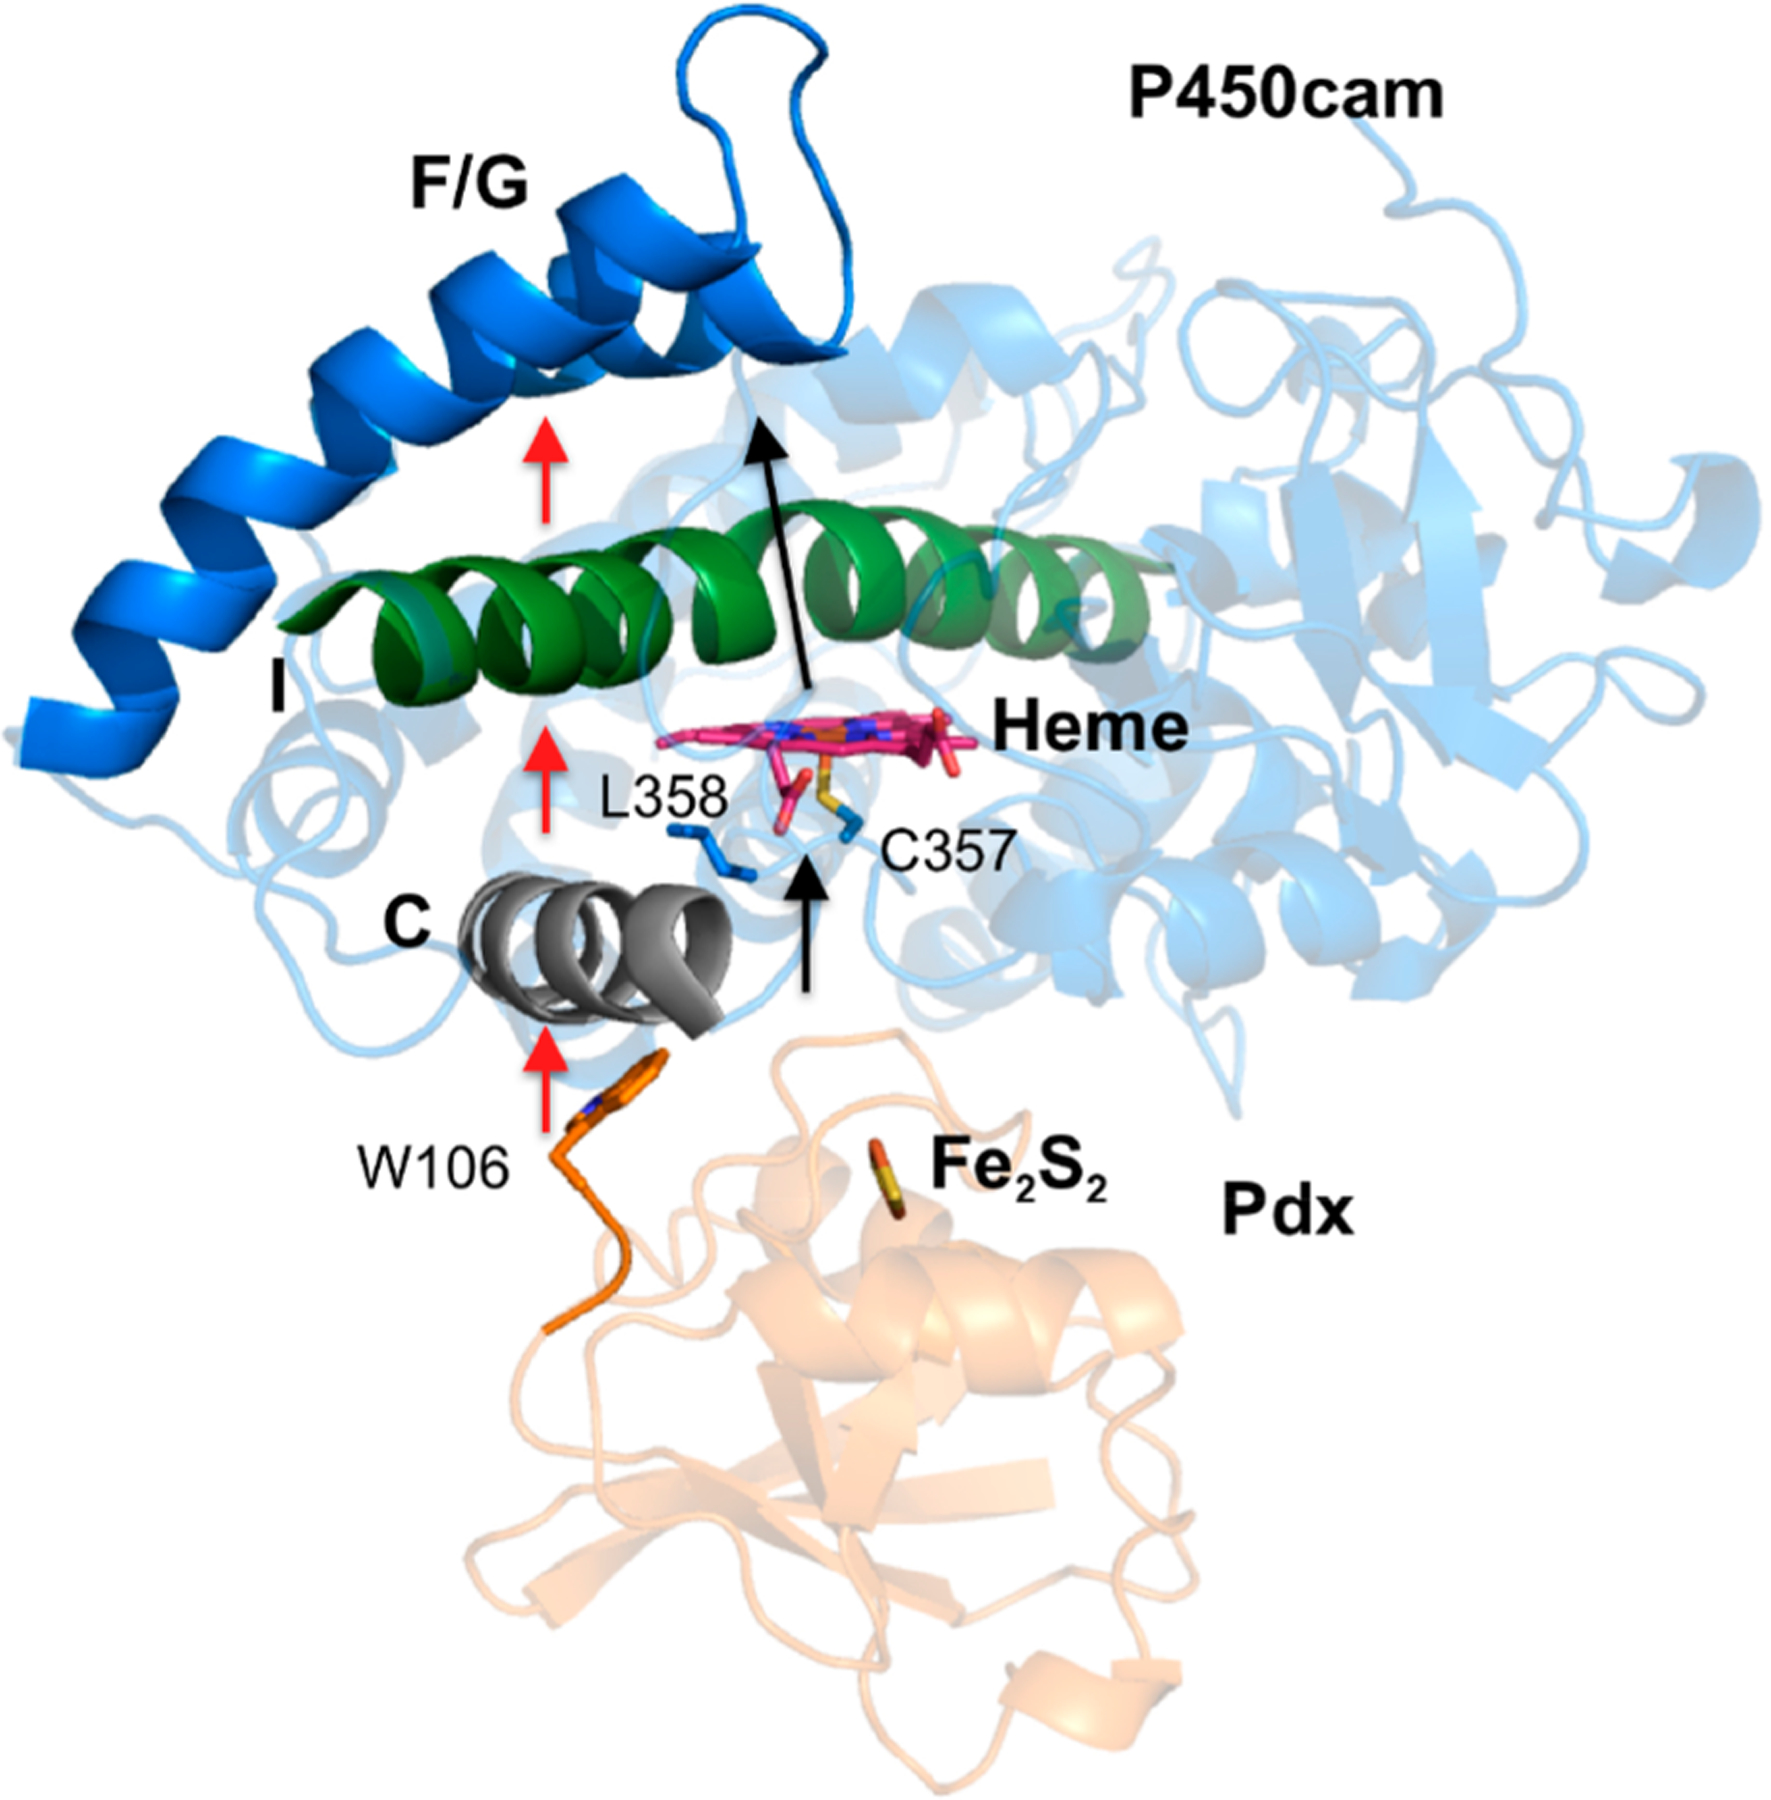
A number of studies have identified residues of Pdx that are important for electron transfer to P450cam. For example, PdxD38 forms a salt-bridge interaction with P450camR112,27and the mutation of this residue affects the efficiency of electron transfer.49 In addition, the interactions between PdxW106 and residues N116, A113, and R109 of P450cam are important features in the P450cam−Pdx complex. Two Pdx mutants, D38A and W106A, were reported to dramatically lower the second electron transfer and/or the binding constant with respect to P450cam.49 We thus examined the effector role of these Pdx mutants by continuous-wave (CW) EPR and pulsed DEER experiments. Two monofunctional spin-labels (MTSL) were attached to P450cam at residues S48C and S190C (named MTSL-P450cam), which has been established as a useful probe pair for monitoring the open/closed state of the P450cam substrate access channel (Figure 2 and Table 1).22,29 CW EPR spectra in Figure S10 show that an addition of an equimolar amount of either PdxD38A or PdxW106A causes camphor-bound MTSL-P450cam to undergo approximately 50% conversion from the high-spin to low-spin state, in contrast to wild-type Pdx, which induces a nearly complete conversion. This suggests that the binding affinity of these Pdx mutants for P450cam is weaker than for wild-type Pdx, yet both mutants still induce an effect on the distal heme environment resulting in a partial spin state conversion.71 Wild-type Pdx plays an effector role for P450cam, resulting in conversion of the closed camphor-bound P450cam to the open form.28,29 The DEER data in Figure 3 show that addition of either PdxD38A or PdxW106A to camphor-bound MTSL-P450cam gives the most probable distance of 48.5 Å, matching the distance of 48.4 Å for the closed form and distinct from the distance of 55.1 Å as seen in the open form. This is in marked contrast to the demonstrated effect of wild-type Pdx, which causes conversion of the closed to the open state.27–29 Thus, the effector function of Pdx to induce conversion to the open state is abolished in the PdxD38A and PdxW106A mutants.
Figure 2.
Spin-label pair of positions at residues S48 and S190 on P450cam to probe movements of helices F/G. The Cα and Cβ atoms of S48 and S190 are shown as blue and yellow spheres, respectively. The mutant D38 and W106 residues on Pdx are shown as orange sticks. The heme and iron−sulfur cluster are shown as magenta sticks.
Table 1.
Notations of P450cam Variants for Monofunctional or Bifunctional Spin Labeling on Helices FG, A/C, C/D, and A/J
| spin-labeled P450cam variant | spin-labeled positions |
|---|---|
| MTSL-P450cam | S48 and S190 |
| BSL-AC | N33/S35, helix A; Q110/A113, helix C |
| BSL-CD | Q110/A113, helix C; C136/E140, helix D |
| BSL-AJ | N33/S35, helix A; Q272/E276, helix J |
Figure 3.
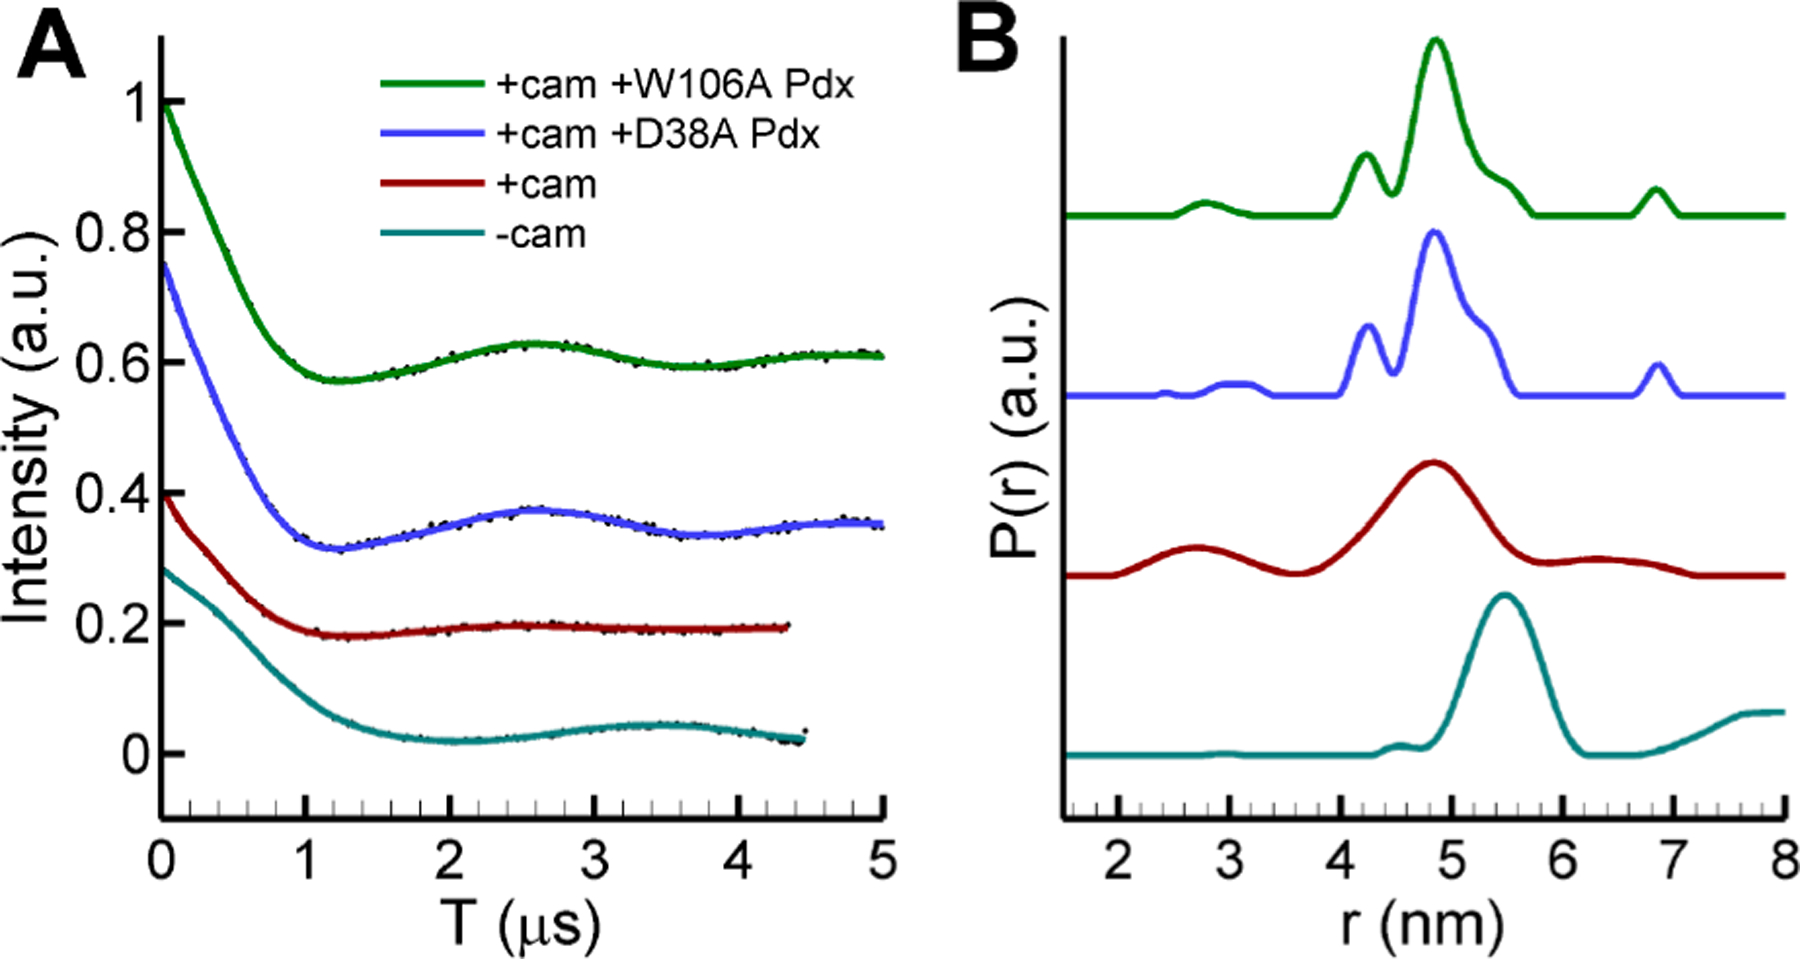
(A) Time-domain data and (B) distance distributions of the DEER data for PdxW106A- and camphor-bound P450cam (green), PdxD38A- and camphor-bound P450cam (blue), the closed form of camphor-bound P450cam (red), and the open form of camphor-free P450cam (cyan). P450cam was labeled with MTSL at residues 48 and 190 to monitor movements of helices F/G.
Effector-Induced Movements of Helices A, C, D, and J of P450cam.
To monitor movements of specific structural elements of P450cam upon Pdx binding, four separate sites were chosen to introduce bifunctional spin-labels (BSL).72 BSL spin-labels were introduced pairwise at these sites to probe movements between them (Table 1 and Figure 4). The first, denoted BSL-AC, contained a spin-label on helix A (N33C and S35C) and on helix C (Q110C and A113C). It is noted that Ala113 makes direct contact with Pdx, so this label pair should be useful in detecting binding of Pdx to the proximal face of P450cam. The second pair, denoted BSL-CD, contains labeling sites on helix C (Q110C and A113C) and helix D (C136 and E140C). A third pair, BSL-AJ, contained labeling sites on helix A (N33C and S35C) and helix J (Q272C and E276C) as a control because these two sites are not expected to move in response to Pdx binding. Mass spectra of these labeled proteins (Figure S2) verified that two BSL labels are attached in each case, while CW EPR spectra (Figures S11 and S12) show that binding of Pdx to either BSL-AC or BSL-CD caused conversion of most of the high-spin signal (g ≈ 8) to the low-spin (gz ≈ 2.45) state, which is seen for the wild-type protein.71 Similar results were observed for BSL-AJ (Figure S13). These results demonstrate that the BSL-labeled P450cam proteins do not disrupt the Pdx-induced high- to low-spin conversion of camphor-bound P450cam.29
Figure 4.
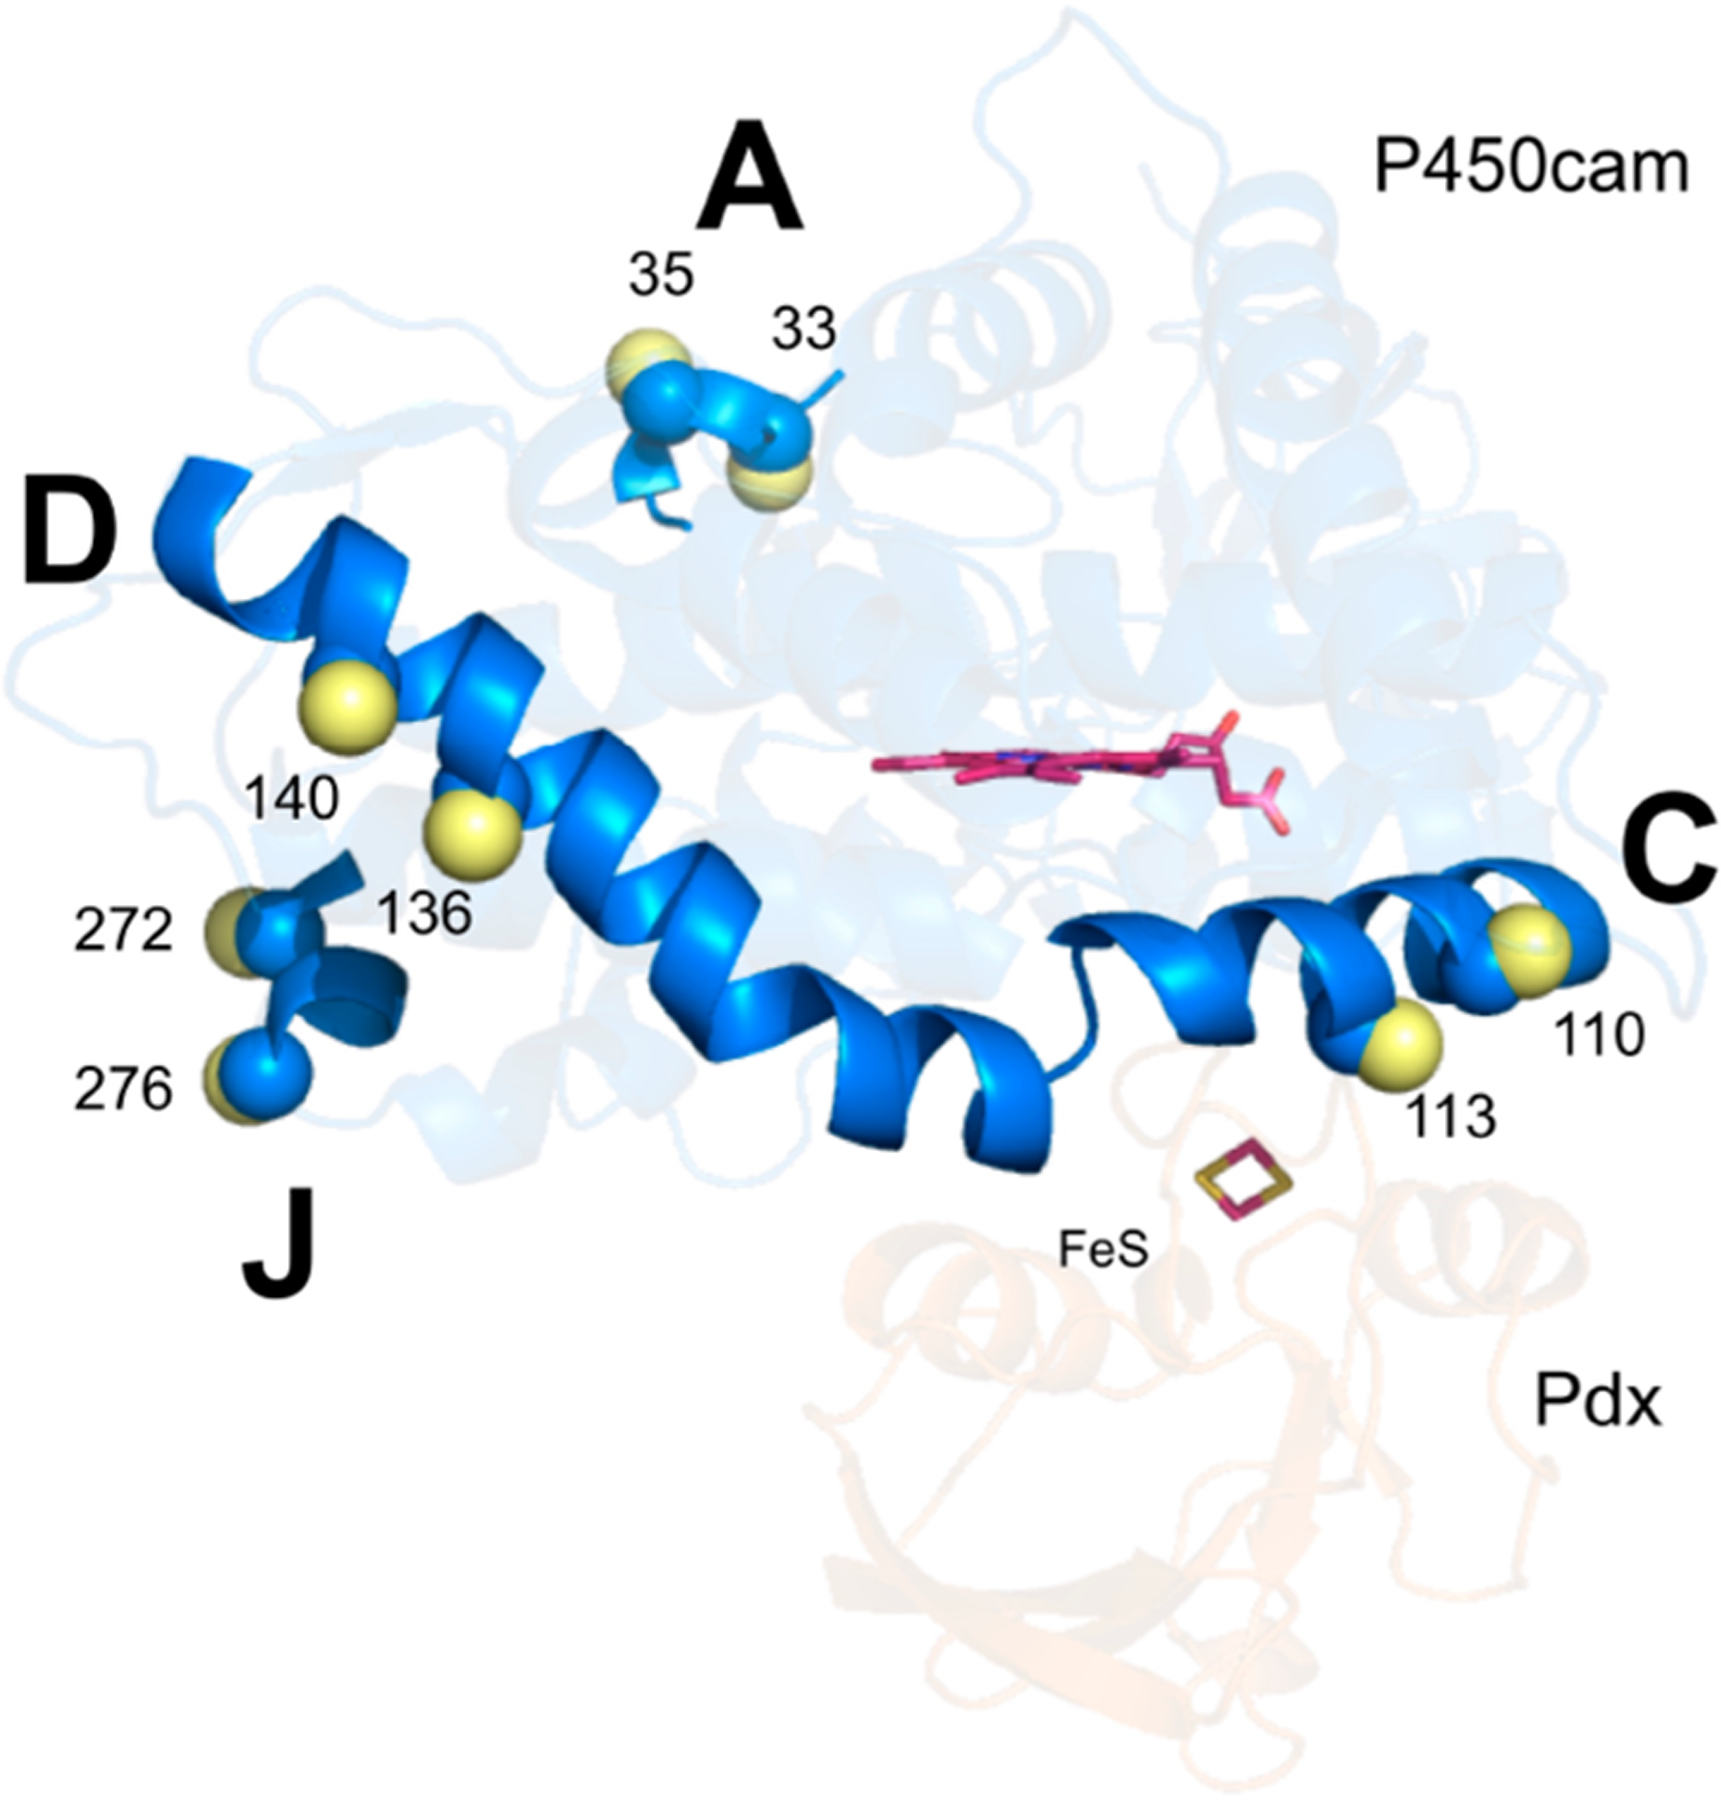
Bifunctional spin labeling on pairs of residues (N33 and S35, Q110 and A113, C136 and E140, and Q272 and E276) on P450cam for probing movements of helices A/C, C/D, and A/J. The Cα and Cβ atoms of each residue are shown as blue and yellow spheres, respectively. The heme and iron−sulfur cluster are shown as magenta sticks.
Shown in Figure 5 are the time-domain DEER data and in Figure 6 are the distance distributions of BSL-AC and BSL-CD in different states. For BSL-AC, the distances for open and closed states (54.6 and 54.7 Å, respectively) (Table 2) indicate that helices A and C do not move relative to each other during the open to closed transition in the absence of Pdx. However, Figure 6 shows that binding of Pdx to the camphor-bound BSL-AC results in a distance at 55.5 Å, which is 1 Å longer than that in the open state in the absence of Pdx. It is important to note that the data of Figures 5 and 6 contain repeated measurements, using different batches of purified protein. Thus, while small, the 1 Å shift seen for binding of Pdx to BSL-AC is reproducible. In addition, a series of DEER measurements of BSL-AC with different probe−pump frequency differences show no significant orientation selection effects (Figures S7−S9). The control pair data, BSL-AJ, shown in Figure 7 and Table 2 gave distances of 40.0, 40.1, and 40.0 Å for each of the open, closed, and Pdx-bound states, showing that no movements were seen between helices A and J for these states. As shown in Figure 5B, Figure 6B, and Table 2, much larger changes were seen for BSL-CD. When camphor binds to open state P450cam to form the closed conformation, the distance between the helix C and D probes changes from 41.3 to 44.6 Å. This 3.3 Å shift is not observed by crystallography as measured between Cα atoms. Addition of Pdx to camphor-bound P450cam causes a further shift to 39.4 Å, which is 1.8 Å shorter than the open state distance.
Figure 5.
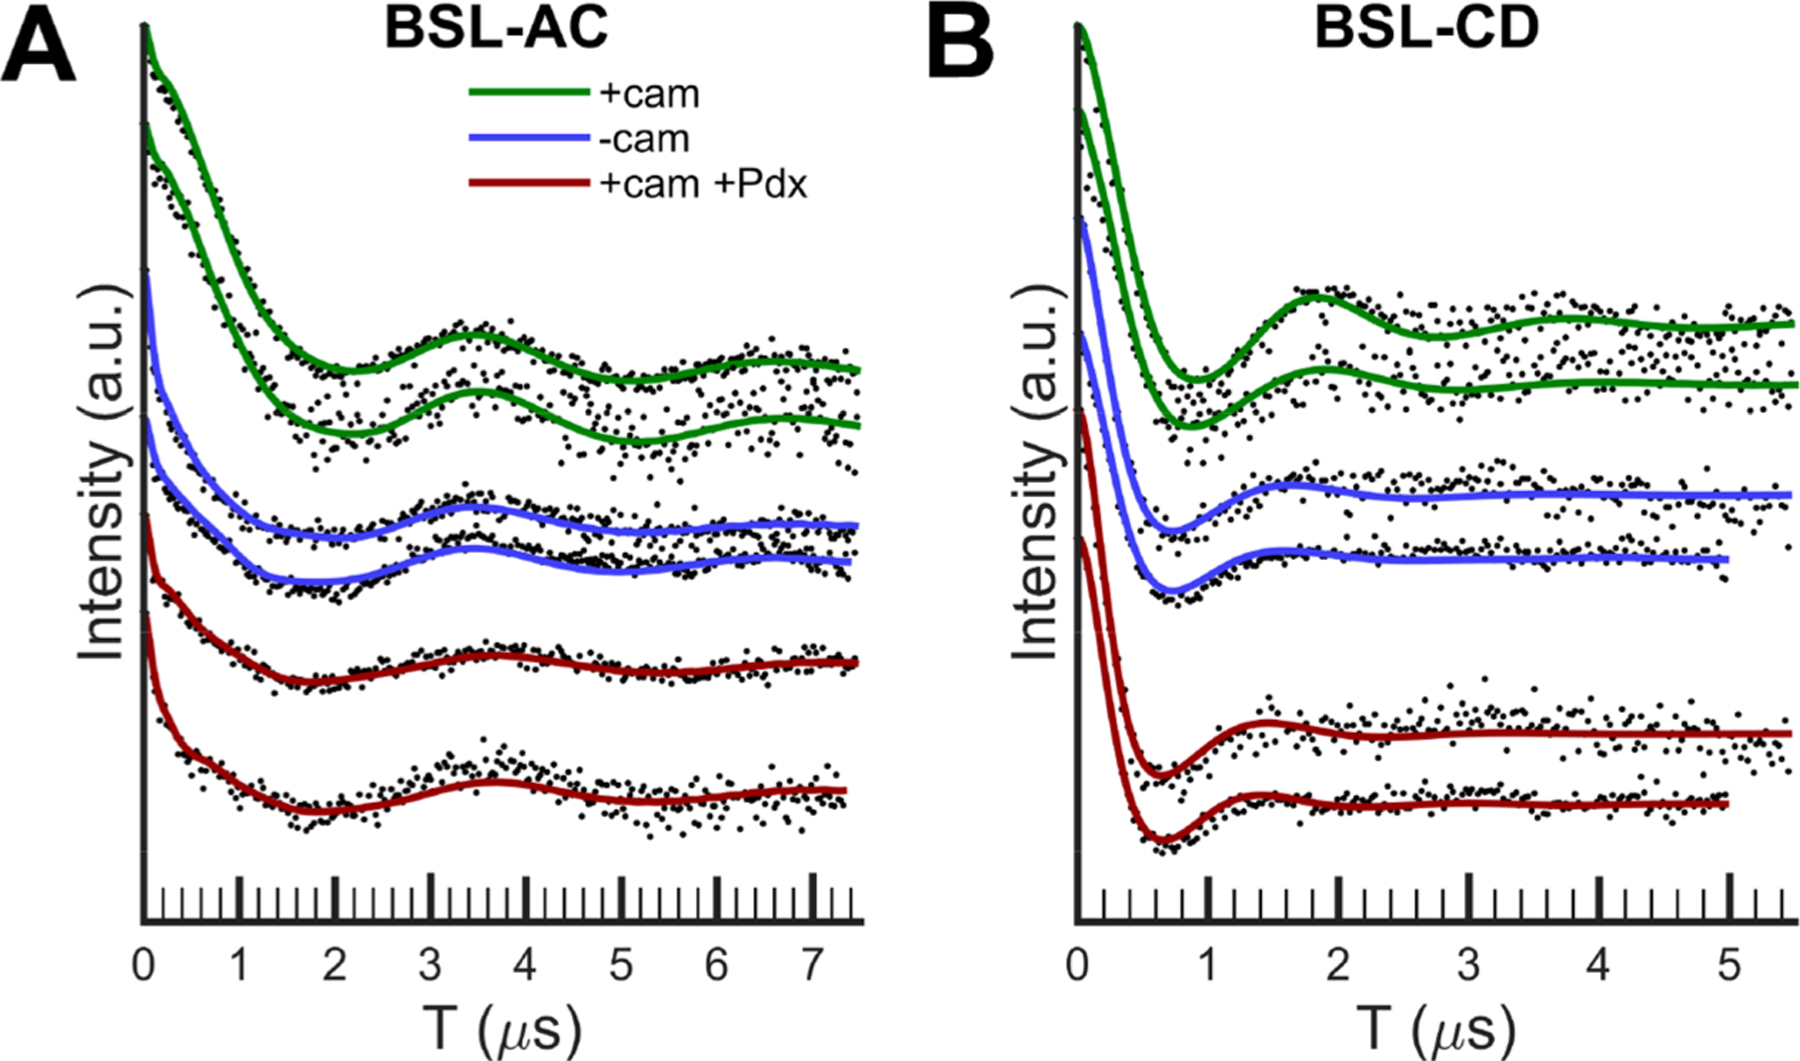
Time-domain data after background subtraction of the DEER measurements for (A) P450cam BSL-AC and (B) BSL-CD in the camphor-bound (green), camphor-free (blue), and camphor- and Pdx-bound (red) states. Data analysis is shown in the Supporting Information. The two data sets with the same color represent independent measurements on separate protein batches.
Figure 6.
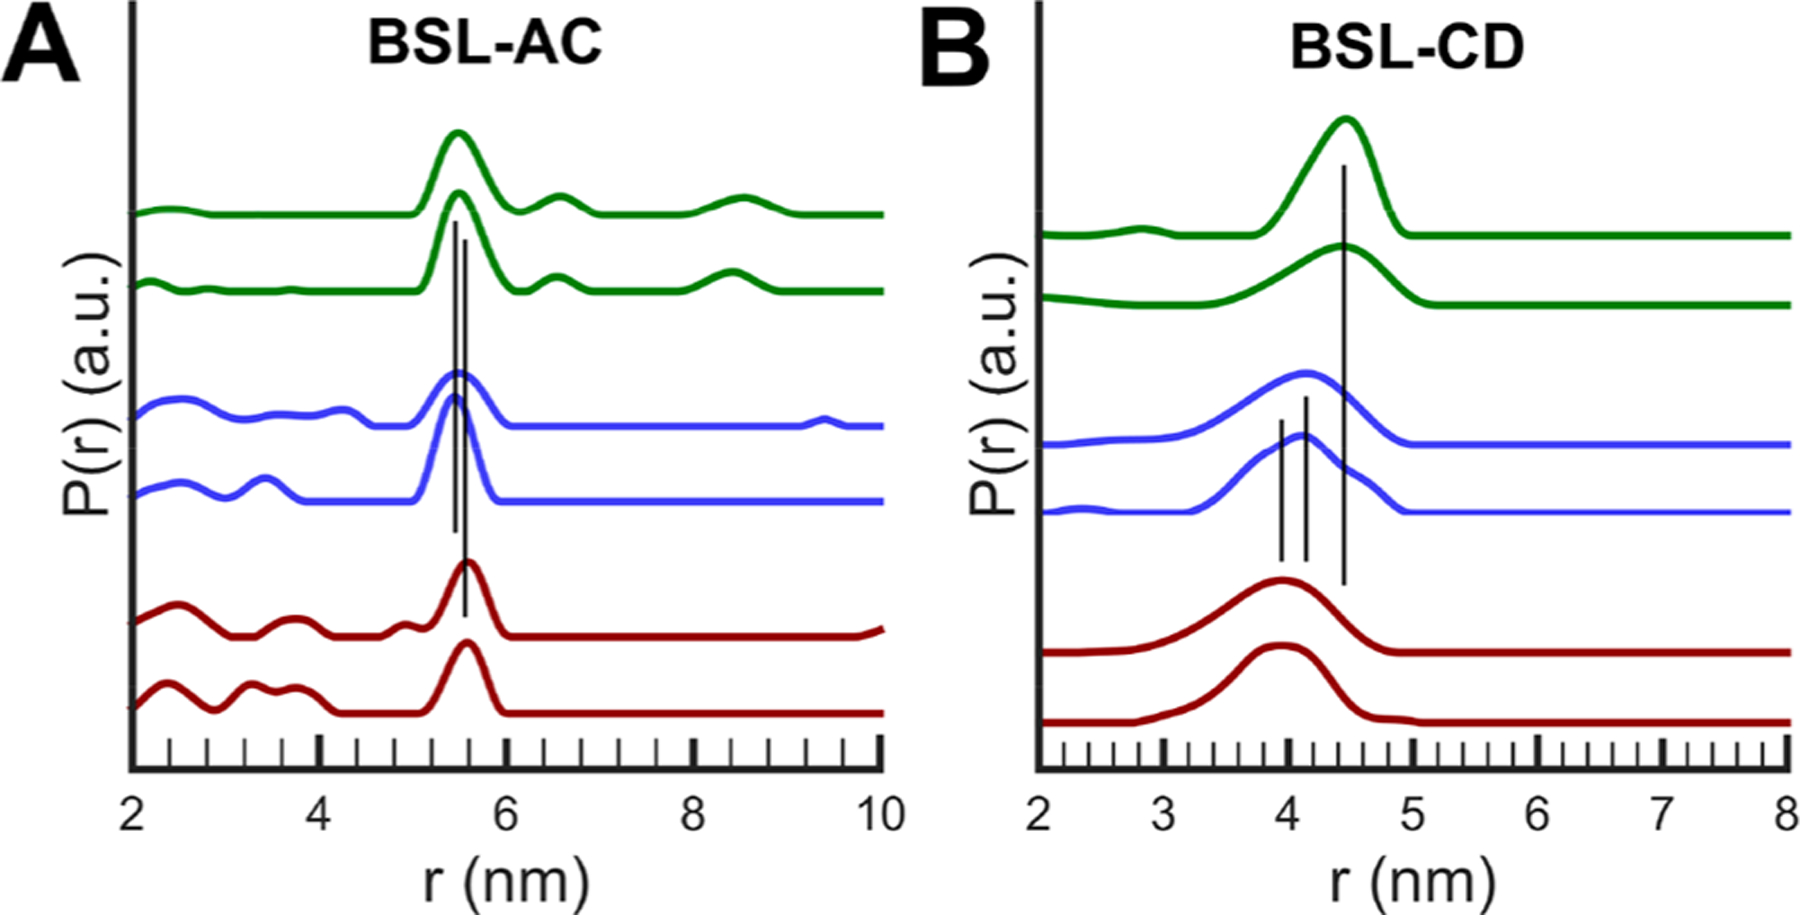
Distance distributions for the DEER data of Figure 5 for (A) BSL-AC and (B) BSL-CD. The color scheme is the same as in Figure 5. The two data sets with the same color represent independent measurements on different protein batches.
Table 2.
Distances for BSL-AC, BSL-CD, and BSL-AJ P450cam in Various Conformational States, Measured from DEER, Crystal Structures, and MD Simulationsa
| state | BSL-CD distance (Å) |
BSL-AC distance (Å) |
BSL-AJ distance (Å) |
|||||
|---|---|---|---|---|---|---|---|---|
| crystal | DEER | MD | crystal | DEER | MD | crystal | DEER | |
| P450cam with cam | 36.7 | 44.6(4) | 45.2(3) | 43.1 | 54.7(4) | 54.2(6) | 32.84 | 40.1(1) |
| P450cam | 36.4 | 41.3(2) | 43.4(4) | 42.4 | 54.6(3) | 53.5(3) | 32.54 | 40.0(0) |
| P450cam with cam and Pdx | 35.8 | 39.4(9) | 41.0(3) | 42.9 | 55.5(6) | 55.8(9) | 32.76 | 40.0(0) |
DEER distance standard deviations (shown in parentheses) were calculated from three separate measurements, two from different protein batches and one from a repeated measurement of the same sample. The standard deviations for MD distances are based on three separate production runs, with the distances measured between the two nitrogen atoms of the spin-label. The distances from crystal structures are the distances between Cα atoms at Q110 and S35 (BSL-AC), at Q110 and C136 (BSL-CD), or at S35 and E276 (BSL-AJ) using PDB entries 3L61, 3L63, and 4JWS.
Figure 7.
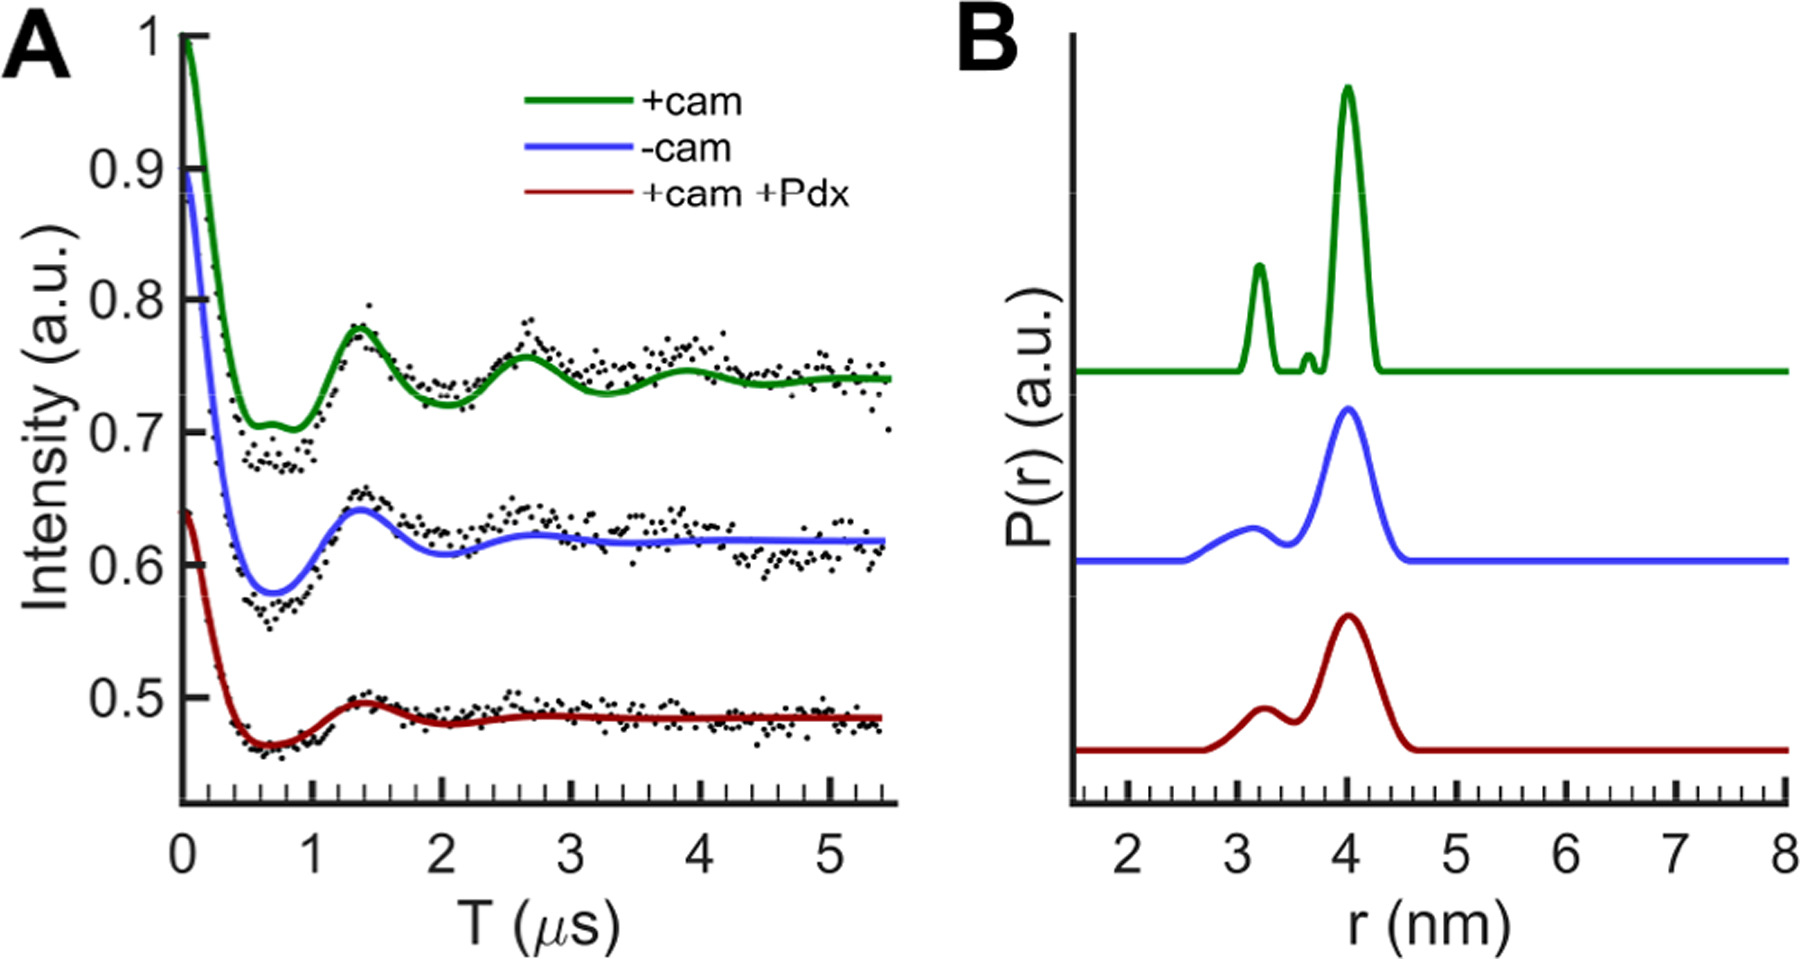
(A) DEER spectra and (B) distance distributions of P450cam BSL-AJ in different states. Data analysis is shown in the Supporting Information. The minor distance distribution at 3.1 nm may due to the orientation selection effect.
Molecular Dynamics Simulations and Dynamic Network Analysis.
To account for the observed DEER distances and their changes, molecular dynamics simulations were performed for P450cam in the closed, open, and Pdx complex states. MD simulations were performed on both unlabeled protein and on protein labeled on helices A, C, and D. Compared with those of the unlabeled proteins with crystal structures, the distances between Cα atoms at S35 and E276 (on helices A and J) in our simulations are essentially identical to the crystallographic distances in the closed and open states. The crystal and MD distances are 32.8 and 32.9 Å in the closed state, respectively, and 32.8 and 32.9 Å in the open state, respectively, and this is why helices A and J were designed as a control pair. For BSL-AC and BSL-CD, the distance distributions between pairs of nitrogen atoms of the spin-label from the MD trajectories were compared with distances measured by DEER. Table 2 and Figure 8 show that the MD distances are in good general agreement with our DEER observations. In addition, crystallographic distances between Cα atoms at the labeling site are included in Table 2. In particular, MD simulations predict that the A−C label distance changes only slightly upon the closed−open transition but increases by 1.6 Å upon binding of Pdx. This result is consistent with our DEER results but is not observed in crystal structures of these states. In addition, the MD simulations predict that the C−D distance becomes 1.8 Å shorter during the closed−open transition, and this distance is 4.2 Å shorter still upon binding of Pdx compared to that of the camphor-bound closed state.
Figure 8.
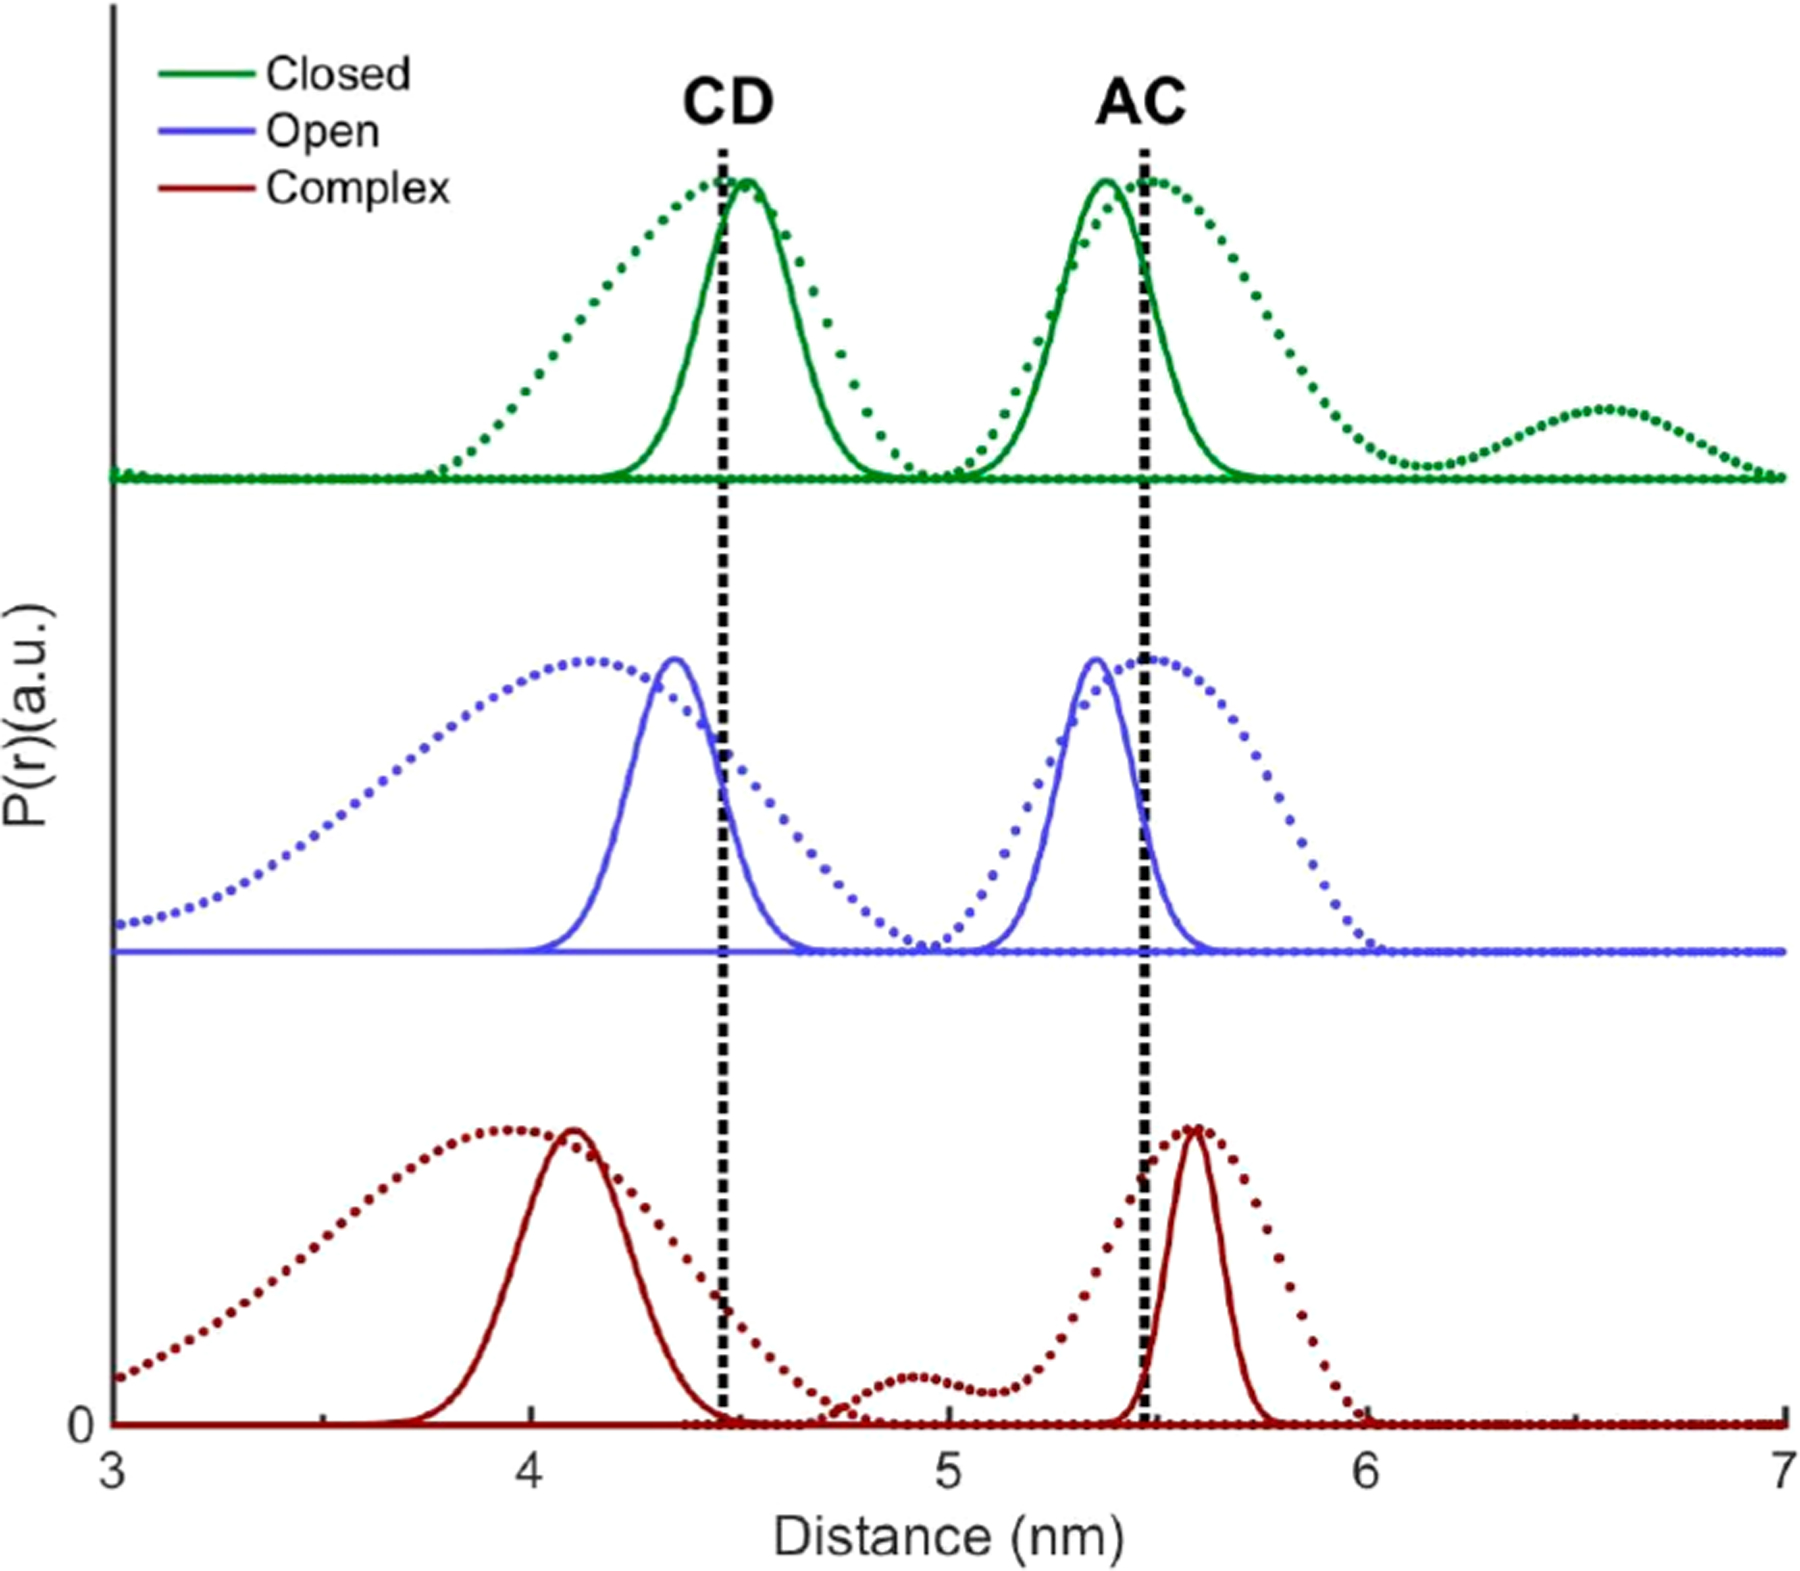
Comparison of MD distance distributions (solid curves) of P450cam BSL-CD and BSL-AC with their corresponding main DEER peaks (dotted curves) for different states, the camphor-bound (green), camphor-free (blue), and camphor- and Pdx-bound (red) states. The dashed lines indicate DEER distances at the distance distribution peaks for closed states of BSL-CD and BSL-AC.
To better understand the protein backbone and BSL movements, cluster analysis of the MD trajectories was performed to obtain representative structures for different states. In Figure 9, small shifts in the helix C and D spin-labels were observed between the closed and open conformations, contributing to the change in the BSL-CD distances as seen by DEER experiments. The movements result from a combination of small helix backbone and spin-label rotamer changes. After Pdx binding, the BSL on helix C was perturbed by the direct contact with Pdx. This direct steric contact with the C-terminus of Pdx causes a significant BSL side-chain movement and is accompanied by movement of helix C as observed between closed and open states.
Figure 9.
Movements of BSL and helices C/D induced by Pdx binding in MD structures. The BSL spin-label groups in the closed (camphor-bound, green), open (camphor-free, blue), and complex (camphor- and Pdf-bound, brown) states are shown as sticks. PdxW106 perturbed the BSL on helix C upon binding of Pdx, resulting in a significant BSL side-chain movement. Because P450cam in open and complex states has a similar open conformation, only the most representative structures of MD trajectories from cluster analysis in the closed and complex states are compared and shown as green and brown cartoons, respectively. The dashed lines indicate the BSL-AC and CD distances between nitroxide nitrogen atoms in closed, open, and complex states.
Although Pdx binding induces a small conformational change in helices C and D, how these movements are coupled to the closed−open conformational change in distal helices F/G is of significant interest. Thus, dynamic network analysis was applied to the MD trajectories to reveal correlations in the movements of specific sites in the protein structure. Correlation and principal component analysis of MD simulations have been carried out by Carma73 to determine the correlated motion between residues that may suggest a pathway for allosteric communication in proteins. In a recent review, we reported that helices F and G merge into the same community with helices C, H, and I when Pdx binds to the proximal site of P450cam.47 In this study, to elucidate the pathway for the Pdx-induced effector function, the center of mass of each residue was considered as a node to calculate a contact map, which was then used to probe the critical side-chain mobility and interactions between helices. On the basis of this analysis, the residues in P450cam and Pdx with highly correlated motions were obtained and are listed in Table 3. A previous study has suggested that the interactions involving PdxW106 are crucial to regulate the conformational change of P450cam27 thus was considered as a “source” of the communication pathway in this event. To determine the linkage from Pdx to helix G, residue Y201 in P450cam, a residue in the center of helix G, was chosen as a “sink” of the pathway. As initial and final nodes were assigned, the predominant path from the dynamical network matrix then can be extracted from the contact map. This analysis indicates a pathway for transmission of the structural change occurs through PdxW106, helices C, B′, I, and G, as shown in Figure 10. Although some edges between the helix interfaces may vary slightly due to node selection (Cα or Cβ atoms as the nodes), similar allosteric regulation paths were obtained for different node selections (Figure S14). Furthermore, principal component analysis (PCA) was performed to characterize the large-scale motion of P450cam and Pdx in the complex state, and the first principal mode of motion (PC1) is shown in Figure 11 and Movie 1, where the arrows represent the direction and relative amplitude of the motion. This result indicates a larger movement of helices F and G is coupled to a smaller amplitude of motion on helix C, which directly results from interactions with Pdx.
Table 3.
Significant Residue Pairs between P450cam and Pdx, Recognized by Dynamic Network Analysis
| Pdx | P450cam |
|---|---|
| T33 | M121, P122, D125 |
| D38 | R112, L358 |
| C39 | G353, L356 |
| G40 | L356 |
| S42 | G353 |
| S44 | G353, S354 |
| W106 | R109, R112, A113, N116 |
Figure 10.
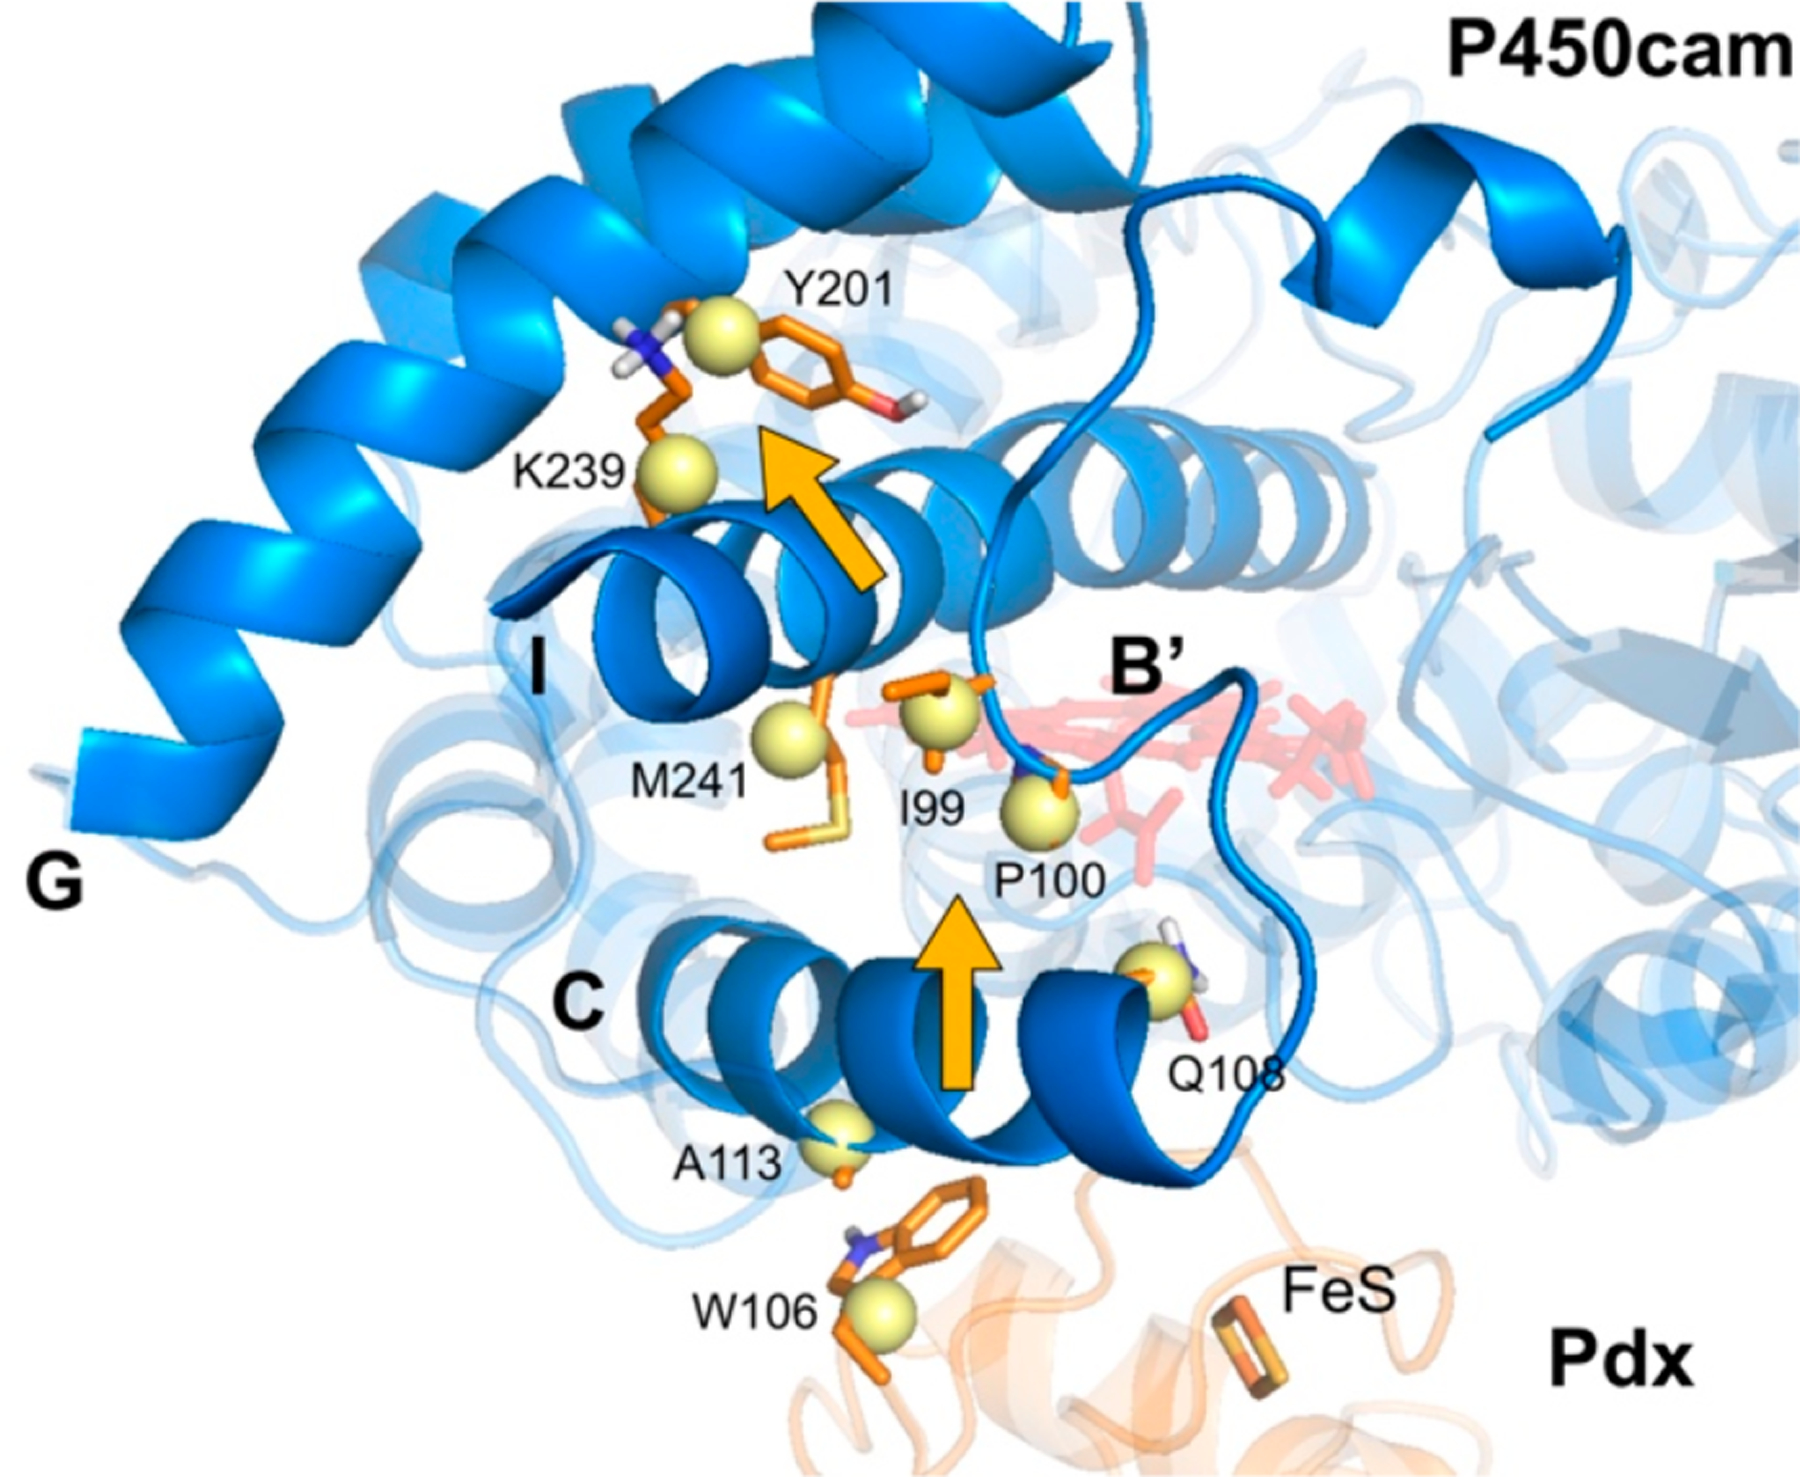
Dynamic network analysis of the wild-type P450cam−Pdx complex. P450cam and Pdx are shown as blue and orange cartoons, respectively. The orange amino acids are directly involved in the coupled movements of PdxW106 to Y201 on helix G of P450cam, and yellow nodes represent the center of mass of the labeled residues. Heme and the iron−sulfur cluster are also shown.
Figure 11.
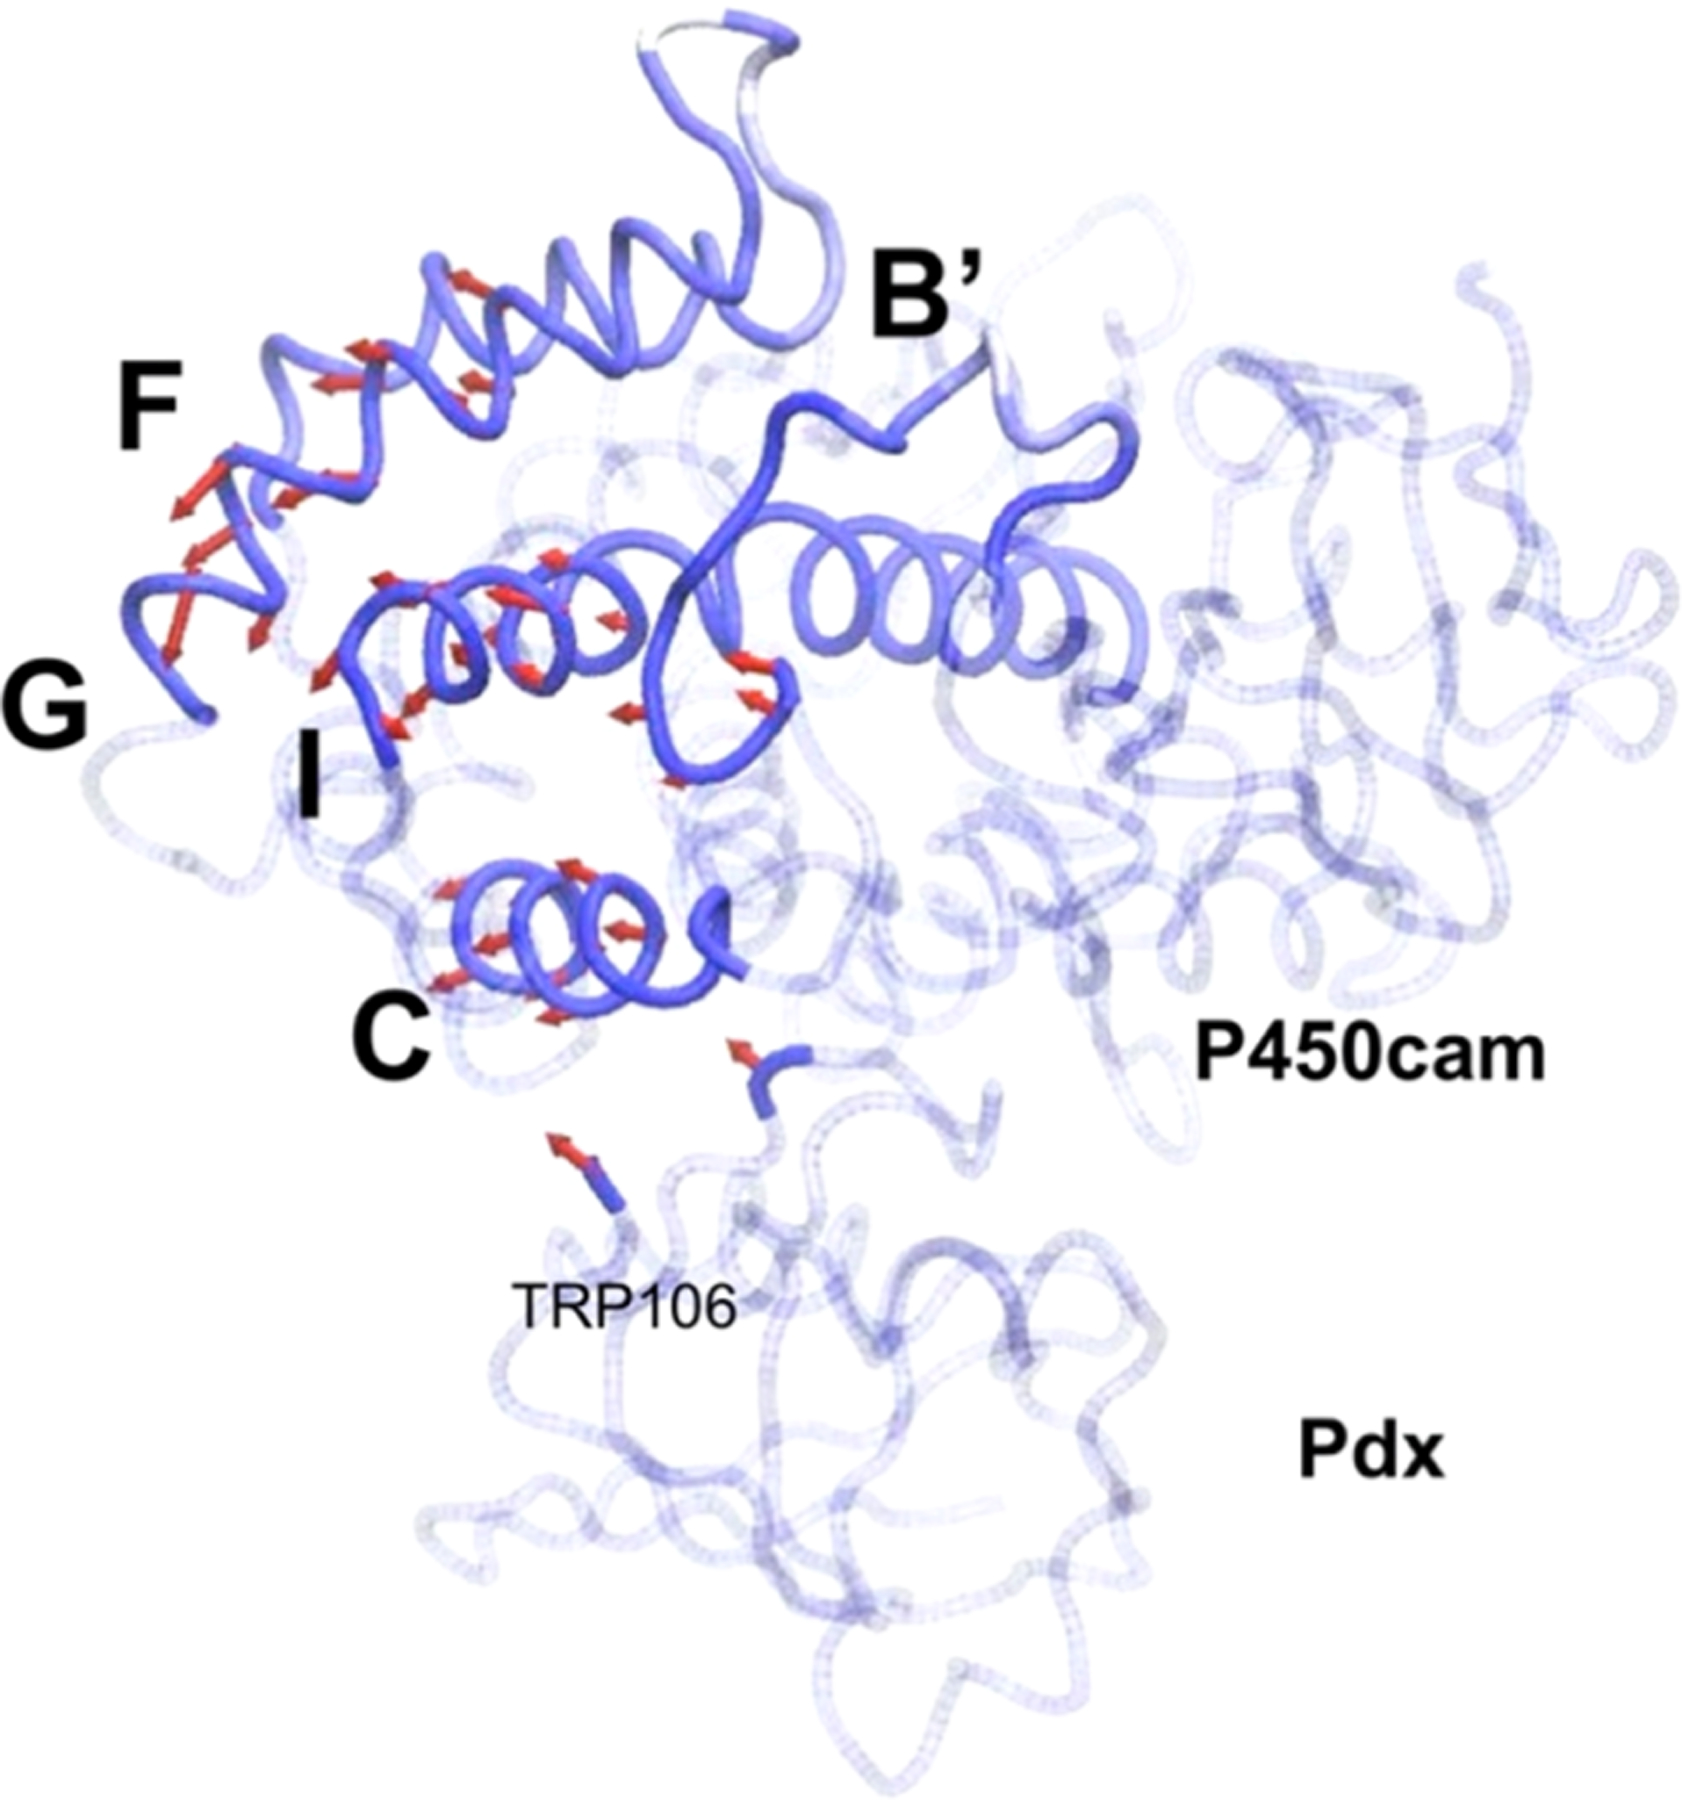
Dynamics of the P450cam−Pdx complex along the first principal mode of motion (PC1). The movement vectors in the P450am−Pdx complex are denoted with red arrows, with the length corresponding to the magnitude, and arrowheads indicate the direction of motion.
DISCUSSION
The effects of Pdx mutants at the interface between Pdx and P450cam that affect electron transfer were studied. The binding of these Pdx mutants to P450cam induces a partial spin state conversion, suggesting weaker binding. However, there is no DEER evidence of a conformational change from the closed to open state as is seen for wild-type Pdx.25,28,29 Thus, the loss of electron transfer in these mutants may result from not attaining the active conformation as suggested by Chuo et al.25
In addition, the measured conformational changes of helix C upon Pdx binding demonstrate Pdx’s effector role in regulating the conformational change of P450cam. The agreement between simulations and experiments sheds light on how this allosteric regulation is transmitted from helix C of P450cam to its F/G helices. The significant 1.8 Å shift of the BSL-CD distance between the open and closed state and the even larger shift of 4.2 Å upon binding of Pdx are features that are not observed by crystallography. This discrepancy may result from the influences of crystal packing forces, which have been shown to prevent the conversion of the open forms to the closed forms upon soaking open state crystals in camphor.29 This substrate-dependent movement of helices C/D might be relevant to previous NMR observations of the ferrous CO form of P450cam,26 although binding of CO to the heme has been demonstrated to prevent the opening on helices F/G.22,29 The role of these movements between helices C and D warrants further study.
The relative movements among helices A, C, D, and J were measured by pairwise DEER measurements, and results indicate only a small 1 Å shift of the BSL-AC distance is observed upon binding of Pdx. MD simulations show minor helix C movement upon binding of Pdx, which is consistent with the small BSL-AC distance shift observed by DEER upon binding of Pdx. MD simulations also indicate the larger shift of the BSL-CD distance is due to the combination of movements in helices C and D and direct interactions between the spin-label side chain on helix C and Pdx. By analyzing MD trajectories, network analysis suggests that Pdx causes its effector role not by a single shift in a structural element but by a complex set at interactions propagating from W106 on Pdx to helices C, B′, I, and G. This extended linkage from the Pdx binding site to the distal active site provides an intriguing proposal for the effector role of Pdx on P450cam function.
It remains unclear whether the most relevant complex to examine for insight into the effector role of Pdx is the reduced form of Pdx bound to ferrous−O2 P450cam, which would exist before electron transfer, or the ferric form of Pdx bound to the ferric−hydroperoxo state of P450cam. The latter is the state that would exist after the second electron transfer but before the enzymatically committed cleavage of the hydroperoxo bond. Neither of these complexes can be easily generated in DEER samples at present. However, we have previously examined various redox and ligand-bound states that each provides insight in its own way. Our study of oxidized Pdx bound to ferrous−CO P450cam29 shows no closed−open conversion by DEER but is most relevant to the states that can be studied by NMR. These studies40,41 have shown smaller changes involving helices B′, C, and I but no larger changes in helices F and G, in agreement with the DEER results.25,28–30 Our recent study of oxidized Pdx bound to ferric−CN P450cam25 may be most relevant as the ferric−CN complex is likely to be a better model for ferrous−O2 than is ferrous−CO. Most importantly, an intermediate conformation involving changes in the active site near the catalytic water in this form was seen in the ferric−CN complex.25 Further studies of the complex of the ferric−CN complex using probes for movements in helices A, C, D, and I should be very revealing.
CONCLUSIONS
This study has allowed us to reach a number of important conclusions about the Pdx-induced effector function on P450cam. We have examined the details of the Pdx-induced conformational change in P450cam using DEER spectroscopy and MD simulations. These results show that Pdx binding causes small coordinated movements of several regions of P450cam, including helices C, B′, I, G, and F. These changes suggest a mechanism by which the Pdx binding site on the proximal side of the enzyme influences changes in helices F/G on the distal side.
Supplementary Material
ACKNOWLEDGMENTS
S.-H.L. thanks Prof. R. David Britt and the CalEPR center for instrumental and technical support.
Funding
This work is supported by the National Institutes of Health (Grant GM41049 to D.B.G.). S.-H.L. is thankful for the financial support from Prof. Marina Bennati and Prof. Robert A. Coleman.
Footnotes
Contributor Information
Shu-Hao Liou, Department of Chemistry, University of California, Davis, Davis, California 95616, United States; Gruss-Lipper Biophotonics Center, Department of Anatomy and Structural Biology, Albert Einstein College of Medicine, Bronx, New York 10461, United States.
Shih-Wei Chuo, Department of Chemistry, University of California, Davis, Davis, California 95616, United States.
Yudong Qiu, Department of Chemistry, University of California, Davis, Davis, California 95616, United States.
Lee-Ping Wang, Department of Chemistry, University of California, Davis, Davis, California 95616, United States.
David B. Goodin, Department of Chemistry, University of California, Davis, Davis, California 95616, United States
REFERENCES
- (1).Sono M, Roach MP, Coulter ED, and Dawson JH (1996) Heme-Containing Oxygenases. Chem. Rev 96, 2841–2887. [DOI] [PubMed] [Google Scholar]
- (2).Poulos TL (2014) Heme enzyme structure and function. Chem. Rev 114, 3919–3962. [DOI] [PMC free article] [PubMed] [Google Scholar]
- (3).Ortiz de Montellano PR (2010) Hydrocarbon hydroxylation by cytochrome P450 enzymes. Chem. Rev 110, 932–948. [DOI] [PMC free article] [PubMed] [Google Scholar]
- (4).Poulos TL (2005) Structural biology of heme monooxygenases Biochem. Biophys. Res. Commun 338, 337–345. [DOI] [PubMed] [Google Scholar]
- (5).Teng L, Fan X, Nelson DR, Han W, Zhang X, Xu D, Renault H, Markov GV, and Ye N (2019) Diversity and evolution of cytochromes P450 in stramenopiles. Planta 249, 647–661. [DOI] [PubMed] [Google Scholar]
- (6).Denisov IG, Makris TM, Sligar SG, and Schlichting I (2005) Structure and Chemistry of Cytochrome P450. Chem. Rev 105, 2253–2277. [DOI] [PubMed] [Google Scholar]
- (7).Nelson DR (2009) The cytochrome P450 homepage. Hum. Genomics 4, 59–65. [DOI] [PMC free article] [PubMed] [Google Scholar]
- (8).Poulos TL, Finzel B, Gunsalus IC, Wagner GC, and Kraut J (1985) The 2.6-A crystal structure of Pseudomonas putida cytochrome P-450. J. Biol. Chem 260, 16122–16130. [PubMed] [Google Scholar]
- (9).Poulos TL, Finzel BC, and Howard AJ (1987) High resolution crystal structure of cytochrome P450cam. J. Mol. Biol 195, 687–700. [DOI] [PubMed] [Google Scholar]
- (10).Sevrioukova IF, and Poulos TL (2011) Structural biology of redox partner interactions in P450cam monooxygenase: a fresh look at an old system. Arch. Biochem. Biophys 507, 66–74. [DOI] [PMC free article] [PubMed] [Google Scholar]
- (11).Tyson CA, Lipscomb JD, and Gunsalus IC (1972) The role of putidaredoxin and P450cam in methylene hydroxylation. J. Biol. Chem 247, 5777–5784. [PubMed] [Google Scholar]
- (12).Sevrioukova IF, Garcia C, Li H, Bhaskar B, and Poulos TL (2003) Crystal structure of putidaredoxin, the [2Fe-2S] component of the P450cam monooxygenase system from Pseudomonas putida. J. Mol. Biol 333, 377–392. [DOI] [PubMed] [Google Scholar]
- (13).Sevrioukova IF (2005) Redox-dependent structural reorganization in putidaredoxin, a vertebrate-type [2Fe-2S] ferredoxin from Pseudomonas putida. J. Mol. Biol 347, 607–621. [DOI] [PubMed] [Google Scholar]
- (14).Schlichting I, Berendzen J, Chu K, Stock AM, Maves SA, Benson DE, Sweet RM, Ringe D, Petsko GA, and Sligar SG (2000) The catalytic pathway of cytochrome P450cam at atomic resolution. Science 287, 1615–1622. [DOI] [PubMed] [Google Scholar]
- (15).Macdonald IDG, Sligar SG, Christian JF, Unno M, and Champion PM (1999) Identification of the Fe-O-O Bending Mode in Oxycytochrome P450cam by Resonance Raman Spectroscopy. J. Am. Chem. Soc 121, 376–380. [Google Scholar]
- (16).Nagano S, and Poulos TL (2005) Crystallographic study on the dioxygen complex of wild-type and mutant cytochrome P450cam. Implications for the dioxygen activation mechanism. J. Biol. Chem 280, 31659–31663. [DOI] [PubMed] [Google Scholar]
- (17).Spolitak T, Dawson JH, and Ballou DP (2005) Reaction of ferric cytochrome P450cam with peracids: kinetic characterization of intermediates on the reaction pathway. J. Biol. Chem 280, 20300–20309. [DOI] [PubMed] [Google Scholar]
- (18).Rittle J, and Green MT (2010) Cytochrome P450 compound I: capture, characterization, and C-H bond activation kinetics. Science 330, 933–937. [DOI] [PubMed] [Google Scholar]
- (19).Davydov R, Dawson JH, Perera R, and Hoffman BM (2013) The use of deuterated camphor as a substrate in (1)H ENDOR studies of hydroxylation by cryoreduced oxy P450cam provides new evidence of the involvement of compound I. Biochemistry 52, 667–671. [DOI] [PMC free article] [PubMed] [Google Scholar]
- (20).Yosca TH, and Green MT (2016) Preparation of Compound I in P450cam: The Prototypical P450. Isr. J. Chem 56, 834–840. [Google Scholar]
- (21).Lee YT, Wilson RF, Rupniewski I, and Goodin DB (2010) P450cam visits an open conformation in the absence of substrate. Biochemistry 49, 3412–3419. [DOI] [PMC free article] [PubMed] [Google Scholar]
- (22).Stoll S, Lee YT, Zhang M, Wilson R, Britt RD, and Goodin DB (2012) Double electron-electron resonance shows cytochrome P450cam undergoes a conformational change in solution upon binding substrate. Proc. Natl. Acad. Sci. U. S. A 109, 12888–12893. [DOI] [PMC free article] [PubMed] [Google Scholar]
- (23).Basom EJ, Maj M, Cho M, and Thielges MC (2016) Site-Specific Characterization of Cytochrome P450cam Conformations by Infrared Spectroscopy. Anal. Chem 88, 6598–6606. [DOI] [PubMed] [Google Scholar]
- (24).Lee YT, Glazer EC, Wilson RF, Stout CD, and Goodin DB (2011) Three clusters of conformational states in P450cam reveal a multistep pathway for closing of the substrate access channel. Biochemistry 50, 693–703. [DOI] [PMC free article] [PubMed] [Google Scholar]
- (25).Chuo S-W, Wang L-P, Britt RD, and Goodin DB (2019) An Intermediate Conformational State of Cytochrome P450cam-CN in Complex with Putidaredoxin. Biochemistry 58, 2353–2361. [DOI] [PMC free article] [PubMed] [Google Scholar]
- (26).Colthart AM, Tietz DR, Ni Y, Friedman JL, Dang M, and Pochapsky TC (2016) Detection of substrate-dependent conformational changes in the P450 fold by nuclear magnetic resonance. Sci. Rep 6, 22035. [DOI] [PMC free article] [PubMed] [Google Scholar]
- (27).Tripathi S, Li H, and Poulos TL (2013) Structural basis for effector control and redox partner recognition in cytochrome P450. Science 340, 1227–1230. [DOI] [PubMed] [Google Scholar]
- (28).Myers WK, Lee YT, Britt RD, and Goodin DB (2013) The conformation of P450cam in complex with putidaredoxin is dependent on oxidation state. J. Am. Chem. Soc 135, 11732–11735. [DOI] [PMC free article] [PubMed] [Google Scholar]
- (29).Liou S-H, Mahomed M, Lee Y-T, and Goodin DB (2016) Effector Roles of Putidaredoxin on Cytochrome P450cam Conformational States. J. Am. Chem. Soc 138, 10163–10172. [DOI] [PubMed] [Google Scholar]
- (30).Liou S-H, Myers WK, Oswald JD, Britt RD, and Goodin DB (2017) Putidaredoxin Binds to the Same Site on Cytochrome P450cam in the Open and Closed Conformation. Biochemistry 56, 4371–4378. [DOI] [PubMed] [Google Scholar]
- (31).Hollingsworth S, and Poulos TL (2015) Molecular dynamics of the P450cam-Pdx complex reveals complex stability and novel interface contacts. Protein Sci 24, 49–57. [DOI] [PMC free article] [PubMed] [Google Scholar]
- (32).Hollingsworth SA, Batabyal D, Nguyen BD, and Poulos TL (2016) Conformational selectivity in cytochrome P450 redox partner interactions. Proc. Natl. Acad. Sci. U. S. A 113, 8723–8728. [DOI] [PMC free article] [PubMed] [Google Scholar]
- (33).Diprimo C, Deprez E, Sligar SG, and Hui Bon Hoa G (1997) Origin of the Photoacoustic Signal in Cytochrome P-450cam: Role of the Arg186-Asp251-Lys178 Bifurcated Salt Bridge. Biochemistry 36, 112–118. [DOI] [PubMed] [Google Scholar]
- (34).Kim D, Heo Y-S, and Ortiz de Montellano PR (2008) Efficient catalytic turnover of cytochrome P450(cam) is supported by a T252N mutation. Arch. Biochem. Biophys 474, 150–156. [DOI] [PMC free article] [PubMed] [Google Scholar]
- (35).Sjodin T, Christian JF, Macdonald IDG, Davydov R, Unno M, Sligar SG, Hoffman BM, and Champion PM (2001) Resonance Raman and EPR Investigations of the D251N Oxy-cytochrome P450cam/Putidaredoxin Complex. Biochemistry 40, 6852–6859. [DOI] [PubMed] [Google Scholar]
- (36).Sono M, Perera R, Jin S, Makris TM, Sligar SG, Bryson TA, and Dawson JH (2005) The influence of substrate on the spectral properties of oxyferrous wild-type and T252A cytochrome P450-CAM. Arch. Biochem. Biophys 436, 40–49. [DOI] [PubMed] [Google Scholar]
- (37).Harris DL, and Loew GH (1994) A Role for Thr 252 in Cytochrome P450cam Oxygen Activation. J. Am. Chem. Soc 116, 11671–11674. [DOI] [PubMed] [Google Scholar]
- (38).Pochapsky SS, Pochapsky TC, and Wei JW (2003) A model for effector activity in a highly specific biological electron transfer complex: the cytochrome P450(cam)-putidaredoxin couple. Biochemistry 42, 5649–5656. [DOI] [PubMed] [Google Scholar]
- (39).Wei, Pochapsky T, and Pochapsky S (2005) Detection of a high-barrier conformational change in the active site of cytochrome P450cam upon binding of putidaredoxin. J. Am. Chem. Soc 127, 6974–6976. [DOI] [PMC free article] [PubMed] [Google Scholar]
- (40).Ouyang B, Pochapsky S, Dang M, and Pochapsky T (2008) A functional proline switch in cytochrome P450cam. Structure 16, 916–923. [DOI] [PMC free article] [PubMed] [Google Scholar]
- (41).Asciutto EK, Madura JD, Pochapsky SS, Ouyang B, and Pochapsky TC (2009) Structural and Dynamic Implications of an Effector-Induced Backbone Amide cis-trans Isomerization in Cytochrome P450(cam). J. Mol. Biol 388, 801–814. [DOI] [PMC free article] [PubMed] [Google Scholar]
- (42).Asciutto EK, and Pochapsky TC (2018) Some Surprising Implications of NMR-directed Simulations of Substrate Recognition and Binding by Cytochrome P450cam (CYP101A1). J. Mol. Biol 430, 1295–1310. [DOI] [PMC free article] [PubMed] [Google Scholar]
- (43).Batabyal D, Richards LS, and Poulos TL (2017) Effect of Redox Partner Binding on Cytochrome P450 Conformational Dynamics. J. Am. Chem. Soc 139, 13193–13199. [DOI] [PMC free article] [PubMed] [Google Scholar]
- (44).Spiro TG, Soldatova AV, and Balakrishnan G (2013) CO, NO and O2 as vibrational probes of heme protein interactions. Coord. Chem. Rev 257, 511–527. [DOI] [PMC free article] [PubMed] [Google Scholar]
- (45).Nagano S, Tosha T, Ishimori K, Morishima I, and Poulos TL (2004) Crystal structure of the cytochrome P450cam mutant that exhibits the same spectral perturbations induced by putidaredoxin binding. J. Biol. Chem 279, 42844–42849. [DOI] [PubMed] [Google Scholar]
- (46).Tosha T, Yoshioka S, Ishimori K, and Morishima I (2004) L358P mutation on cytochrome P450cam simulates structural changes upon putidaredoxin binding: the structural changes trigger electron transfer to oxy-P450cam from electron donors. J. Biol. Chem 279, 42836–42843. [DOI] [PubMed] [Google Scholar]
- (47).Goodin DB, Chuo S-W, and Liou S-H (2018) Conformational Changes in Cytochrome P450cam and the Effector role of Putidaredoxin. In Dioxygen-dependent Heme Enzymes 13, 292–310. [Google Scholar]
- (48).Sligar SG, Debrunner PG, Lipscomb JD, Namtvedt MJ, and Gunsalus IC (1974) A role of the putidaredoxin COOH-terminus in P-450cam (cytochrome m) hydroxylations. Proc. Natl. Acad. Sci. U. S. A 71, 3906–3910. [DOI] [PMC free article] [PubMed] [Google Scholar]
- (49).Kuznetsov VY, Poulos TL, and Sevrioukova IF (2006) Putidaredoxin-to-Cytochrome P450cam Electron Transfer: Differences between the Two Reductive Steps Required for Catalysis. Biochemistry 45, 11934–11944. [DOI] [PMC free article] [PubMed] [Google Scholar]
- (50).Zhang W, Pochapsky SS, Pochapsky TC, and Jain NU (2008) Solution NMR structure of putidaredoxin-cytochrome P450cam complex via a combined residual dipolar coupling-spin labeling approach suggests a role for Trp106 of putidaredoxin in complex formation. J. Mol. Biol 384, 349–363. [DOI] [PMC free article] [PubMed] [Google Scholar]
- (51).Hiruma Y, Gupta A, Kloosterman A, Olijve C, Olmez B, Hass MA, and Ubbink M (2014) Hot-spot residues in the cytochrome P450cam-putidaredoxin binding interface. ChemBioChem 15, 80–86. [DOI] [PubMed] [Google Scholar]
- (52).Kuznetsov VY, Blair E, Farmer PJ, Poulos TL, Pifferitti A, and Sevrioukova IF (2005) The putidaredoxin reductase-putidaredoxin electron transfer complex: theoretical and experimental studies. J. Biol. Chem 280, 16135–16142. [DOI] [PubMed] [Google Scholar]
- (53).Jeschke G (2012) DEER distance measurements on proteins. Annu. Rev. Phys. Chem 63, 419–446. [DOI] [PubMed] [Google Scholar]
- (54).Islam SM, and Roux B (2015) Simulating the distance distribution between spin-labels attached to proteins. J. Phys. Chem. B 119, 3901–3911. [DOI] [PMC free article] [PubMed] [Google Scholar]
- (55).Polyhach Y, Bordignon E, Tschaggelar R, Gandra S, Godt A, and Jeschke G (2012) High sensitivity and versatility of the DEER experiment on nitroxide radical pairs at Q-band frequencies. Phys. Chem. Chem. Phys 14, 10762–10773. [DOI] [PubMed] [Google Scholar]
- (56).Jeschke G, Chechik V, Ionita P, Godt A, Zimmermann H, Banham J, Timmel CR, Hilger D, and Jung H (2006) Deer Analysis2006—a comprehensive software package for analyzing pulsed ELDOR data. Appl. Magn. Reson 30, 473–498. [Google Scholar]
- (57).Chiang YW, Borbat PP, and Freed JH (2005) The determination of pair distance distributions by pulsed ESR using Tikhonov regularization. J. Magn. Reson 172, 279–295. [DOI] [PubMed] [Google Scholar]
- (58).Halbmair K, Seikowski J, Tkach I, Höbartner C, Sezer D, and Bennati M (2016) High-resolution measurement of long-range distances in RNA: pulse EPR spectroscopy with TEMPO-labeled nucleotides. Chem. Sci 7, 3172–3180. [DOI] [PMC free article] [PubMed] [Google Scholar]
- (59).Wang J, Wolf RM, Caldwell JW, Kollman PA, and Case DA (2004) Development and Testing of a General Amber Force Field. J. Comput. Chem 25, 1157–1174. [DOI] [PubMed] [Google Scholar]
- (60).Jakalian A, Bush BL, Jack DB, and Bayly CI (2000) Fast, efficient generation of high-quality atomic charges. AM1-BCC model: I. Method. J. Comput. Chem 21, 132–146. [DOI] [PubMed] [Google Scholar]
- (61).Jakalian A, Jack DB, and Bayly CI (2002) Fast, efficient generation of high-quality atomic charges. AM1-BCC model: II. Parameterization and validation. J. Comput. Chem 23, 1623–1641. [DOI] [PubMed] [Google Scholar]
- (62).Fleissner MR, Bridges MD, Brooks EK, Cascio D, Kalai T, Hideg K, and Hubbell WL (2011) Structure and dynamics of a conformationally constrained nitroxide side chain and applications in EPR spectroscopy. Proc. Natl. Acad. Sci. U. S. A 108, 16241–16246. [DOI] [PMC free article] [PubMed] [Google Scholar]
- (63).Khoury GA, Smadbeck J, Tamamis P, Vandris AC, Kieslich CA, and Floudas CA (2014) Forcefield_NCAA: ab initio charge parameters to aid in the discovery and design of therapeutic proteins and peptides with unnatural amino acids and their application to complement inhibitors of the compstatin family. ACS Synth. Biol 3, 855–869. [DOI] [PMC free article] [PubMed] [Google Scholar]
- (64).Sezer D, Freed JH, and Roux B (2008) Parametrization, Molecular Dynamics Simulation, and Calculation of Electron Spin Resonance Spectra of a Nitroxide Spin Label on a Polyalanine r-Helix. J. Phys. Chem. B 112, 5755–5767. [DOI] [PMC free article] [PubMed] [Google Scholar]
- (65).Case DA, Cerutti DS, Cheatham TE, Darden TA, Duke RE, Giese TJ, Gohlke H, Goetz AWN, Izadi S, Janowski P, Kaus J, Kovalenko A, Lee TS, LeGrand S, Li P, Lin C, Luo R, Madej B, Mermelstein D, Merz KM, Monard G, Nguyen H, Nguyen HT, Omelyan I, Roe DR, Roitberg A, Sagui C, Simmerling CL, Botello-Smith WM, Swails J, Walker RC, Wolf RM, Wu X, Xiao L, and Kollman PA (2016) AMBER 16, University of California, San Francisco, San Francisco. [Google Scholar]
- (66).Maier JA, Martinez C, Kasavajhala K, Wickstrom L, Hauser KE, and Simmerling C (2015) ff14SB: Improving the Accuracy of Protein Side Chain and Backbone Parameters from ff99SB. J. Chem. Theory Comput 11, 3696–3713. [DOI] [PMC free article] [PubMed] [Google Scholar]
- (67).Ryckaert J-P, Ciccotti G, and Berendsen HJC (1977) Numerical integration of the Cartesian Equations of Motion of a System with Constraints: Molecular Dynamics of n-Alkanes. J. Comput. Phys 23, 327–341. [Google Scholar]
- (68).Shao J, Tanner SW, Thompson N, and Cheatham TE (2007) Clustering Molecular Dynamics Trajectories: 1. Characterizing the Performance of Different Clustering Algorithms. J. Chem. Theory Comput 3, 2312–2334. [DOI] [PubMed] [Google Scholar]
- (69).Sethi A, Eargle J, Black AA, and Luthey-Schulten Z (2009) Dynamical networks in tRNA:protein complexes. Proc. Natl. Acad. Sci. U. S. A 106, 6620–6625. [DOI] [PMC free article] [PubMed] [Google Scholar]
- (70).Newman ME (2006) Modularity and community structure in networks. Proc. Natl. Acad. Sci. U. S. A 103, 8577–8582. [DOI] [PMC free article] [PubMed] [Google Scholar]
- (71).Lipscomb JD (1980) Electron paramagnetic resonance detectable states of cytochrome P-450cam. Biochemistry 19, 3590–3599. [DOI] [PubMed] [Google Scholar]
- (72).de Vera IM, Blackburn ME, Galiano L, and Fanucci GE (2013) Pulsed EPR distance measurements in soluble proteins by site-directed spin labeling (SDSL). Curr. Protoc. Protein Sci 74, 17.17.1–17.17.29. [DOI] [PMC free article] [PubMed] [Google Scholar]
- (73).Glykos NM (2006) Software news and updates. Carma: a molecular dynamics analysis program. J. Comput. Chem 27, 1765–1768. [DOI] [PubMed] [Google Scholar]
Associated Data
This section collects any data citations, data availability statements, or supplementary materials included in this article.