

Abstract
Breastfeeding (BF) has been identified as a protective factor against childhood obesity. However, evidence of the association between BF duration and adiposity remains inconclusive. Few studies have been conducted among Southeast Asian infants that have measured body composition during infancy using the gold standard stable isotope method. This study aimed to evaluate the association between BF duration and body composition during infancy. Healthy full‐term Thai infants aged 6–8 months (n = 60) receiving exclusive or predominant BF for at least 3 months were recruited. Skinfold thickness (SFT) was measured by well‐trained investigators. Body composition was assessed by the deuterium dilution technique. Infants with longer BF duration (>6 months; mean 7.5 ± 0.5 months, n = 29) had a higher subscapular SFT z‐score than those with shorter BF duration (≤6 months; mean 5.3± 0.9 months, n = 31) by 0.48 (95% confidence interval [CI]: 0.01–0.94). After adjustment for age and sex, BF duration and age at introduction of complementary feeding (CF) were positively associated with fat mass and fat mass index at 6–8 months. One month increase in BF duration and CF age was associated with a 0.37 (95% CI: 0.05, 0.69) kg/m2 and 0.76 (95% CI: 0.18, 1.34) kg/m2 increase in the fat mass index, respectively. After adjusting for infant body mass index (BMI) during the earlier infancy period, the strength of the association was attenuated. This finding may reflect reverse causality where infants with lower BMI received formula or CF earlier. A longitudinal study with follow‐up into childhood is warranted to confirm the effects of BF on adiposity in infancy and childhood.
Keywords: adiposity, body composition, breastfeeding, complementary feeding, deuterium, fat mass, lean mass, obesity

Our study found that infants who received breastfeeding (BF) solely for a longer duration had significantly higher fat mass and fat mass index at age 6–8 months based on anthropometry and isotope dilution technique compared with infants with a shorter BF duration. Older age at introduction complementary feeding was associated with higher adiposity at age 6–8 months. Further longitudinal tracking up to childhood is warranted to confirm the effects of BF on adiposity in infancy and beyond.
Key points
Previous evidence found that the duration of breastfeeding (BF) and infant feeding practice may be associated with adiposity during infancy and later life.
Our study found that infants who received BF solely for a longer duration had a significantly higher fat mass and fat mass index at age 6–8 months based on anthropometry and the isotope dilution technique compared with infants with a shorter BF duration.
Older age at introduction complementary feeding was associated with higher adiposity at age 6–8 months.
Further longitudinal tracking up to childhood is warranted to confirm the effects of BF on adiposity in infancy and beyond.
1. INTRODUCTION
Breast milk is accepted as an ideal food for infants since it provides all the essential nutrients, immunity, and hormones to stimulate optimal growth and development. Previous literature also shows that breast milk intake may prevent obesity and noncommunicable diseases, which is a global public health concern (Bartok & Ventura, 2009). A recent meta‐analysis revealed a 17% reduction in the risk of obesity in ever‐breastfed preschool children compared with never‐breastfed counterparts (Qiao et al., 2020).
Several potential mechanisms have been proposed to explain why breastfeeding (BF) may reduce the risk of obesity later in life. First, lower protein content in breast milk compared with formula could affect subsequent body composition changes since excessive protein intake may stimulate higher insulin and insulin‐like growth factor release. The release of these two hormones will also trigger a proliferation of adipose cells as well as fat storage in the body (Bartok & Ventura, 2009). Additionally, human milk contains growth modulating bioactive compounds such as leptin, ghrelin and adiponectin, which may involve appetite regulation (Savino et al., 2009). Evidence has shown that breastfed infants may learn to better self‐regulate their energy intake than bottle‐fed infants, which may also affect eating behaviors in later life (Koletzko et al., 2009).
The advantage of BF is well established. World Health Organization (WHO) recommends that infants should receive exclusive breastfeeding (EBF) for the first 6 months of life and then continue BF for up to 2 years of age or beyond with appropriate complementary feeding (CF) (World Health Organization, 2001). According to the survey by WHO, the global EBF rate in the first 6 months between 2013 and 2018 remains low at 41% (World Health Organization & United Nations Children's Fund, 2019). A recent Thailand multiple indicator cluster survey reported a 6‐month EBF rate of 14% (National Statistical Office of Thailand, 2020), far from the target of 50% in 2025, proposed by the Thai Ministry of Public Health and the World Health Assembly (World Health Organization & United Nations Children's Fund, 2018). Furthermore, previous surveys have shown that the global EBF rate has significantly declined after 3 months of age and Thailand is no exception (National Statistical Office & United Nations Children's Fund, 2016; National Statistical Office of Thailand, 2020).
Recent evidence suggests that a longer duration of BF may be a protective factor against childhood obesity (Butte et al., 2000; Ejlerskov et al., 2015; Eny et al., 2018; Gale et al., 2012; Kramer et al., 2003; Toschke et al., 2007). However, studies that explored the association between BF duration and adiposity during infancy, especially among the Southeast Asian population, are scarce. Most previous studies were performed among Western populations that may have different patterns of body composition (Gale et al., 2012; Kramer et al., 2003). Also, most studies usually selected the body mass index (BMI) or weight‐for‐height (WFH) z‐score as a proxy for fat mass and used these indices to measure obesity (Ejlerskov et al., 2015; Eny et al., 2018). These measures may not be suitable indicators to assess body fatness and its changes over time in growing infants and children. Only a few previous studies used more robust techniques such as the deuterium dilution technique, dual‐energy X‐ray absorptiometry (DXA), or air displacement plethysmography to explore fat and lean mass in association with infant feeding practices (Butte et al., 2000; Robinson et al., 2009; Toschke et al., 2007). Previous studies have reported that infant growth and body composition, modulated by infant feeding practices, were associated with adiposity in infancy, childhood and early adulthood (Aris et al., 2017; Chomtho et al., 2008; Chomtho et al., 2009; Sun et al., 2017).
The objectives of this study were to determine the association between the duration of BF and body composition among healthy Thai infants aged 6–8 months and to explore the association between infant feeding practices including age at introduction of CF and body composition.
2. METHODS
2.1. Study design and participants
A cross‐sectional study was conducted from January to September 2020. This study was undertaken by the Institute of Nutrition, Mahidol University, and the Pediatric Nutrition Research Unit, Division of Nutrition, Department of Pediatrics, Faculty of Medicine, Chulalongkorn University. Cross‐sectional data was taken from the ongoing International Atomic Energy Agency (IAEA) Regional Asia Project (RAS6092) entitled ‘Longitudinal study on body composition, energy expenditure, and feeding practices of 6 to 23 months old Thai infants’ and the Food and Agriculture Organization of the United Nations (FAO) project ‘Determination of Energy Expenditure of Infants and Young Children (6–24 months old)’.
Thai healthy infants aged 6–8 months, full‐term born (gestational age GA 37–41+6 weeks), singleton with birth weight 2500–4000 g and receiving EBF or predominant BF according to the WHO definition for at least three months, were enrolled (World Health Organization, 2021). Other inclusion criteria were maternal age older than 18 years, nonsmoker, Thai ethnicity and weight‐for‐height (WFH) and length‐for‐age (LFA) z‐score between −2 and +2 SD according to WHO growth reference on the recruitment day. Infants were excluded if they had congenital anomalies, inborn errors of metabolism or chronic diseases as well as those who were sick with any acute illness or received any supplementation that can interfere with body composition measurements. One parent of each infant provided written informed consent for the child's participation after the researcher had explained all the study procedures to the parents.
2.2. Demographic data, infant feeding practices and dietary intake
Demographic data including maternal data (age, pre‐pregnancy BMI, total weight gain during pregnancy, education level and occupation), household income, birth characteristics (sex, birth weight and length and GA), previous anthropometric history and details of infant feeding practices (duration of BF, mode of BF and age of CF introduction) were retrospectively collected by interviews with parents. Infants receiving BF without any formula (solely BF) for less than or equal to 6 months of age were categorized as the shorter BF group, whereas infants receiving BF solely for more than 6 months were classified as the longer BF group, regardless of when CF was introduced. Bottle‐feeding intensity (BFI) (%) was calculated by the volume of breast milk and formula that were fed via bottle per day divided by the volume of total milk intake per day and then multiplied by 100 (Li et al., 2014).
The energy and nutrient intake of infants were assessed by dietitians using 3‐day 24‐h dietary recalls, including 2 weekdays and 1 weekend day to enhance the accuracy of estimation. The volume of breast milk intake from direct BF was estimated based on the Medical Research Council data (Mills & Tyler, 1992). Breast milk intake for infants aged 6–7 months receiving direct BF for 10 min or more was counted as 135 ml per feed and 100 ml per feed for infants older than 8 months. If the feeding duration was less than 10 min, consumption was calculated proportionally (Lanigan et al., 2001). The energy and nutrient intake from the CF were calculated from diets other than breast milk, but not including infant formula. The nutrient intake from the 24‐hour dietary recall was computed by INMUCAL‐Nutrients V. 4.0 software developed by the Institute of Nutrition, Mahidol University, Thailand (Institute of Nutrition, 2018).
2.3. Anthropometry and body composition
Weight, length, mid‐upper arm circumference (MUAC) and skinfold thickness (SFT) measurements were performed by well‐trained research assistants. Weight was measured to the nearest 100 g using a standard digital baby weighing scale (Seca 354; Seca GmbH & Co. KG), while the length was examined to the nearest 0.1 cm by a length board (ShorrBoard®; Weight and Measure LLC). BMI was calculated as weight (kg) divided by length2 (m). MUAC was measured at a mid‐point of the distance between an acromion process of the shoulder to an olecranon process of the elbow using nonstretchable tape to the nearest 0.1 cm. Triceps and subscapular SFT were measured by using skinfold callipers (Holtain T/W skinfold calliper; Holtain Ltd.). All measurements were performed twice with averages used for the analysis. Weight, length, MUAC, and SFT were entered into the WHO Anthro software for calculating age‐ and sex‐specific z‐scores based on 2006 WHO Growth Standards (Blössner et al., 2010). Previous measurements of weight and length at the age of 2 and 4 months were retrieved from baby vaccination record books.
Body composition was assessed by doubly labeled water (DLW). All infants received a mixture of deuterium oxide (2H2O, 0.1 g/kg of body weight) and oxygen (18O, 2.8 g/kg of body weight) orally to assess body composition and energy expenditure. Urine samples were collected by using taped urine collecting bags containing cotton balls, one before the dose (pre‐dose) at 4–6 h and 1, 2, 6 and 7 days after the dose was taken (post‐dose). The urine samples were stored at −20oC for later analysis. The enrichment of deuterium in urine was measured using an isotope ratio mass spectrometer (IRMS; SerCon Limited) at the Institute of Nutrition, Mahidol University. Total body water (TBW) was calculated by the intercept method. Fat‐free mass (FFM, kg) was then derived from TBW divided by the specific hydration coefficient for age. Fat mass (FM, kg) was calculated as the difference between body weight and FFM (International Atomic Energy Agency IAEA, 2009). The fat mass index (FMI) and fat‐free mass index (FFMI) were calculated by FM (kg) divided by length2 (m) and FFM (kg) divided by length2 (m), respectively, to correct for variations related to body size (Wells et al., 2002).
2.4. Statistical analysis
Statistical analysis was performed using Stata 15.1 (StataCorp.). The normality of data was checked using the Shapiro–Wilk test before analysis. Continuous variables including baseline characteristics and body composition were expressed as mean and standard deviation values (SD) and medians (25th, 75th percentiles) as appropriate. Categorical variables were presented as a count and percentage. Independent t‐test, χ 2 and Wilcoxon's rank‐sum tests were applied to explore significant differences between shorter and longer BF groups. Pearson's correlation coefficient measured the correlation between the duration of BF, the age for introducing CF, BFI and body composition. The multivariate models were run with potential confounders of infant adiposity. Models 1 and 2 were basic models that adjusted for age and sex, while Models 3 and 4 included covariates for birth BMI z‐score, infant feeding practices (either the duration of solely BF, age at introduction of CF) and infant's BMI z‐score at ages 2 and 4 months. p < 0.05 was considered statistical significance.
2.5. Ethics statement
The study was approved by the Institutional Review Board of the Faculty of Medicine, Chulalongkorn University, Thailand (COA. No. 1375/2020), and the Central Institutional Review Board at Mahidol University (COA NO. MU‐CIRB 2019/148.1809). Written informed consent was obtained from the legal guardian of the infants involved in this study after the researcher had explained the study.
3. RESULTS
3.1. Baseline characteristics, infant feeding practices and dietary intake
Sixty infants participated in the study. The characteristics of the infants and mothers, infant feeding practices and baseline dietary intakes, stratified by the duration of BF, are shown in Table 1. The mean age of the infants at recruitment was 7.5 ± 0.8 months. Infants from the longer BF group were older than in the shorter BF groups by 0.9 months; 95% confidence interval (CI): 0.5–1.2, p < 0.001. The duration of BF in shorter and longer BF infants was 5.3 ± 0.9 months and 7.5 ± 0.5 months, respectively (p < 0.001). There was no significant difference in birth anthropometry between the two groups. At the age of 2 and 4 months, weight for age (WFA), length for age (LFA) and BMI‐for‐age z‐score were not significantly different between the groups (Supporting Information: Table S1). However, the longer BF group tended to have slower weight gain (299.8 ± 92 g/month) than the shorter BF group (358.1± 135.8 g/month) from 4 months to the age of recruitment (at 6–8 months) (p = 0.08). The longer BF group had a significantly higher level of maternal education compared with the shorter BF group (p = 0.04). Other maternal characteristics including maternal age, pre‐pregnancy BMI, weight gain during pregnancy, maternal occupation and household incomes were not significantly different between the two groups.
Table 1.
Baseline characteristics by duration of BF (n = 60)a
| Characteristics | All (n = 60) | Shorter BFb (n = 31) | Longer BFb (n = 29) | p c |
|---|---|---|---|---|
| Infant characteristics | ||||
| Age, months | 7.5 ± 0.8 | 7.0 ± 0.7 | 7.9 ± 0.7 | <0.001 |
| Male, n (%) | 30 (50) | 18 (58) | 12 (41) | 0.20 |
| Gestational age, weeks | 38.5 ± 1.1 | 38.4 ± 1.2 | 38.6 ± 0.9 | 0.40 |
| Birth BMI z‐score | −0.8 ± 0.8 | −0.7 ± 0.7 | −0.9 ± 1 | 0.53 |
| Weight gain from age 4 to 6–8 months, g/monthd | 327.2 ± 117.2 | 358.1 ± 135.8 | 299.8 ± 92.1 | 0.08 |
| Length gain from age 4 to 6–8 months, mm/monthe | 16.9 ± 4.9 | 17.5 ± 4.8 | 16.3 ± 4.9 | 0.41 |
| Maternal characteristics | ||||
| Age, years | 31.3 ± 5.8 | 30.6 ± 5.5 | 32.0 ± 6.2 | 0.36 |
| Pre‐pregnancy BMI, kg/m2 | 22.3 ± 3.9 | 22.7 ± 4.2 | 21.9 ± 3.6 | 0.40 |
| Weight gain during pregnancy, kg | 14.7 ± 5.1 | 14.6 ± 5.8 | 14.7 ± 4.3 | 0.95 |
| Bachelor's degree and higher education, n (%) | 47 (78) | 21 (68) | 26 (90) | 0.04 |
| Full‐time employment, n (%) | 38 (63) | 19 (61) | 19 (65) | |
| Household income (baht/month), n (%) | 0.61 | |||
| <15,000 | 1 (1) | 1 (3) | 0 (0) | |
| 15,000–50,000 | 28 (47) | 16 (52) | 12 (41) | |
| 50,000–100,000 | 18 (30) | 8 (26) | 10 (35) | |
| >100,000 | 13 (22) | 6 (19) | 7 (24) | |
| Infant feeding practices | ||||
| Bottle‐feeding intensity, %/dayf | 54.9 ± 42.3 | 63.9 ± 41.3 | 45.4 ± 41.9 | 0.09 |
| Age at introduced CF, months | 5.6 ± 0.7 | 5 (5, 6) | 6 (5.8, 6) | 0.60 |
| Dietary intake | ||||
| Total energy intake, kcal/kg/day | 76.9 ± 28.6 | 88.5 ± 33.7 | 64.6 ± 13.7 | 0.001 |
| Total protein intake, g/kg/day | 1.6 (1.2, 2.3) | 2.1 (1.2, 3.2) | 1.5 (1.2, 1.8) | 0.02 |
| Percentage of protein; energy, % | 8.8 (7.8, 10.1) | 8.7 (7.5, 13.2) | 9.1 (7.9, 10.0) | 0.93 |
| Energy intake from CF, kcal/kg/dayg | 10.3 (7.2, 24.2) | 8.6 (7.2, 24.0) | 12.0 (7.1, 24.6) | 0.75 |
| Protein intake from CF, g/kg/dayg | 0.5 (0.3, 1.1) | 0.4 (0.2, 1.2) | 0.6 (0.3, 1.0) | 0.48 |
| Animal‐based protein from CF, g/kg/dayg | 0.3 (0.2, 0.6) | 0.3 (0.1, 0.7) | 0.3 (0.2, 0.5) | 0.59 |
Abbreviations: BF, breastfeeding; BMI, body mass index; CF, complementary feeding.
Values are presented as mean ± SD for continuous variables with normal distribution or median (25th, 75th percentiles) for continuous variables with nonnormal distribution. Categorical variables were expressed as n (%).
The shorter BF group was defined as infants receiving BF without any formula for less than or equal to 6 months of age along with CF, while the longer BF group was defined as infants receiving BF solely for more than 6 months along with CF.
Differences were performed by t‐tests and χ 2 tests for continuous and categorical variables, respectively. Wilcoxon's rank‐sum tests were used for nonnormality distribution variables.
All, n = 51; shorter solely BF, n = 24; longer solely BF, n = 27.
All, n= 50; shorter solely BF, n= 23, longer solely BF, n = 27.
Bottle‐feeding intensity, % = (Volume of breast milk and formula that were fed by bottle/Volume of total milk intake) × 100.
The energy and nutrient intake from the CF were calculated from diets other than breast milk, not including infant formula.
Lower BFI was observed in the longer BF group. More than three‐quarters of the infants in the longer BF group (79%) received breast milk via direct BF with or without bottle feeding at 6–8 months of age. Additionally, 28% of the infants started CF earlier than 6 months, but there was no difference in the age of CF introduction between the two groups.
Dietary energy and protein intake are also summarized in Table 1. As expected, the longer BF infants consumed significantly lower energy and protein compared with the shorter BF group. However, no significant differences in energy and protein intake from CF were observed between groups. Similarly, the protein‐to‐energy ratio and animal‐based protein intake were not different between the two groups.
3.2. Anthropometric measurements and body compositions
Anthropometric measurements are presented in Figure 1. Longer BF infants had significantly higher subscapular SFT z‐scores than shorter BF infants (difference: 0.49; 95% CI: 0.02–0.96). Other anthropometric measurements were not different between the two groups.
Figure 1.
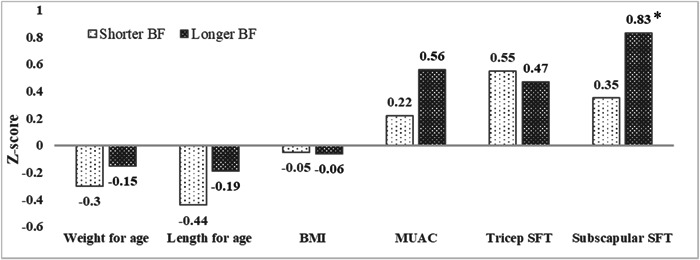
Comparison of anthropometric measurements between shorter BF and longer BF groups (n = 61). The shorter BF group was defined as infants receiving BF without any formula for less than or equal to 6 months of age along with CF, while the longer BF group was defined as infants receiving BF solely for more than 6 months along with CF. BF, breastfeeding; BMI, body mass index; CF, complementary feeding; MUAC, mid‐upper arm circumference; SFT, skinfold thickness.
Body composition assessed by DLW was performed in all infants. Nine infants were excluded from the analysis due to outlier results. Figure 2 shows the comparison of body composition between the shorter and longer BF groups. There were no statistically significant differences in any indices of body composition between the two groups.
Figure 2.

Comparison of body composition assessed by the deuterium dilution technique between shorter and longer BF groups (n = 51): (a) comparison of weight of FM and FFM; (b) comparison between %FM and FFM; (c) comparison between index of FM and FFM. The shorter BF group was defined as infants receiving BF without any formula for less than or equal to 6 months of age along with CF, while the longer BF group was defined as infants receiving BF solely for more than 6 months along with CF. BF, breastfeeding; CF, complementary feeding; FFM, fat‐free mass; FFMI, fat‐free mass index; FM, fat mass; FMI, fat mass index.
3.3. Association between clinical characteristics and infant feeding practices versus body composition
Table 2 shows the univariate analysis results between clinical characteristics of infant–mother dyads and infant feeding practices with infant FMI and FFMI. Significant associations were found between the BMI z‐score at birth and FFMI (β = 0.66, p < 0.001) and age at introduction of CF was positively associated with FMI (β = 0.69, p = 0.03). None of the maternal variables was associated with FMI and FFMI.
Table 2.
Univariate linear regression analysis between clinical characteristics and feeding practices and infant body composition (n = 51)a
| Fat mass index, kg/m2 | Fat‐free mass index, kg/m2 | |||
|---|---|---|---|---|
| β | p | β | p | |
| Infant variables | ||||
| Birth BMI z‐score | −0.05 | 0.81 | 0.66 | <0.001 |
| BMI z‐score at age 2 months | 0.31 | 0.05 | 0.32 | 0.02 |
| BMI z‐score at age 4 months | 0.62 | <0.001 | 0.35 | 0.04 |
| BMI z‐score at age 6–8 months | 0.86 | <0.001 | 0.57 | <0.001 |
| Duration of BF, months | 0.10 | 0.46 | −0.07 | 0.57 |
| Bottle‐feeding intensity,a %/day | −0.003 | 0.52 | 0.002 | 0.58 |
| Duration of receiving direct BF, min/day | 0.01 | 0.92 | ‐0.33 | 0.02 |
| Age at introduced CF, months | 0.69 | 0.03 | ‐0.28 | 0.31 |
| Dietary intake | ||||
| Total energy intake, kcal/kg/day | −0.31 | 0.03 | −0.27 | 0.06 |
| Total protein intake, g/kg/day | −0.33 | 0.05 | −0.16 | 0.29 |
| Protein: energy, % | −0.12 | 0.08 | 0.02 | 0.80 |
| Energy intake from CF, kcal/kg/day | −0.02 | 0.14 | −0.01 | 0.60 |
| Protein intake from CF, g/kg/day | −0.35 | 0.16 | −0.13 | 0.56 |
| Animal‐based protein from CF, g/kg/day | −0.42 | 0.20 | ‐0.15 | 0.61 |
| Maternal variables | ||||
| Age, years | −0.02 | 0.48 | 0.04 | 0.10 |
| Pre‐pregnancy BMI, kg/m2 | −0.03 | 0.53 | 0.04 | 0.30 |
| Weight gain during pregnancy, kg | 0.04 | 0.28 | 0.02 | 0.61 |
| Bachelor's degree and higher education | −0.13 | 0.75 | −0.27 | 0.47 |
| Full‐time employment | −0.28 | 0.44 | 0.12 | 0.72 |
| Household income (baht/month), n (%) | ||||
| <15,000 | Reference | Reference | Reference | Reference |
| 15,000–50,000 | −0.26 | 0.85 | −0.44 | 0.71 |
| 50,001–100,000 | 0.08 | 0.96 | −0.43 | 0.72 |
| >100,000 | −0.25 | 0.85 | −0.82 | 0.49 |
Abbreviations: BF, breastfeeding; BMI, body mass index; CF, complementary feeding.
Bottle‐feeding intensity, % = (Volume of breast milk and formula that were fed by bottles/Volume of total milk intake) × 100.
Table 3 presents multivariate regression results, which explored the association between either BF duration or age at introduction of CF and infants’ body composition. When the infants were categorized into shorter and longer BF groups, no association between the duration of BF and body composition was found after adjusting for all infant variables (Models 1 and 3). Nevertheless, when the duration of BF was analyzed as a continuous variable, BF duration was positively associated with FM and FMI (FM coefficient 0.17, p = 0.03; FMI coefficient 0.37, p = 0.03) after adjusting for age and sex (Model 1). However, after adjusting for infant variables (Model 3), the association between the duration of solely BF with FM and FMI became nonsignificant. The association remained the same after adjusting for maternal pre‐pregnancy BMI and gestational weight gain (Supporting Information: Table S2).
Table 3.
Multivariable linear regression analysis between either duration of BF or age at introduction of CF and infant body composition measured by the deuterium dilution technique (n = 51)
| FM, kg | FFM, kg | FMI, kg/m2 | FFMI, kg/m2 | |||||
|---|---|---|---|---|---|---|---|---|
| Mean (95%CI) | p | Mean (95%CI) | p | Mean (95%CI) | p | Mean (95%CI) | p | |
| Multivariable linear regression analysis adjusted for age and sex | ||||||||
| Model 1: Duration of BF and body composition | ||||||||
| Shorter BF groupa | 1.16 (1.72, 2.21) | 0.12 | 5.87 (5.61, 6.12) | 0.79 | 4.25 (3.72, 4.78) | 0.15 | 12.74 (12.25, 13.24) | 0.41 |
| Longer BF groupa | 2.27 (2.02, 2.51) | 5.82 (5.56, 6.07) | 4.86 (4.33, 5.38) | 12.42 (11.94, 12.90) | ||||
| Change per month increase in solely BF duration | 0.17 (0.02,0.33) | 0.03 | −0.03 (−0.20,0.13) | 0.68 | 0.37 (0.05,0.69) | 0.03 | −0.09 (−0.41,0.22) | 0.54 |
| Model 2: Age at introduction of CF and infant body composition | ||||||||
| <6 months | 1.85 (1.48, 2.22) | 0.12 | 5.85 (5.47, 6.23) | 0.97 | 4.00 (3.22, 4.78) | 0.11 | 12.66 (11.92, 13.39) | 0.81 |
| ≥6 months | 2.18 (2.00, 2.36) | 5.84 (5.65, 6.03) | 4.70 (4.32, 5.09) | 12.56 (12.20, 12.92) | ||||
| Change per month increase in age at introduction of CF | 0.36 (0.08, 0.63) | 0.01 | ‐0.07 (‐0.36, 0.23) | 0.64 | 0.76 (0.18, 1.34) | 0.01 | −0.28 (−0.85, 0.28) | 0.32 |
| Multivariable linear regression analysis adjusted for age, sex, birth BMI z‐score, infant's BMI z‐score at age 2 months and 4 months, either age of introduction of CF or duration of BF without any formula | ||||||||
| Model 3: Duration of BF and body compositionb | ||||||||
| Shorter BF group | 2.07 (1.78, 2.36) | 0.69 | 5.95 (5.65, 6.25) | 0.42 | 4.48 (3.87, 5.08) | 0.77 | 12.87 (12.26, 13.49) | 0.18 |
| Longer BF group | 2.16 (1.92, 2.39) | 5.77 (5.52, 6.01) | 4.61 (4.12, 5.10) | 12.23 (11.73, 12.73) | ||||
| Change per month increase in solely BF duration | 0.12 (−0.02,0.35) | 0.32 | −0.14 (−0.38,0.10) | 0.26 | 0.23 (−0.25,0.72) | 0.34 | −0.39 (−0.88,0.11) | 0.12 |
| Model 4: Age at introduction of CF and infant body compositionc | ||||||||
| <6 months | 2.05 (1.71, 2.40) | 0.68 | 5.91 (5.56, 6.27) | 0.65 | 4.38 (3.66, 5.10) | 0.61 | 12.56 (11.83, 13.30) | 0.86 |
| ≥6 months | 2.14 (1.96, 2.31) | 5.82 (5.64, 6.00) | 4.60 (4.24, 4.96) | 12.49 (12.12, 12.86) | ||||
| Change per month increase in age at introduction of CF | 0.14 (0.19, 0.46) | 0.40 | 0.14 (0.19, 0.46) | 0.37 | 0.31 (0.37, 0.98) | 0.37 | −0.34 (−1.03, 0.36) | 0.32 |
Abbreviations: BF, breastfeeding; CF, complementary feeding; FFM, fat‐free mass; FFMI, fat‐free mass index; FM, fat mass; FMI, fat mass index.
The shorter BF group was defined as infants receiving BF without any formula for less than or equal to 6 months of age, while the longer BF group was defined as infants receiving BF solely for more than six months, regardless of when CF was introduced
Model 3: Adjusted for age, sex, birth BMI z‐score, infant's BMI z‐score at age 2 months, infant's BMI z‐score at age 4 months and age of introduction of CF.
Model 4: Adjusted for age, sex, birth BMI z‐score, infant's BMI z‐score at age 2 months, infant's BMI z‐score at age 4 months and duration of BF without any formula.
After adjusting for age and sex (Model 2), later introduction of CF (≥6 months, mean 6.0 ± 0.1 months) was associated with a higher FM and FMI (FM coefficient = 0.36, p= 0.01; FMI coefficient = 0.76, p = 0.01), compared with earlier introduction of CF (<6 months, mean = 4.6 ± 0.7 months). However, after further adjustment for infant BMI z scores at age 2 and 4 months, no association between age at introduction of CF and body composition was found (Model 4). There was also no association between age at introduction of CF and FFM or FFMI.
Additionally, infants who received CF before 6 months tended to have a lower WFA, LFA and BMI‐for‐age z‐score before starting CF compared with infants receiving CF at 6 months. No association was found between BFI and infant body composition (data are not shown).
4. DISCUSSION
This study aimed to evaluate the association between BF duration and infant body composition at 6–8 months of age. After adjusting for age and sex, we found that infants who had a longer duration of receiving only BF had a significantly higher FM and FMI at age 6–8 months compared with infants with a shorter duration of solely BF. CF introduction at an older age was also associated with higher FM and FMI. These are novel findings as few studies in the past have actually measured body composition during infancy by using the stable isotope method and performed the study with a population of Southeast Asian infants.
Our results are in line with previous studies, suggesting that BF infants have higher levels of FM (de Bruin et al., 1998; Gale et al., 2012; Jin et al., 2022; Tahir et al., 2021). However, most of these earlier studies did not adjust infant body composition with earlier infant growth as performed in our study. For example, de Bruin et al. conducted a cohort study of 46 infants aged 0–12 months receiving either EBF or formula feeding during the first 4 months of life and showed that total FM was slightly higher in boys of the BF group, but there was no statistically significant difference between the groups at 1–12 months of age (de Bruin et al., 1998). Additionally, a recent longitudinal birth cohort study of 173 pairs of twins found that BF infants had a higher percentage of FM at 12 months of age after adjusting for dietary pattern scores, maternal variables and BF duration (β‐value = 1.96, 95% CI: 0.49–3.43) (Jin et al., 2022). A systematic review and meta‐analysis by Gale et al. (2012) including 15 studies revealed that FM was lower in formula‐fed infants at 3–4 months and 6 months of age than in BF infants (mean difference of FM (kg) at 3–4 months: −0.09, 95% CI: −0.18, −0.01; at 6 months: −0.18, 95% CI: −0.34, −0.01). By 12 months, however, FM had the opposite trend with formula‐fed infants showing a higher FM than BF infants (mean difference: 0.29, 95% CI: −0.03, 0.61) (Gale et al., 2012). A similar change in body composition over the infancy period among BF and formula‐fed infants was also found in preterm populations (Huang et al., 2016). Since adiposity assessed at 6–8 months cannot predict adiposity later in life, a longitudinal study should be performed to confirm the effect of BF on adiposity in infancy and beyond.
We found that longer BF duration was associated with a higher subscapular SFT z‐score, a proxy of truncal fat. In accordance with a previous report on children, %FM assessed by SFT was correlated with %FM by DXA (Wohlfahrt‐Veje et al., 2014). The difference in adiposity assessed by DLW in our study was only evident after adjusting for age and sex in the multivariate analysis. This could be explained by the fact that SFT z‐scores were already adjusted by age and sex, whereas FM and FFM assessed by deuterium dilution were not adjusted. Another possibility could be the small sample size of the present study (n = 60) that could not demonstrate any significant difference in FM when the data were disaggregated into the shorter and longer BF groups.
It is possible to hypothesize that higher FM during early infancy among BF infants may help to support infants during the weaning period and promote a normal trajectory of adiposity and brain development (Cunnane, 2006; Gale et al., 2012). Another potential mechanism for higher FM in breastfed infants compared with formula‐fed infants, especially during the first 6 months of life, is the difference in macronutrient components, bioactive hormones, cytokines and growth factors between breast milk and infant formula. A lower protein‐to‐energy ratio of breast milk may lead to less FFM deposition during the infancy period (Huang et al., 2016). Additionally, human milk contains growth modulating bioactive compounds such as leptin, ghrelin, adiponectin, insulin and insulin‐like growth factor‐1 (IGF‐1), which may affect appetite regulation, energy balance and adiposity (Mazzocchi et al., 2019; Savino et al., 2009). Previous studies on breast milk adipokines found that a higher intake of leptin and adiponectin was associated with higher adiposity during the infancy period (Gridneva et al., 2018). Insulin and IGF‐1 may also trigger a proliferation of adipose cells as well as fat storage (Bartok & Ventura, 2009). However, our study found that the degree of association between the duration of solely BF and adiposity was attenuated after adjusting for the age at CF introduction and the previous growth trajectory (using the BMI z‐score at 2, 4 months as proxies). This may imply the possibility of reverse causality.
Previous systematic reviews found that early introduction of CF may increase the risk of childhood obesity (Moorcroft et al., 2011; Pearce et al., 2013). In contrast, we found an association between the later introduction of CF and higher adiposity at age 6–8 months. However, reverse causality cannot be ruled out since infants who received CF before 6 months of age tended to have a lower BMI z‐score at age 2 and 4 months than infants who started CF at 6 months and more. After additional adjusting for infant BMI z‐scores at age 2, 4 months in model 2, there was no significant association between the age of introduction of CF and body composition. This result is consistent with the Euro‐Growth References study, which found that infants starting CF at 4–5 months of age had lower WFA z‐scores at 4 months of age than infants starting CF at the age of ≥6 months (Haschke & van't Hof, 2000). This finding may be related to the decision to start CF early in infants with low WFA. A randomized controlled trial would be required to support any causal relationship.
Previous evidence shows that breastfed infants may learn to self‐regulate their energy intake better, whereas bottle‐fed infants might be less likely to display appetite regulation in later life (Koletzko et al., 2009). This effect might also be influenced by infant body composition. Recent studies found that there were higher BMI z‐scores and weight gain in infants receiving breast milk from bottles than in directly breastfed infants (Azad et al., 2018; Ventura, 2017). However, no association between BFI and body composition was found in our study. The small sample size may have precluded detecting an association in our research.
We also found that longer BF infants received lower energy and protein intake than shorter BF infants because breast milk contains lower protein compared with formula, and CF was started later in the longer BF group than the shorter BF group. However, the longer BF group still had a higher truncal fat mass than the shorter BF group. A possible explanation for these results may be the difference in energetic efficiency between breast milk and formula. A previous observation study showed that the energy requirement of formula‐fed infants was higher than breastfed infants by 7% at the age of 6 months (Fleddermann et al., 2014). It can be suggested that breastfed infants had higher energetic efficiency than formula‐fed infants. However, the higher energetic efficiency of breastfed infants could not totally explain higher FM in the longer BF group. A previous study suggested that the protein‐to‐energy ratio in diet may affect body composition (Wauben et al., 1995). Therefore, the lower protein‐to‐energy ratio in breast milk may result in less FFM deposit with excess energy accumulated as FM. Nevertheless, our results did not demonstrate a statistical difference in the dietary protein‐to‐energy ratio between the longer BF and shorter BF groups.
Furthermore, our study found that FMI was negatively associated with total energy intake. This finding is contrary to previous studies, suggesting that a higher energy intake may increase body fat mass (Fleddermann, et al., 2014). A possible explanation might be that infants who had low‐fat mass might have been given a higher total energy intake to catch up to their growth targets. A longitudinal study would help to confirm this effect.
The previous meta‐analysis found that maternal pre‐pregnancy BMI and gestational weight gain may be associated with higher infant adiposity (Castillo‐Laura et al., 2015). This result may be explained using the developmental origins of obesity theory. Early life exposure, including the intrauterine environment, may affect an increase in obesity risk in later life. However, our result was unable to demonstrate an association between maternal pre‐pregnancy BMI or gestational weight gain and infant adiposity. Our small sample size may have impacted our ability to detect a small or modest effect.
The key strengths of our study were the use of the DLW technique to assess infant body composition. We also included several variables in our study to minimize any confounding effects on the association between infant feeding and body composition. To our knowledge, this is the first study examining the association of BF duration, age at started CF and body composition in Thai infants, which may have differences in BF and complementary feeding practices to Western populations.
There were also several limitations in our study. Firstly, our cross‐sectional study cannot determine cause and effect relationship between BF duration, infant feeding practices and adiposity. A randomized control trial study would be required to support any cause and effect. Another study limitation is that anthropometry and body composition measures were obtained at 6–8 months of life, which does not reflect longitudinal growth. A further study requires longitudinal follow‐up to confirm this finding and observe the effect of BF on adiposity in later life. Lastly, the anthropometric data at the age of 2 and 4 months were retrieved from baby vaccination record books, which may have reduced reliability compared with the measurements at 6–8 months, which were performed by well‐trained research assistants in a standardized manner.
5. CONCLUSION
Longer duration of BF and later introduction of CF were associated with higher adiposity assessed by the deuterium dilution technique in Thai infants at the age of 6–8 months. These are novel findings as few previous studies have measured infant body composition using the stable isotope method and conducted such a study among Southeast Asian infants. These observations could be attributed to the fact that earlier infant growth trajectory was influenced by parental choices of infant feeding practices and vice versa. A longitudinal study throughout infancy and childhood may be able to shed lights on the longer‐term effects of these early changes in life on body composition.
AUTHOR CONTRIBUTIONS
Thanida Ua‐areechit was involved in the conception and design, data collection and compilation work, data analysis and interpretation, preparation of the manuscript. Orapa Suteerojntrakool was involved in the conception and design, data analysis and interpretation, preparation of the manuscript, revision of the manuscript, overall scientific management. Tippawan Pongcharoen was involved in the conception and design, data collection, laboratory analysis, revision of the manuscript, overall scientific management. Pattanee Winichagoon was involved in the conception and design, revision of the manuscript, overall scientific management. Kunchit Judprasong was involved in the laboratory analysis and overall scientific management. Alexia J. Murphy‐Alford was involved in the conception and design, providing essential materials, revision of the manuscript, overall scientific management. Warren T. K. Lee was involved in the conception and design, revision of the manuscript, providing essential materials, overall scientific management. Bubphachat Potip, Pimnapanut Sridonpai and Wanabhorn Tongchom was involved in the data collection and compilation work, data analysis. Sirinuch Chomtho was involved in the conception and design, data interpretation, preparation of the manuscript, revision of the manuscript, overall scientific management.
CONFLICT OF INTEREST
The authors declare no conflict of interest.
Supporting information
Supporting information.
ACKNOWLEDGMENTS
The authors would like to thank the FAO, IAEA, Institute of Nutrition, Mahidol University, and Pediatric Nutrition Research Unit, Department of Pediatrics, Faculty of Medicine, Chulalongkorn University, for their contributions to this study. The authors thank IAEA technical officers for their support and for sharing their expertise in the process leading to the development of the project and conducting the experimental work. They also would like to thank Ms Siritas Kettanurak and Dr Yuda Chongpison from the Research Affairs, Faculty of Medicine, Chulalongkorn University, for the statistical analysis. Lastly, the authors also greatly appreciate the support of parents and guardians of their participants. This study was funded by the Food and Agriculture Organization of the United Nations, LOA/RAP/2019/20 and International Atomic Energy Agency, RAS6092, and the Ratchadapiseksompotch Fund, Faculty of Medicine, Chulalongkorn University, grant number RA63/042.
Ua‐areechit, T. , Suteerojntrakool, O. , Pongcharoen, T. , Winichagoon, P. , Judprasong, K. , Murphy‐Alford, A. J. , Lee, W. T. K. , Potip, B. , Sridonpai, P. , Tongchom, W. , & Chomtho, S. (2023). Breastfeeding duration is associated with higher adiposity at 6–8 months of age. Maternal & Child Nutrition, 19, e13438. 10.1111/mcn.13438
DATA AVAILABILITY STATEMENT
Data described in the manuscript, codebook and analytic code will be made available upon request in a deidentified form pending review and approval of a formal request to the IAEA review committee.
REFERENCES
- Aris, I. M. , Bernard, J. Y. , Chen, L. W. , Tint, M. T. , Pang, W. W. , Lim, W. Y. , Soh, S.E. , Saw, S. M. , Godfrey, K. M. , Gluckman, P. D. , Chong, Y. S. , Yap, F. , Kramer, M. S. , & Lee, Y. S. (2017). Infant body mass index peak and early childhood cardio‐metabolic risk markers in a multi‐ethnic Asian birth cohort. International Journal of Epidemiology, 46(2), 513–525. 10.1093/ije/dyw232 [DOI] [PMC free article] [PubMed] [Google Scholar]
- Azad, M. B. , Vehling, L. , Chan, D. , Klopp, A. , Nickel, N. C. , McGavock, J. M. , Becker, A. B. , Mandhane, P. J. , Turvey, S. E. , Moraes, T. J. , Taylor, M. S. , Lefebvre, D. L. , Sears, M. R. , Subbarao, P. , & CHILD Study Investigators . (2018). Infant feeding and weight gain: Separating breast milk from breastfeeding and formula from food. Pediatrics, 142(4):e20181092. 10.1542/peds.2018-1092 [DOI] [PubMed] [Google Scholar]
- Bartok, C. J. , & Ventura, A. K. (2009). Mechanisms underlying the association between breastfeeding and obesity. International Journal of Pediatric Obesity, 4(4), 196–204. 10.3109/17477160902763309 [DOI] [PubMed] [Google Scholar]
- Blössner M., Siyam A., Borghi E., Onis M., Onyango A., & Yang H. (2010). WHO Anthro for personal computers, version 3.2.2, 2011: Software for assessing growth and development of the world's children. WHO. [Google Scholar]
- Butte, N. F. , Wong, W. W. , Hopkinson, J. M. , Smith, E. O. , & Ellis, K. J. (2000). Infant feeding mode affects early growth and body composition. Pediatrics, 106(6), 1355–1366. 10.1542/peds.106.6.1355 [DOI] [PubMed] [Google Scholar]
- Castillo‐Laura, H. , Santos, I. S. , Quadros, L. C. , & Matijasevich, A. (2015). Maternal obesity and offspring body composition by indirect methods: A systematic review and meta‐analysis. Cadernos de saúde pública/Ministério da Saúde, Fundação Oswaldo Cruz, Escola Nacional de Saúde Pública, 31(10), 2073–2092. 10.1590/0102-311x00159914 [DOI] [PubMed] [Google Scholar]
- Chomtho, S. , Wells, J. C. , Davies, P. S. , Lucas, A. , & Fewtrell, M. S. (2009). Early growth and body composition in infancy. Advances in Experimental Medicine and Biology, 646, 165–168. 10.1007/978-1-4020-9173-5_19 [DOI] [PubMed] [Google Scholar]
- Chomtho, S. , Wells, J. C. , Williams, J. E. , Davies, P. S. , Lucas, A. , & Fewtrell, M. S. (2008). Infant growth and later body composition: Evidence from the 4‐component model. American Journal of Clinical Nutrition, 87(6), 1776–1784. 10.1093/ajcn/87.6.1776 [DOI] [PubMed] [Google Scholar]
- Cunnane, S. C. (2006). [Survival of the fattest: The key to human brain evolution]. Medicine Sciences, 22(6–7), 659–663. 10.1051/medsci/20062267659 [DOI] [PubMed] [Google Scholar]
- de Bruin, N. C. , Degenhart, H. J. , Gàl, S. , Westerterp, K. R. , Stijnen, T. , & Visser, H. K. (1998). Energy utilization and growth in breast‐fed and formula‐fed infants measured prospectively during the first year of life. American Journal of Clinical Nutrition, 67(5), 885–896. 10.1093/ajcn/67.5.885 [DOI] [PubMed] [Google Scholar]
- Ejlerskov, K. T. , Christensen, L. B. , Ritz, C. , Jensen, S. M. , Mølgaard, C. , & Michaelsen, K. F. (2015). The impact of early growth patterns and infant feeding on body composition at 3 years of age. British Journal of Nutrition, 114(2), 316–327. 10.1017/s0007114515001427 [DOI] [PubMed] [Google Scholar]
- Eny, K. M. , Chen, S. , Anderson, L. N. , Chen, Y. , Lebovic, G. , Pullenayegum, E. , Parkin, P. C. , Maguire, J. L. , Birken, C. S. , & TARGet Kids! C . (2018). Breastfeeding duration, maternal body mass index, and birth weight are associated with differences in body mass index growth trajectories in early childhood. American Journal of Clinical Nutrition, 107(4), 584–592. 10.1093/ajcn/nqx081 [DOI] [PubMed] [Google Scholar]
- Fleddermann, M. , Demmelmair, H. , & Koletzko, B. (2014). Energetic efficiency of infant formulae: A review. Annals of Nutrition and Metabolism, 64(3–4), 276–283. 10.1159/000365034 [DOI] [PubMed] [Google Scholar]
- Gale, C. , Logan, K. M. , Santhakumaran, S. , Parkinson, J. R. , Hyde, M. J. , & Modi, N. (2012). Effect of breastfeeding compared with formula feeding on infant body composition: A systematic review and meta‐analysis. American Journal of Clinical Nutrition, 95(3), 656‐669. 10.3945/ajcn.111.027284 [DOI] [PubMed] [Google Scholar]
- Gridneva, Z. , Kugananthan, S. , Rea, A. , Lai, C. T. , Ward, L. C. , Murray, K. , Hartmann, P. E. , & Geddes, D. T. (2018). Human milk adiponectin and leptin and infant body composition over the first 12 months of lactation. Nutrients, 10(8):1125. 10.3390/nu10081125 [DOI] [PMC free article] [PubMed] [Google Scholar]
- Haschke, F. , & van't Hof, M. A. (2000). Euro‐Growth references for breast‐fed boys and girls: Influence of breast‐feeding and solids on growth until 36 months of age. Euro‐Growth Study Group. Journal of Pediatrics Gastroenterology and Nutrition, 31(Suppl. 1), S60–S71. 10.1097/00005176-200007001-00006 [DOI] [PubMed] [Google Scholar]
- Huang, P. , Zhou, J. , Yin, Y. , Jing, W. , Luo, B. , & Wang, J. (2016). Effects of breast‐feeding compared with formula‐feeding on preterm infant body composition: A systematic review and meta‐analysis. British Journal of Nutrition, 116(1), 132–141. 10.1017/s0007114516001720 [DOI] [PubMed] [Google Scholar]
- Institute of Nutrition . (2018). Nutrients calculation software: INMUCAL‐Nutrients version 4.0 Database version NB.4. Mahidol University. [Google Scholar]
- International Atomic Energy Agency (IAEA) . (2009). IAEA Human Health Series No. 3: Assessment of body composition and total energy expenditure in humans using stable isotope techniques. [Google Scholar]
- Jin, H. , Shan, T. , Li, S. , Fan, X. , Zhao, Y. , Li, J. , Tang, X. , Saffery, R. , Tong, C. , Wen, L. , Qi, H. , Kilby, M. D. , & Baker, P. N. (2022). Association of infant feeding patterns with body fat mass and obesity in the first 2 years of life: A longitudinal twin birth cohort study. International Journal of Food Sciences and Nutrition, 73(2), 263–273. 10.1080/09637486.2021.1968357 [DOI] [PubMed] [Google Scholar]
- Koletzko, B. , von Kries, R. , Closa, R. , Escribano, J. , Scaglioni, S. , Giovannini, M. , Beyer, J. , Demmelmair, H. , Anton, B. , Gruszfeld, D. , Dobrzanska, A. , Sengier, A. , Langhendries, J.P. , Rolland Cachera, M.F. , & Grote, V. (2009). Can infant feeding choices modulate later obesity risk? American Journal of Clinical Nutrition, 89(5), 1502S–1508S. 10.3945/ajcn.2009.27113D [DOI] [PubMed] [Google Scholar]
- Kramer, M. S. , Guo, T. , Platt, R. W. , Sevkovskaya, Z. , Dzikovich, I. , Collet, J. P. , Shapiro, S. , Chalmers, B. , Hodnett, E. , Vanilovich, I. , Mezen, I. , Ducruet, T. , Shishko, G. , & Bogdanovich, N. (2003). Infant growth and health outcomes associated with 3 compared with 6 mo of exclusive breastfeeding. American Journal of Clinical Nutrition, 78(2), 291–295. 10.1093/ajcn/78.2.291 [DOI] [PubMed] [Google Scholar]
- Lanigan, J. A. , Wells, J. C. , Lawson, M. S. , & Lucas, A. (2001). Validation of food diary method for assessment of dietary energy and macronutrient intake in infants and children aged 6‐24 months. European Journal of Clinical Nutrition, 55(2), 124–129. 10.1038/sj.ejcn.1601128 [DOI] [PubMed] [Google Scholar]
- Li, R. , Scanlon, K. S. , May, A. , Rose, C. , & Birch, L. (2014). Bottle‐feeding practices during early infancy and eating behaviors at 6 years of age. Pediatrics, 134(Suppl. 1), S70–S77. 10.1542/peds.2014-0646L [DOI] [PMC free article] [PubMed] [Google Scholar]
- Mazzocchi, A. , Giannì, M. L. , Morniroli, D. , Leone, L. , Roggero, P. , Agostoni, C. , De Cosmi, V. , & Mosca, F. (2019). Hormones in breast milk and effect on infants’ growth: A systematic review. Nutrients, 11(8):1845. 10.3390/nu11081845 [DOI] [PMC free article] [PubMed] [Google Scholar]
- Mills A., & Tyler H. (1992). Food and nutrient intakes of British infants aged 6‐12 months. HMSO Publications Centre. [Google Scholar]
- Moorcroft, K. E. , Marshall, J. L. , & McCormick, F. M. (2011). Association between timing of introducing solid foods and obesity in infancy and childhood: A systematic review. Maternal & Child Nutrition, 7(1), 3–26. 10.1111/j.1740-8709.2010.00284.x [DOI] [PMC free article] [PubMed] [Google Scholar]
- National Statistical Office & United Nations Children's Fund . (2016). Thailand multiple indicator cluster survey 2015‐2016, Survey Findings Report. National Statistical Office and United Nations Children's Fund. [Google Scholar]
- National Statistical Office of Thailand . (2020). Thailand multiple indicator cluster survey 2019, Final Report. National Statistical Office and United Nations Children's Fund. [Google Scholar]
- Pearce, J. , Taylor, M. A. , & Langley‐Evans, S. C. (2013). Timing of the introduction of complementary feeding and risk of childhood obesity:A systematic review. International Journal of Obesity, 37(10), 1295–1306. 10.1038/ijo.2013.99 [DOI] [PubMed] [Google Scholar]
- Qiao, J. , Dai, L. J. , Zhang, Q. , & Ouyang, Y. Q. (2020). A meta‐analysis of the association between breastfeeding and early childhood obesity. Journal of Pediatric Nursing, 53, 57–66. 10.1016/j.pedn.2020.04.024 [DOI] [PubMed] [Google Scholar]
- Robinson, S. M. , Marriott, L. D. , Crozier, S. R. , Harvey, N. C. , Gale, C. R. , Inskip, H. M. , Baird, J. , Law, C. M. , Godfrey, K. M. , Cooper, C. , & Southampton Women's Survey Study Group . (2009). Variations in infant feeding practice are associated with body composition in childhood: A prospective cohort study. Journal of Clinical Endocrinology and Metabolism, 94(8), 2799–2805. 10.1210/jc.2009-0030 [DOI] [PubMed] [Google Scholar]
- Savino, F. , Liguori, S. A. , Fissore, M. F. , & Oggero, R. (2009). Breast milk hormones and their protective effect on obesity. International Journal of Pediatric Endocrinology, 2009, 327505. 10.1155/2009/327505 [DOI] [PMC free article] [PubMed] [Google Scholar]
- Sun, J. , Nwaru, B. I. , Hua, J. , Li, X. , & Wu, Z. (2017). Infant BMI peak as a predictor of overweight and obesity at age 2 years in a Chinese community‐based cohort. BMJ Open, 7(10), e015122. 10.1136/bmjopen-2016-015122 [DOI] [PMC free article] [PubMed] [Google Scholar]
- Tahir, M. J. , Ejima, K. , Li, P. , Demerath, E. W. , Allison, D. B. , & Fields, D. A. (2021). Associations of breastfeeding or formula feeding with infant anthropometry and body composition at 6 months. Maternal & child nutrition, 17(2), e13105. 10.1111/mcn.13105 [DOI] [PMC free article] [PubMed] [Google Scholar]
- Toschke, A. M. , Martin, R. M. , von Kries, R. , Wells, J. , Smith, G. D. , & Ness, A. R. (2007). Infant feeding method and obesity: Body mass index and dual‐energy X‐ray absorptiometry measurements at 9‐10 y of age from the avon longitudinal study of parents and children (ALSPAC). American Journal of Clinical Nutrition, 85(6), 1578–1585. 10.1093/ajcn/85.6.1578 [DOI] [PubMed] [Google Scholar]
- Ventura, A. K. (2017). Developmental trajectories of bottle‐feeding during infancy and their association with weight gain. Journal of Developmental and Behavioral Pediatrics, 38(2), 109–119. 10.1097/dbp.0000000000000372 [DOI] [PubMed] [Google Scholar]
- Wauben, I. , Westerterp, K. , Gerver, W. J. , & Blanco, C. (1995). Effect of varying protein intake on energy balance, protein balance and estimated weight gain composition in premature infants. European Journal of Clinical Nutrition, 49(1), 11–16. [PubMed] [Google Scholar]
- Wells, J. C. , Cole, T. J. , & ALSPAC Study Team . (2002). Adjustment of fat‐free mass and fat mass for height in children aged 8 y. International Journal of Obesity and Related Metabolic Disorders, 26(7), 947–952. 10.1038/sj.ijo.0802027 [DOI] [PubMed] [Google Scholar]
- Wohlfahrt‐Veje, C. , Tinggaard, J. , Winther, K. , Mouritsen, A. , Hagen, C. P. , Mieritz, M. G. , de Renzy‐Martin, K. T. , Boas, M. , Petersen, J. H. , & Main, K. M. (2014). Body fat throughout childhood in 2647 healthy Danish children: Agreement of BMI, waist circumference, skinfolds with dual X‐ray absorptiometry. European Journal of Clinical Nutrition, 68(6), 664–670. 10.1038/ejcn.2013.282 [DOI] [PubMed] [Google Scholar]
- World Health Organization . (2001). The optimal duration of exclusive breastfeeding: Report of the expert consultation Geneva, Switzerland 28–30 March 2001. [Google Scholar]
- World Health Organization . (2021). Exclusively breastfeed for 6 months. http://www.emro.who.int/nutrition/breastfeeding/index.html
- World Health Organization, & United Nations Children's Fund . (2018). Enabling women to breastfeed through better policies and programmes: Global breastfeeding scorecard 2018. https://apps.who.int/nutrition/publications/infantfeeding/global-bf-scorecard-2018.pdf?ua=1
- World Health Organization, & United Nations Children's Fund . (2019). Global breastfeeding scorecard, 2019: Increasing commitment to breastfeeding through funding and improved policies and programmes. [Google Scholar]
Associated Data
This section collects any data citations, data availability statements, or supplementary materials included in this article.
Supplementary Materials
Supporting information.
Data Availability Statement
Data described in the manuscript, codebook and analytic code will be made available upon request in a deidentified form pending review and approval of a formal request to the IAEA review committee.