Abstract
The cellular tumor antigen p53 is a key component in cell cycle control. The mutation Y220C heavily destabilizes the protein thermally but yields a druggable crevice. We have screened the diversity-optimized halogen-enriched fragment library against T-p53C-Y220C with STD-NMR and DSF to identify hits, which we validated by 1H,15N-HSQC NMR. We could identify four hits binding in the Y220C cleft, one hit binding covalently and four hits binding to an uncharacterized binding site. Compound 1151 could be crystallized showing a flip of C220 and thus opening subsite 3. Additionally, 4482 was identified to alkylate cysteines. Data shows that the diversity-optimized HEFLib leads to multiple diverse hits. The identified scaffolds can be used to further optimize interactions with T-p53C-Y220C and increase thermal stability.
Fragment screening of the challenging drug target T-p53-Y220C with our diversity optimized HEFLib leads to diverse reversible and covalent binding modes.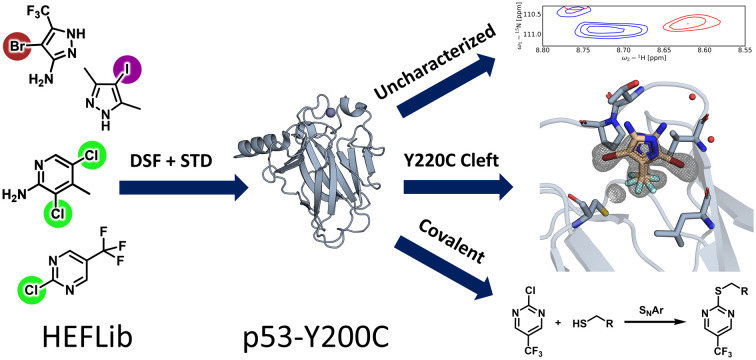
1. Introduction
The cellular tumor antigen p53 plays a crucial role in cell cycle regulation.1 Upregulation can lead to e.g. cell cycle arrest and apoptosis.2,3 p53 acts as a tumor suppressor and is most frequently inactivated in cancer either through direct mutation of p53 or through perturbation of its associated pathways. As a consequence, reactivation of p53 function in tumors is perceived as a prime target for therapeutic intervention.4–8
The low thermal stability makes handling and thus research of p53 and/or the DNA binding domain (p53C, residues 94–312) challenging. A quadruple mutant (M133L/V203A/N239Y/N268D) was designed, increasing thermal stability by about 5.6 °C.9 This thermally stabilized mutant, commonly called “T-p53”, has become a standard for biophysical experiments.
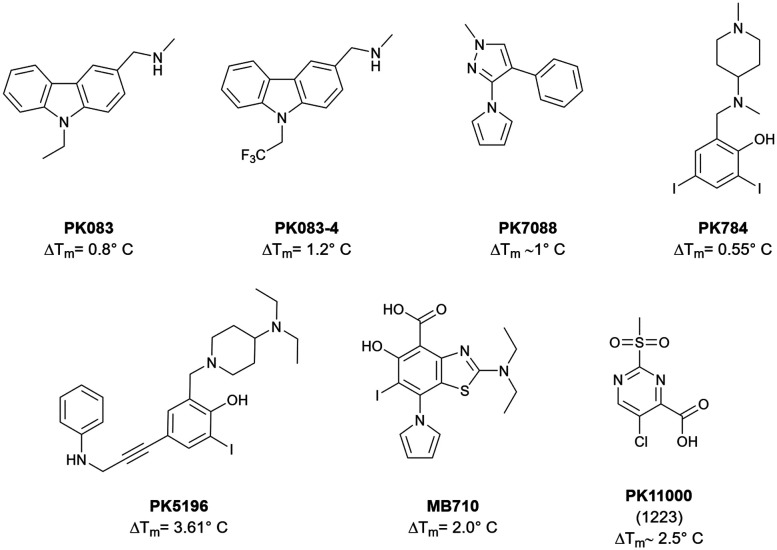
The mutation Y220C, located in the core domain, is one of the well-known hotspots.10 The substitution of tyrosine to cysteine thermally destabilizes the core domain by about 8 °C.11 However, this mutation yields a small, hydrophobic cleft. Early work in targeting this Y220C cavity has yielded a carbazole derivate, PK083 that stabilizes T-p53C-Y220C by 0.8 °C (125 μM cmpd. conc.).12 Trifluorination at the N-ethyl anchor of PK083 improved the stabilization to 1.2 °C (125 μM cmpd. conc.) by benefiting from multipolar interactions and fluorine–sulfur contacts.13 This compound and other selected are depicted in Fig. 1.
Fig. 1. An exemplary selection of published T-p53C-Y220C binders.12–17 Compounds PK083 and PK784 occupy the central cavity and subsite 1, while PK5196, PK7088 and MB710 additionally bind subsite 2. The pyrrole group of PK784 and MB710 also enables them to engage to the deep subsite 3. PK11000 showed covalent addition to multiple cysteines.
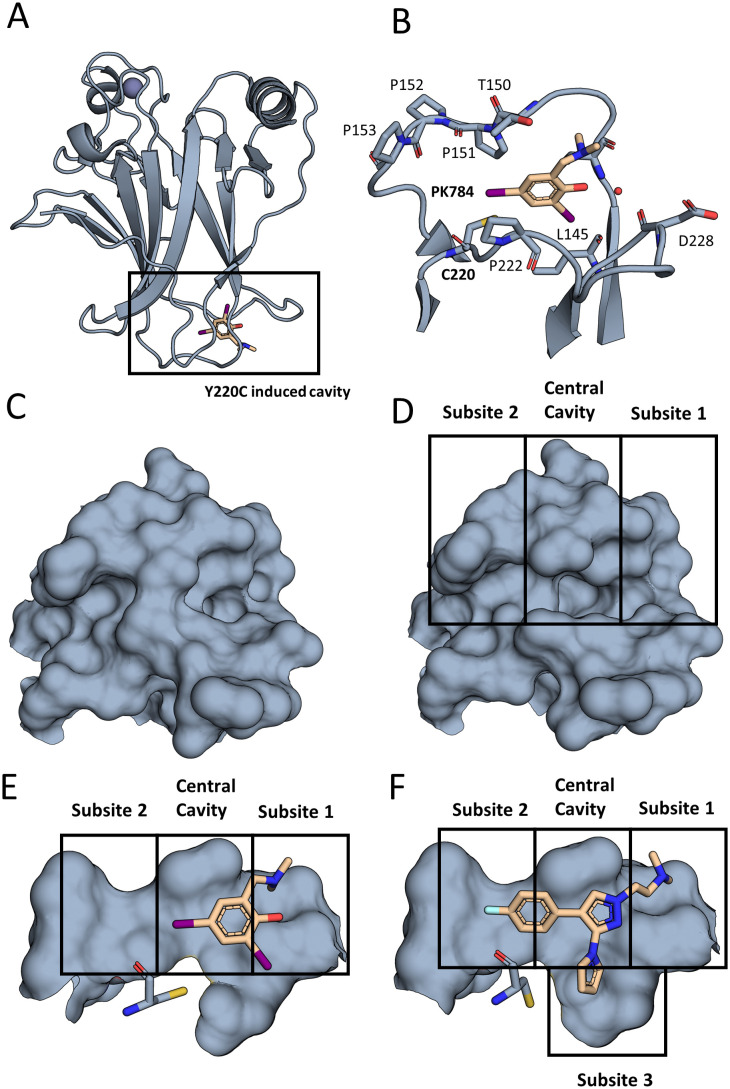
Quantum chemical analysis of the cavity showed that Leu145 can be addressed by halobenzene moieties, which initially led to the design of a halogen-enriched fragment library.14 The 2,4-diiodophenol derivative PK784 was identified and crystallized, showing that a halogen bond with Leu145 as postulated is formed. Also, the compound increases the melting temperature by 0.55 °C (250 μM cmpd. conc.). Optimization of this scaffold led to PK5196, stabilizing T-p53C-Y220C by 3.61 °C (250 μM cmpd. conc.) using an acetylene linker to extend into subsite 2, illustrated in Fig. 2.14
Fig. 2. The Y220C mutation leads to a druggable cleft. (A) Overall view of T-p53C-Y220C bound to PK784 (4AGL14). The location of the mutation is highlighted, leading to a druggable cleft. (B) PK784 engages in a halogen bond with L145. The other iodine points towards subsite 2 and can be used as vector for ligand growing. (C) Surface representation of Y220 and surrounding amino acids in T-p53C (1UOL18). (D) The mutation opens the central cavity, connecting subsite 1 and subsite 2 (4AGL14). (E) The lower part of the cleft is not targeted as C220 points towards the compound. (F) Upon binding of an electron rich group, e.g. pyrrole in PK7242, the cysteine is displaced enlarging subsite 3 and enabling targeting (3ZME15).
Later efforts identified PK7088 from a fragment library as a Y220C cleft binder, bearing a different scaffold. Interestingly, the pyrrole sidechain of this compound points into a deep internal cavity (subsite 3, Fig. 2) formed by a flip of C220, leading to a stabilization of 1 °C (350 μM cmpd. conc.).15
Based on this discovery, the aminobenzothiazole derivative MB710 was synthesized, linking the diiodophenol scaffold to the pyrrolo sidechain. This structure yields a thermal stabilization by 2 °C (250 μM cmpd. conc.).16
These promising results were the basis for the design of a diversity-optimized halogen-enriched fragment library (HEFLib).19 In this generalized HEFLibs approach, aiming for a collection of chemical probes for investigating halogen bonding by fragment-based drug discovery,20 library design and selection principles became independent from the initial target-focused approach.14 From kinase drug discovery, we learned that molecular design of halogen bonds at an advanced state of the lead optimization process can be quite challenging and does not necessarily reach its full potential to improve ligand affinities.21 Thus, we concluded that focusing on the earliest stages of the drug discovery process by generalizing our HEFLib's strategy can also provide the chance to establish unconventional binding modes based on specific halogen bonding motifs and allows to harness the chemotypes of such hits as novel lead structures with great impact on patentability.19,20 As the design was led by diversity and limited by availability, only 14 of the 191 compounds contain an iodine. This also means that compounds with strongly tuning groups were not specifically selected. The compounds based on PK784 on the other hand contain an iodine and a positive charge, leading to strong tuning effects.22
In principle, there is a multitude of suitable electron-rich interaction partners for accepting a halogen bond in a typical binding site:23 the backbone carbonyl,24,25 the peptide bond,26 the sulfur of methionine27 or cysteine, the nitrogen of histidine,28 the oxygen of the hydroxyl group of serine, threonine or tyrosine, the carboxamides of asparagine and glutamine, as well as the carboxylates of aspartate and glutamate,29 and the π-systems of phenylalanine, tyrosine, tryptophan, or histidine.
Based on this abundance of interaction partners and the different construction of the generalized HEFLib, we deemed it an interesting experiment to revisit the challenging binding site of T-p53C-Y220C with such an unbiased library. It is noteworthy that this diversity-optimized HEFLib has been thoroughly tested and characterized, resulting in many different hits on various targets.30–32
Another approach for stabilization was identified by covalent modification of cysteines other than C220.17 A 2-sulfonylpyrimidine was identified that covalently modifies C182 and C277, increasing the Tm up to about 2.5 °C without losing affinity towards DNA. This effect is independent of the Y220C mutation, which makes it a great candidate for a general T-p53C stabilization approach.
As the thermal destabilization of the Y220C mutation is of greatest concern, we performed differential scanning fluorimetry (DSF) as one of our primary screening techniques. Additionally, we used saturation transfer difference (STD) NMR for hit identification. Comparing target binding to its functional results by these two techniques can yield valuable insights for the drug discovery process. All hits found by these independent techniques were validated by 1H,15N-HSQC. Thus, binding modes independent of the Y220C induced cleft were detectable during primary screening as well and were classified through the validation process.
2. Results and discussion
In total, 14 hits were identified by the primary screens, of which ten were confirmed by 1H,15N-HSQC. A compound was considered as a hit if either the STD signal was sufficiently larger than the local background noise or if the ΔTm was greater than 0.5 °C,33 measured by DSF. Because it was shown that fragments can also stabilize T-p53C-Y220C through alkylation of surface-exposed cysteines rather than binding in the Y220C cleft,17 we performed GSH reactivity measurements with each 1H,15N-HSQC hit as a surrogate assay for covalent binding. These measurements were also used for general stability assessment, as it is possible that strongly tuned halogenated fragments can be degraded via a SNAr-type reaction.30 All hits identified in this study are summarized in Table 1. For clarity and simplicity the HEFLib IDs were reduced to their last four digits.
All hits identified in this study are listed. A compound was considered as a hit if either the STD signal was present or the ΔTm was larger than 0.5 °C. The 1H,15N-HSQC indicates if significant peak shifts were observed. The GSH column indicates the measured stability with GSH. Because compound 1151 does not contain a C–H bond, no STD spectrum can be recorded. Only 1H,15N-HSQC hits were measured for GSH stability. For the STD experiments a protein to ligand ratio of 20 μM : 1 mM (1 : 50), for DSF 6 μM : 1 mM (1 : 125) and HSQC 65 μM : 2 mM (1 : 30) was used.
| Compound | ΔTm [°C] | STD | HSQC | t 1/2 GSH [h] |
|---|---|---|---|---|
| 0116 | −0.05 | Yes | Yes | >100 |
| 0403 | 0.05 | Yes | No | — |
| 0404 | −0.10 | Yes | Yes | >100 |
| 0459 | −0.05 | Yes | Yes | >100 |
| 0522 | 0.30 | Yes | No | — |
| 0660 | 0.10 | Yes | No | — |
| 1151 | 0.80 | NA | Yes | >100 |
| 1218 | −0.20 | Yes | Yes | >100 |
| 1223 | 2.0–2.55 | Yes | Yes | 0.81 |
| 1243 | −0.25 | Yes | Yes | >100 |
| 1246 | 0.15 | Yes | No | — |
| 4482 | 0.5–1.75 | No | Yes | 2.8 |
| 7394 | −0.15 | Yes | Yes | 61 |
| 7405 | 0.20 | Yes | Yes | >100 |
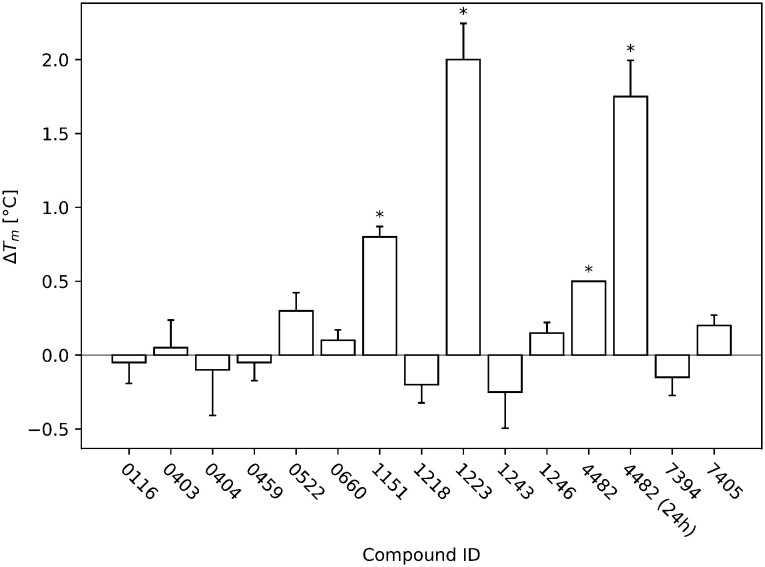
The DSF results of the triplicate measurement of the STD and DSF hits during the screen are shown in Fig. 3. The compounds that were considered hits are all significant (p < 0.05) compared to the reference.
Fig. 3. The DSF screening results of all identified initial hits are displayed. The T-p53C-Y220C concentration was 8 μM and the ligand concentration 1 mM (ratio 1 : 125). The DSF runs were started after 30 min of incubation. All temperature changes that were significant (p < 0.05) compared to the reference (T-p53C-Y220C without ligand) of the respective run are marked with an asterisk. During the run of 4482, all three measurements showed exactly the same difference to the reference and therefore no error bar is displayed. Additionally, for 4482 another run with 24 h incubation is displayed, showing time dependent increase in stabilization.
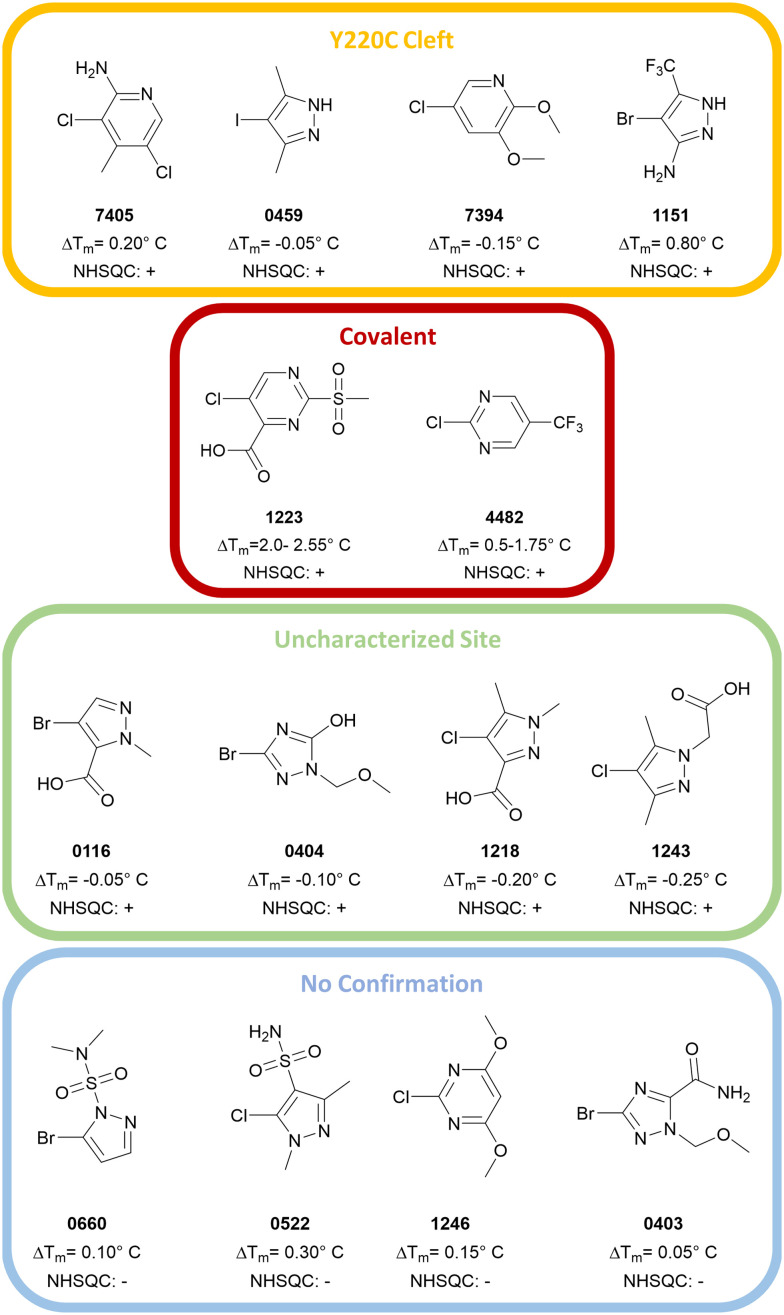
Based on the 1H,15N-HSQC data, hits could be categorized into three groups. By comparing the peak shifts with the 1H,15N-HSQC spectra of crystallographically confirmed Y220C cleft binders,12,14 one group was identified as the Y220C cleft binding group. Another group was confirmed to bind covalently to T-p53C-Y220C. The third set contained significant peak shifts but does not suggest Y220C cleft binding. The chemical structure and corresponding group are depicted in Fig. 4.
Fig. 4. Overview of the hits from the primary screens. Hits confirmed by 1H,15N-HSQC were categorized as either Y220C cleft binders (0459, 1151, 7394, 7405), covalent binders (1223/PK11000, 4482) or binders to an uncharacterized site (0116, 0404, 1218, 1243). The compounds 0660, 0522, 1246 and 0403 could not be confirmed by 1H,15N-HSQC.
2.1. Targeting the Y220C cleft
Four compounds (0459, 1151, 7394 and 7405) showed at least one peak shift, common to published cleft binders. However, none of the 1H,15N-HSQC hits yielded fittable ITC spectra (data not shown), they contain partially new scaffolds. The compound 7405 contains a meta-di-halogen moiety vicinal to an H-bond donor (amine). This compound has similarity to the first structure with confirmed halogen bonding to T-p53C-Y220C (PK784, Fig. 1 and 2). This scaffold can give rise to new synthetic routes and modifications.
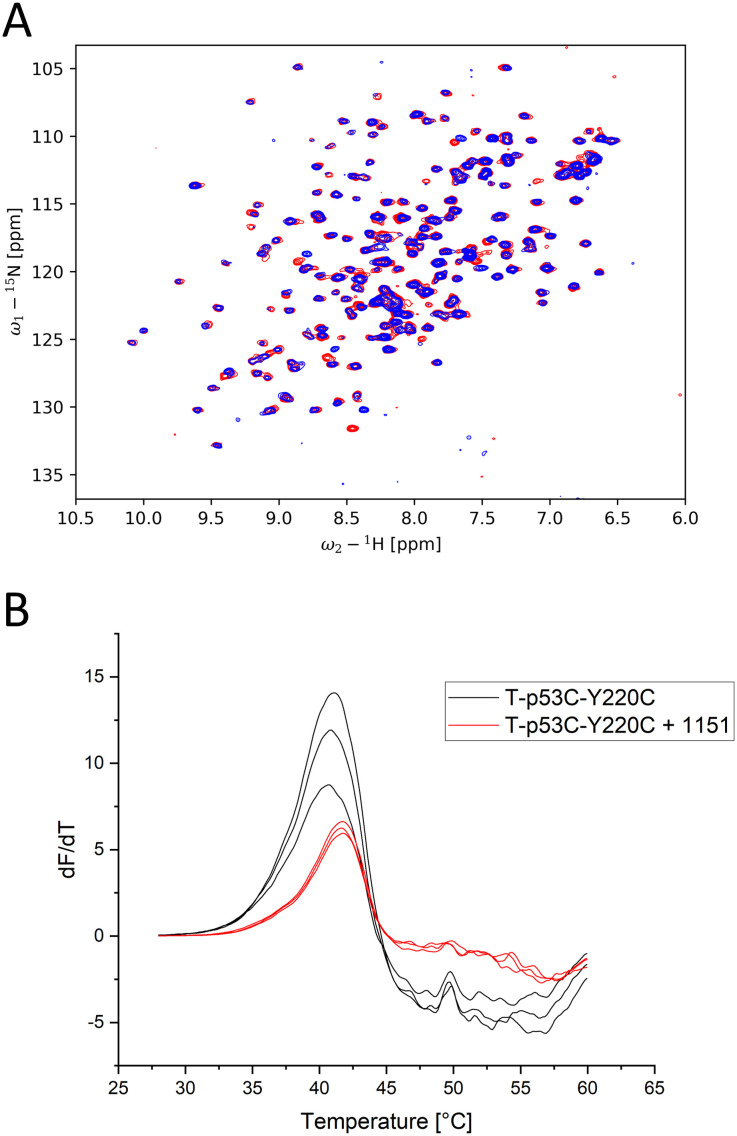
Of the proposed cleft-binding compounds, only compound 1151 stabilized the protein by more than 0.5 °C. The 1H,15N-HSQC spectrum (Fig. 5A) shows multiple peak shifts indicating cleft binding. The DSF curves with addition of 1151 (ratio 1 : 125), shown in Fig. 5B, are shifted by 0.8 °C.
Fig. 5. (A) 1H,15N-HSQC of T-p53C-Y220C with 1151 at 2 mM (blue) and without addition of a ligand (red). Multiple peak shifts can be observed, all of which indicate Y220C cleft binding. (B) First derivative of the melting curves of T-p53C-Y220C and T-p53C-Y220C with 1151 of the initial screen (30 min incubation).
Compounds 0459 and 1151 both contain a pyrazole scaffold with a halogen in position 4. A structure was solved of T-p53C-Y220C bound to 1151 (PDB: 8A92). Data collection and refinement statistics are displayed in Table 2. The structure, especially in chain A, indicates multiple binding poses, which could be identified by the anomalous signal of the bromine (Fig. 6). For chain B the occupancy was low and only one pose was built. The poses show that the CF3 group points towards the cleft and the bromine pointing towards L145 or the subsite 2. The electron-rich CF3 group displaces C220, opening subsite 3. This binding pose is similar to the ones containing a pyrrole ring, e.g. MB710 (Fig. 1 and 2). Even though the compound has a low KD value (>1 mM, based on non-fittable ITC data) it stabilizes T-p53C-Y220C by about 0.8 °C. It is likely that the binding is driven by hydrophobic interactions of the CF3 group to the cleft. No electron density could be observed for the amine.
Data collection and refinement statistics of the dataset of T-p53C-Y220C soaked with compound 1151 (PDB: 8A92). Values in parentheses indicate the respective value of the highest resolution bin.
| Compound 1151 (PDB: 8A92) | |
|---|---|
| Wavelength [Å] | 0.92 |
| Space group | P212121 |
| Cell dimensions | |
| a, b, c [Å] | 65.1, 74.1, 105.2 |
| α, β, γ [°] | 90, 90, 90 |
| Resolution range [Å] | 50–1.37 (1.45–1.37) |
| Redundancy | 13.2 (13.3) |
| Completeness [%] | 100 (100) |
| Mean I/σ(I) | 14.4 (1.0) |
| R-meas [%] | 11.7 (256.8) |
| CC1/2 [%] | 99.9 (49.7) |
| Wilson B [Å2] | 22.8 |
| Resolution included [Å] | 43.68–1.37 |
| R work/Rfree [%] | 15.32/18.32 |
| Bond RMSD [Å] | 0.008 |
| Angle RMSD [°] | 0.99 |
| Ramachandran [%] (favored/allowed/outliers) | 98.98/1.02/0 |
| Rotamer outliers [%] | 1.43 |
| All-atom Clashscore | 1.44 |
| Average B factor [Å2] | |
| Overall | 22.34 |
| Protein | 20.03 |
| Ligand | 41.4 |
| Water | 35.58 |
Fig. 6. (A) Electron density is displayed in grey around the compound 1151 as an unbiased omit map contoured at 3σ. In chain A two binding poses can be seen. In both poses the CF3 group points towards C220 and engages in hydrophobic contacts. (B) The unbiased anomalous difference map is contoured at 4.5σ in orange. The signal shows that the bromine is located in two positions, but not towards C220. (C) The halogen engages in a halogen bond, with a distance of 3.0 Å and an angle of 153.4°. Residues in 4.5Å around the CF3 group are displayed.
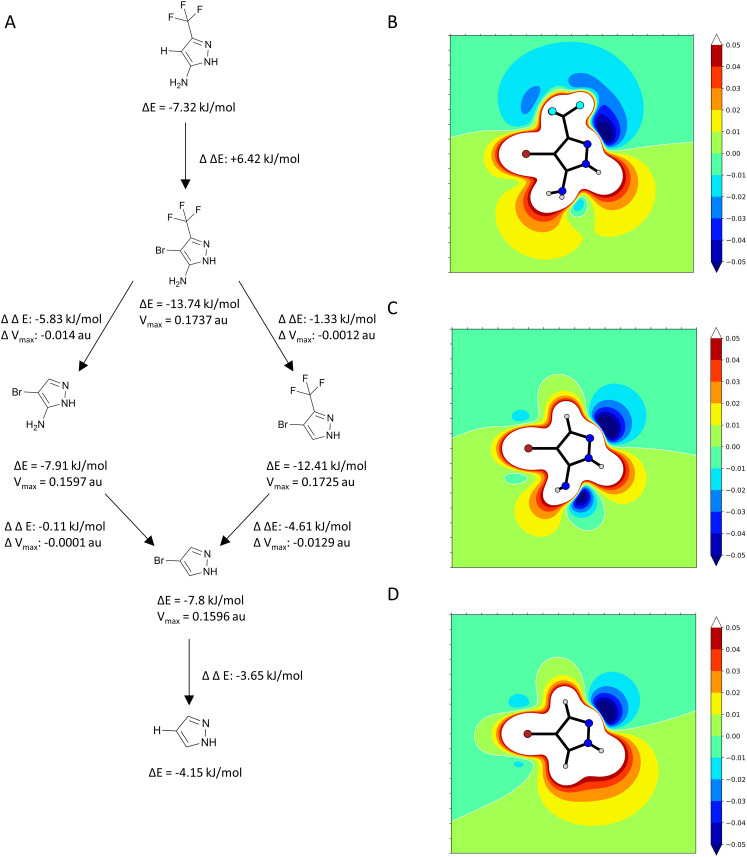
In one pose the bromine points towards the backbone oxygen of L145 with a distance of 3.0 Å and an angle of 153.4°. Based on this pose we calculated the adduct-formation energy of the compound and N-methylacetamide as a backbone model. In order to estimate the effect of the CF3-group we calculated the Vmax at an isodensity level of 0.02 au and the adduct-formation energy (ΔE) of 1151 and closely related scaffolds at the MP2/TZVPP level of theory. The results are displayed in Fig. 7. In addition, this bromine accepts an orthogonal hydrogen bond from the backbone nitrogen of T230.
Fig. 7. (A) Flowchart of the effects on adduct-formation energy (ΔE) and Vmax by systematically adding or removing substituents based on 1151. The CF3 group has the largest effect on ΔE and Vmax. (B) ESP plot of 1151. (C) ESP plot of 1151 after removing the CF3 group. (D) ESP plot of 1151 after removing the CF3 and NH2 group.
The CF3 group is the main contributor for the tuning of the system, increasing the Vmax from 0.1597 au to 0.1737 au, comparable with iodobenzene (0.182 au).34 As the amine only has a small effect on tuning, the vector could be used for fragment growing. Another approach could be converting the amine to a tertiary amine, adding a positive charge and once more strongly tune the system.22
2.2. Covalent modification
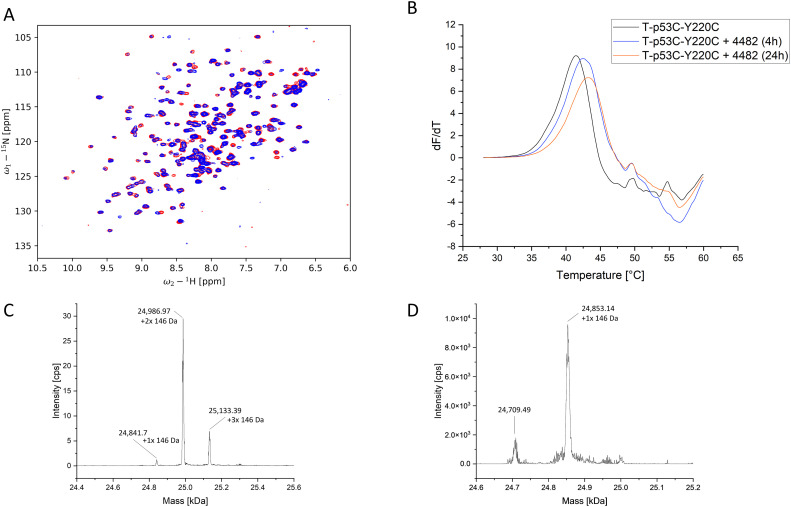
Because the 2-sulfonylpyrimidine PK11000 (Fig. 1) was added to the HEFLib with the ID 1223, a positive control for covalent modification was present. The glutathione assays confirmed that each fragment measured was stable with a half-life greater than 20 h, with the exception of 4482 and the positive control as aforementioned. A half-life of 2.8 h was observed for compound 4482, which indicated a covalent reaction with the protein. The 1H,15N-HSQC, as displayed in Fig. 8, shows large peak shifts, similar to PK11000, also suggesting covalent modification. We were able to confirm covalent binding by mass spectrometry. The deconvoluted ESI-MS spectrum (Fig. 8, panel C) indicates that after 4 h of incubation with a molar protein-to-compound ratio of 1 : 125 up to three molecules of 4482 were bound to T-p53C-Y220C. Among them, the species with two attached molecules showed highest intensity. Unmodified protein was not detectable. In contrast, the MS spectrum of the triple mutant C124/182/277S, shows only the species with one bound fragment. Unmodified protein could be identified. This indicates that covalent binding of 4482 to the now absent cysteines occurs. Using DSF measurements, a time-dependent stabilization could be identified (Fig. 8). The ΔTm of T-p53C-Y220C increased from 0.9 °C after 4 h incubation up to 1.75 °C after a 24 h incubation period.
Fig. 8. (A) 1H,15N-HSQC of T-p53C-Y220C without compound (red) and 2 mM 4482 (blue). Multiple prominent peak shifts can be observed. (B) First derivative of the melting curve of T-p53C-Y220C and T-p53C-Y220C with 4482 after 4 h and 24 h incubation. (C) Deconvoluted ESI-MS spectrum of T-p53C-Y220C (50 μM) with 6.25 mM 4882 after 4 h incubation at 20 °C. The shift of the peaks is about 146 Da, which corresponds to the size of the attached 4482. (D) Deconvoluted ESI-MS spectrum of T-p53C-C124/182/277S (50 μM) with 6.25 mM 4482 after 4 h incubation at 20 °C. The major peak corresponds to the single alkylated protein.
In comparison, PK11000 resulted in a larger stabilization of T-p53C-Y220C up to a maximum ΔTm of about 2.5 °C. In contrast to 4482, a maximum number of two modified cysteines was evident in the ESI-MS spectra of PK11000. This highlights the selectivity of PK11000 for specific p53 cysteines.17
Interestingly, Bauer et al.17 could not detect any stabilization by the compound 2-chloro-5-(fluoromethyl)-pyrimidine. We measured significant stabilization with 4482, the trifluoro analog of the compound. This emphasizes the need of the CF3 moiety as a strong electron-withdrawing group (EWG) for covalent binding. In general, compound 4482 contains a similar scaffold to the known covalent modifier PK11000. Both are pyrimidines with leaving groups in position 2 and additional EWGs to enhance SNAr reactivity. These structural similarities should explain their comparable behavior towards T-p53C and T-p53C-Y220C. Moreover, it demonstrates the potential of their common scaffold as a covalent, Y220C-cleft independent, rescue for the oncogenic p53-Y220C mutant.
2.3. Identification of an uncharacterized site
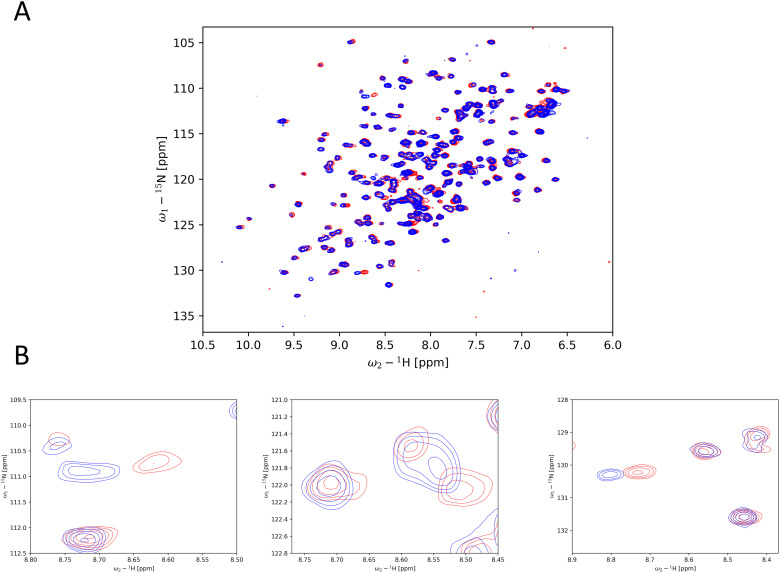
Compounds 0116, 0404, 1218, 1243 and did not show typical peak shifts of previously described peaks. Examples of these peak shifts are displayed in Fig. 9. As there is no structural confirmation of another binding site, it is difficult to interpret the reason for the peak shift. The lack of a deep cavity or cleft makes targeting of p53C very difficult. All compounds with the exception of 0404 contain a carboxyl group, which could engage in loose binding to the positively charged DNA binding interface of p53C and lead to the aforementioned peak shifts. Comparing the two prominent shifts (ω1 = 130.29 ppm, ω2 = 8.8 ppm; ω1 = 110.9 ppm, ω2 = 8.73 ppm) to the spectra of PK11000 or 4482, similar shifts can be observed. This could indicate, that the mostly uncharacterized binding site is near any of the alkylated cysteines.
Fig. 9. Example of peak shifts of an uncharacterized binding site. (A) Overlay of peak shifts shown by compound 0116 at 2 mM (blue) in comparison to reference (no ligand) (red). (B) Typical peak shifts observed in the subgroup of the binders to an uncharacterized binding site.
3. Conclusion
The lack of specific cancer treatment for p53-Y220C and high amount of annual cases of an estimated 130 000 underlines the importance of continuous drug discovery for this target.35–38 The first confirmation of halogen bonding in T-p53C-Y220C led to the development of the diversity-optimized HEFLib. A total of ten hits from this diversity-optimized library could be confirmed by 1H,15N-HSQC. The development of a Vmax-optimized HEFLib could lead to an improvement of the hit rate.30 The diversity-optimized HEFLib did not yield another low Millimolar binding compound, but identified a multitude of diverse scaffolds binding to the protein. These scaffolds can now be further exploited by optimizing target binding and more importantly stabilization.
The HEFLib additionally produced more unconventional binding modes, by containing a covalent binder. This modification is independent of the Y220C mutation and could potentially lead to general purpose stabilizers with much broader applicability in the rescue of destabilized p53 cancer mutants. Another aim could be modifying these scaffolds to reestablish or modulate DNA binding in hot-spot mutations which loose their function based on altered DNA contacts.
Many of the identified and confirmed hits did not interact in the Y220C mutation-induced cavity as we had anticipated. For these hits further studies are needed to reveal their binding site and its possible implication for altering or rescuing p53 function. It should be noted that besides loss-of-function mutations, there are also oncogenic gain-of-function mutations known for p53.39–41 Thus, new binding modes could provide avenues for therapeutic intervention for both aspects of altered p53 function. Of course, tractability and druggability need to be shown for such a new binding site.42
The compound 1151 could be further characterized and used as a spy molecule for FAXS NMR.43,44 This could further facilitate screening experiments for the identification of novel fragments binding to the Y220C-induced cleft.
4. Materials and methods
4.1. Molecular biology
In general, expression and purification was performed as previously described.16 The plasmid was cloned into BL21pLysS cells and the protein was expressed over night at 24 °C. The lysed sample in lysis buffer (KPi 50 mM, NaCl 300 mM, imidazole 10 mM, TCEP 2 mM, pH = 8) was loaded onto a NiNTA column (Cytiva) and eluted using a gradient from 0–100% elution buffer (KPi 50 mM, NaCl 300 mM, imidazole 250 mM, TCEP 2 mM, pH = 8). Then, the tag was cleaved over night using the tobacco etch virus protease. The sample was diluted 8-fold with heparin buffer A (KPi 25 mM, NaCl 0 mM, DTT 5 mM, pH = 7.5) before it was loaded onto a HiTrap Heparin HP (GE Healthcare) column. The sample was eluted with 40% heparin buffer B (KPi 25 mM, NaCl 2 M, DTT 5 mM, pH = 7.5). A final size exclusion chromatography step using a HiLoad 26/60 Superdex 75 pg (GE Healthcare) was performed (KPi 25 mM, NaCl 150 mM, DTT 5 mM, pH = 7.2). Fractions containing protein were finally pooled and flash frozen in liquid nitrogen.
For labelled expression, M9 minimal medium45 was used supplemented with 1 g L−1 of 15NH4Cl prior to inoculation.
For mutagenesis, a pET24a-HLT vector with the thermostable p53 core domain (94–312) served as template. The Q5 site-directed mutagenesis kit (New England BioLabs) was used to produce the triple cysteine mutant C124/182/277S.
All constructs used, are displayed in Table 3.
All sequences used are displayed. The biophysical screens are DSF, STD, ESI-MS and 1H,15N-HSQC. For crystallization a construct lacking the linker GGS was used.
| Construct | Sequence (N′–C′) |
|---|---|
| T-p53C-Y220C (biophysical screens) | GGSSS SVPSQ KTYQG SYGFR LGFLH SGTAK |
| SVTCT YSPAL NKLFC QLAKT CPVQL WVDST | |
| PPPGT RVRAM AIYKQ SQHMT EVVRR CPHHE | |
| RCSDS DGLAP PQHLI RVEGN LRAEY LDDRN | |
| TFRHS VVVPC EPPEV GSDCT TIHYN YMCYS | |
| SCMGG MNRRP ILTII TLEDS SGNLL GRDSF | |
| EVRVC ACPGR DRRTE EENLR KKGEP HHELP | |
| PGSTK RALPN NT | |
| T-p53C-Y220C (crystallization) | SSSVP SQKTY QGSYG FRLGF LHSGT AKSVT |
| CTYSP ALNKL FCQLA KTCPV QLWVD STPPP | |
| GTRVR AMAIY KQSQH MTEVV RRCPH HERCS | |
| DSDGL APPQH LIRVE GNLRA EYLDD RNTFR | |
| HSVVV PCEPP EVGSD CTTIH YNYMC YSSCM | |
| GGMNR RPILT IITLE DSSGN LLGRD SFEVR | |
| VCACP GRDRR TEEEN LRKKG EPHHE LPPGS | |
| TKRAL PNNT | |
| T-p53C-Y220C (C124/182/277S) | GGSSS SVPSQ KTYQG SYGFR LGFLH SGTAK |
| SVTST YSPAL NKLFC QLAKT CPVQL WVDST | |
| PPPGT RVRAM AIYKQ SQHMT EVVRR CPHHE | |
| RSSDS DGLAP PQHLI RVEGN LRAEY LDDRN | |
| TFRHS VVVPC EPPEV GSDCT TIHYN YMCYS | |
| SCMGG MNRRP ILTII TLEDS SGNLL GRDSF | |
| EVRVC ASPGR DRRTE EENLR KKGEP HHELP | |
| PGSTK RALPN NT |
4.2. Differential scanning fluorimetry (DSF)
The melting temperature of T-p53C-Y220C in the presence or absence of fragments was determined by differential scanning fluorimetry (DSF). DSF measurements were performed on a Qiagen Rotor-Q Model-5-Plex HRM real-time PCR instrument using SYPRO Orange as fluorescent dye (final concentration 5×). 8 μM protein in phosphate buffer (25 mM KPi, 150 mM NaCl, 1 mM TCEP, pH 7.2, 5% DMSO [v/v]), and a final compound concentration of 1 mM were used.17 The temperature was ramped from 28 °C to 60 °C with a heating rate of 270 °C h−1.14 Excitation and emission filters were set to 490 and 580 nm. For time-dependent DSF measurements, the samples were incubated at 20 °C on a rotating shaker. The melting temperature of T-p53C-Y220C with or without compounds was determined from the maximum of the first derivative of the melting curve using OriginPro2020. All measurements were performed in triplicates. ΔTm was calculated by subtracting the resulting Tm of T-p53C-Y220C from the Tm of the compound samples. A temperature increase of at least 0.5 °C was defined as a parameter for a fragment hit.33
4.3. Saturation transfer difference (STD) NMR
The STD experiments were performed as previously described, using the same mixtures.30 The spectra were recorded on a Bruker Avance III HDX 700 with a 5 mm Prodigy TCI cryo probehead. Compounds were considered as a hit, if the signal was sufficiently larger than the local background noise.
4.4. 1H,15N-Heteronuclear single quantum coherence NMR
Spectra were recorded on an 800 MHz Bruker Avance-III at 293 K using a final protein concentration of 65 μM (5% DMSO-d6 [v/v]) and a final ligand concentration of 2 mM.
In total, 1024 data points were collected in the direct dimension (1H) and 128 in the indirect dimension (15N). Data processing was performed using Bruker Topspin 4.1 and analysis using NMRFAM-SPARKY 3.19.46 Peak shifts were considered significant, if
 |
1 |
was larger than 0.04 ppm.14,47 All NMR figures were prepared using the nmrglue Python package.48
4.5. Glutathione assay
GSH stability studies were performed according to a protocol established for heterocyclic electrophilic fragments by Keeley et al.49
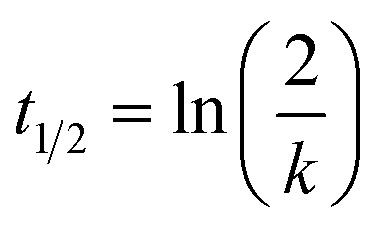
Reaction conditions were PBS buffer pH 7.4, 10% acetonitrile, 100 μM ketoprofen as an internal standard, 250 μM fragment, and 5 mM GSH excess at 37 °C. Measurement times were after 0, 1, 2, 4, 8, 12, and 24 h. For very reactive fragments (t1/2 < 5 h) analysis was performed every 20 min. The mixture was analyzed by HPLC with UV-detection. The reaction of the compounds was detected by measuring the decreasing area under the curve (AUC) of the fragment relative to the internal standard. The declining AUC was fitted to pseudo-first order kinetics and t1/2 was calculated using the following equation:
 |
2 |
Measurements were performed as duplicates with GSH. In addition, single measurements without GSH in PBS buffer were carried out for each fragment to check for hydrolytic degradation.
4.6. Mass spectrometry
T-p53C-Y220C or T-p53C-C124/182/277S (50 μM) in phosphate buffer (25 mM KPi, 150 mM NaCl, 1 mM DTT, pH 7.2) were incubated with 125 mM compound dissolved in DMSO, yielding a final concentration of 5% [v/v] DMSO and 6.25 mM protein with a protein to compound ratio of 1 : 125. The mixture was incubated for 4 h at 20 °C while shaking.17
The UHPLC-system consisted of an Agilent (Waldbronn, Germany) 1290 Infinity binary pump (G4220A) and a thermostated column compartment (G1316C). Between the column and the ion source a Valco EHMA diverter valve (2-pos/6-port) from VICI (Schenkon, Switzerland) was installed for online de-salting of the samples. Mobile phase A was water + 0.1% (v/v) formic acid and mobile phase B was ACN + 0.1% (v/v) formic acid. The flow rate was set to 0.5 mL min−1 with the following gradient: 0–2 min: 5% B (de-salting of sample, flow to waste), 2–10 min: 5–80% B, 10–12 min: 80% B, 12–17 min: 5% B. The column temperature was set to 50 °C. A TripleTOF 5600+ mass spectrometer from Sciex (Darmstadt, Germany) was used with a Duospray ion source (ESI interface) in positive ionization mode. The following MS instrument parameters were used: curtain gas (CUR): 35 psi, nebulizing gas (GS1): 50 psi, heater gas (GS2): 40 psi, ion spray voltage floating: 5100 V, source temperature: 550 °C, collision energy (CE): 30 V, declustering potential (DP): 220 V. The mass range in TOF MS mode was set from 500 to 5000 m/z with an accumulation time of 500 ms. The IntactProteinMode script from Sciex was used to optimize advanced MS settings for protein analysis. Data acquisition was performed with Analyst TF 1.8.1 software (Sciex). Data analysis was performed using PeakView software 2.2.0 (Sciex) using the BioToolKit (2.2.0.) for deconvolution of the mass spectra.
4.7. Crystallization and data collection
The protein was concentrated to 5 mg mL−1 and mixed 1 : 1 with reservoir solution (100 mM HEPES (pH = 7.15), 19% PEG4000 and 10 mM DTT) using the sitting drop vapor diffusion technique and by performing streak seeding. Crystals grew within a few days. For soaking, crystals were transferred in a 50 mM or saturated compound solution in a cryo-protectant buffer (reservoir solution and an additional 20% glycerol) over night.
Data sets were obtained at the Swiss Light Source (SLS) (Villigen, Switzerland) at the X06DA (PXIII) beamline, using a Pilatus-2 M-F detector.
Data processing and reduction was performed using XDS.50 To obtain initial phases by molecular replacement, 4AGL was used as a search model for PHASER included in the CCP4 suite.14,51,52 Structure and phase improvement was performed using multiple cycles of manual model building in Coot and structure refinement using PHENIX.53,54 The anomalous difference map was generated using CAD and fft, both from the CCP4 suite.55–57 Ligand restraints were generated using AceDRG.58,59
4.8. V max and adduct formation energy calculations
4.8.1. MP2 structure optimizations and single point calculations
Geometry optimizations and single point calculations were carried out using TURBOMOLE 7.4.1.60 A triple-ζ basis set (def2-TZVPP) was used throughout the study.61 MP2 calculations were done in combination with the resolution of identity (RI) technique and the frozen core approximation.61–64 The frozen core orbitals were attributed by the default setting in TURBOMOLE by which all orbitals possessing energies below 3.0 au are considered as core orbitals. The SCF convergence criterion was increased to 10−8 Hartree for all calculations. Heavy atoms of the model systems were kept frozen during optimization.
4.8.2. Adduct formation calculations
The ligand and the halogen bond accepting moiety (represented as N-methylacetamide) were optimized using MP2/TZVPP. Heavy atoms were kept frozen during optimization. For the calculations of the putative adduct formations, the modified ligands were freely optimized using MP2/TZVPP-level of theory. The ligands were subsequently matched onto the geometry of the crystal structure using three atoms of the ligand. The complex formation energies were calculated through single points as the difference between the complex and the sum of the two separate molecules.
4.8.3. 2D electrostatic potential (ESP) plots and Vmax calculations
All ligands were oriented after their geometry optimization employing an in-house script by placing the halogen atom into the negative X-axis and the respective ring system into the XZ-plane. Electrostatic potentials were calculated using TURBOMOLE 7.4.1 on a regular 2D grid. Visualization was done using a custom Python script. The Vmax values were extracted at 0.02 au electron isodensity.
Author contributions
Conceptualization was performed by FMB. JS and MC carried out and analyzed 1H,15N-HSQC experiments. MD and MK performed the STD experiments, JS and MD analyzed them. TK performed and analyzed the DSF studies. MS performed the GSH assays. SJ and ML performed and analyzed the ESI-MS experiments. Mutagenesis was done by LE. Crystallographic data reduction and refinement was performed by JS, MB and TS. FMB, JS, TK and MS wrote the final manuscript.
Conflicts of interest
There are no conflicts to declare.
Supplementary Material
Acknowledgments
We thank Georg Zocher for his help and advice in crystallography. We also thank Andreas Joerger for his expertise in crystallizing T-p53C-Y220C. We gratefully acknowledge the Swiss Light Source (SLS, Switzerland) for beam time.
Notes and references
- Lane D. P. Nature. 1992;358:15–16. doi: 10.1038/358015a0. [DOI] [PubMed] [Google Scholar]
- Vogelstein B. Lane D. Levine A. J. Nature. 2000;408:307–310. doi: 10.1038/35042675. [DOI] [PubMed] [Google Scholar]
- Joerger A. C. Fersht A. R. Annu. Rev. Biochem. 2008;77:557–582. doi: 10.1146/annurev.biochem.77.060806.091238. [DOI] [PubMed] [Google Scholar]
- Joerger A. C. Fersht A. R. Cold Spring Harbor Perspect. Biol. 2010;2:a000919. doi: 10.1101/cshperspect.a000919. [DOI] [PMC free article] [PubMed] [Google Scholar]
- Brown C. J. Lain S. Verma C. S. Fersht A. R. Lane D. P. Nat. Rev. Cancer. 2009;9:862–873. doi: 10.1038/nrc2763. [DOI] [PubMed] [Google Scholar]
- Wiman K. G. Oncogene. 2010;29:4245–4252. doi: 10.1038/onc.2010.188. [DOI] [PubMed] [Google Scholar]
- Popowicz G. M. Dömling A. Holak T. A. Angew. Chem., Int. Ed. 2011;50:2680–2688. doi: 10.1002/anie.201003863. [DOI] [PMC free article] [PubMed] [Google Scholar]
- Petitjean A. Mathe E. Kato S. Ishioka C. Tavtigian S. V. Hainaut P. Olivier M. Hum. Mutat. 2007;28:622–629. doi: 10.1002/humu.20495. [DOI] [PubMed] [Google Scholar]
- Nikolova P. V. Henckel J. Lane D. P. Fersht A. R. Proc. Natl. Acad. Sci. U. S. A. 1998;95:14675–14680. doi: 10.1073/pnas.95.25.14675. [DOI] [PMC free article] [PubMed] [Google Scholar]
- Bouaoun L. Sonkin D. Ardin M. Hollstein M. Byrnes G. Zavadil J. Olivier M. Hum. Mutat. 2016;37:865–876. doi: 10.1002/humu.23035. [DOI] [PubMed] [Google Scholar]
- Bauer M. R. Krämer A. Settanni G. Jones R. N. Ni X. Khan Tareque R. Fersht A. R. Spencer J. Joerger A. C. ACS Chem. Biol. 2020;15:657–668. doi: 10.1021/acschembio.9b00748. [DOI] [PMC free article] [PubMed] [Google Scholar]
- Boeckler F. M. Joerger A. C. Jaggi G. Rutherford T. J. Veprintsev D. B. Fersht A. R. Proc. Natl. Acad. Sci. U. S. A. 2008;105:10360–10365. doi: 10.1073/pnas.0805326105. [DOI] [PMC free article] [PubMed] [Google Scholar]
- Bauer M. R. Jones R. N. Baud M. G. J. Wilcken R. Boeckler F. M. Fersht A. R. Joerger A. C. Spencer J. ACS Chem. Biol. 2016;11:2265–2274. doi: 10.1021/acschembio.6b00315. [DOI] [PMC free article] [PubMed] [Google Scholar]
- Wilcken R. Liu X. Zimmermann M. O. Rutherford T. J. Fersht A. R. Joerger A. C. Boeckler F. M. J. Am. Chem. Soc. 2012;134:6810–6818. doi: 10.1021/ja301056a. [DOI] [PMC free article] [PubMed] [Google Scholar]
- Liu X. Wilcken R. Joerger A. C. Chuckowree I. S. Amin J. Spencer J. Fersht A. R. Nucleic Acids Res. 2013;41:6034–6044. doi: 10.1093/nar/gkt305. [DOI] [PMC free article] [PubMed] [Google Scholar]
- Baud M. G. Bauer M. R. Verduci L. Dingler F. A. Patel K. J. Horil Roy D. Joerger A. C. Fersht A. R. Eur. J. Med. Chem. 2018;152:101–114. doi: 10.1016/j.ejmech.2018.04.035. [DOI] [PMC free article] [PubMed] [Google Scholar]
- Bauer M. R. Joerger A. C. Fersht A. R. Proc. Natl. Acad. Sci. U. S. A. 2016;113:E5271–E5280. doi: 10.1073/pnas.1610421113. [DOI] [PMC free article] [PubMed] [Google Scholar]
- Joerger A. C. Allen M. D. Fersht A. R. J. Biol. Chem. 2004;279:1291–1296. doi: 10.1074/jbc.M309732200. [DOI] [PubMed] [Google Scholar]
- Heidrich J. Sperl L. E. Boeckler F. M. Front. Chem. 2019;7:9. doi: 10.3389/fchem.2019.00009. [DOI] [PMC free article] [PubMed] [Google Scholar]
- Zimmermann M. O. Lange A. Wilcken R. Cieslik M. B. Exner T. E. Joerger A. C. Koch P. Boeckler F. M. Future Med. Chem. 2014;6:617–639. doi: 10.4155/fmc.14.20. [DOI] [PubMed] [Google Scholar]
- Lange A. Günther M. Büttner F. M. Zimmermann M. O. Heidrich J. Hennig S. Zahn S. Schall C. Sievers-Engler A. Ansideri F. Koch P. Laemmerhofer M. Stehle T. Laufer S. A. Boeckler F. M. J. Am. Chem. Soc. 2015;137:14640–14652. doi: 10.1021/jacs.5b07090. [DOI] [PubMed] [Google Scholar]
- Wilcken R. Zimmermann M. O. Bauer M. R. Rutherford T. J. Fersht A. R. Joerger A. C. Boeckler F. M. ACS Chem. Biol. 2015;10:2725–2732. doi: 10.1021/acschembio.5b00515. [DOI] [PMC free article] [PubMed] [Google Scholar]
- Wilcken R. Zimmermann M. O. Lange A. Joerger A. C. Boeckler F. M. J. Med. Chem. 2013;56:1363–1388. doi: 10.1021/jm3012068. [DOI] [PubMed] [Google Scholar]
- Wilcken R. Zimmermann M. O. Lange A. Zahn S. Boeckler F. M. J. Comput.-Aided Mol. Des. 2012;26:935–945. doi: 10.1007/s10822-012-9592-8. [DOI] [PubMed] [Google Scholar]
- Zimmermann M. O. Lange A. Boeckler F. M. J. Chem. Inf. Model. 2015;55:687–699. doi: 10.1021/ci5007118. [DOI] [PubMed] [Google Scholar]
- Zimmermann M. O. Boeckler F. M. Med. Chem. Commun. 2016;7:500–505. doi: 10.1039/C5MD00499C. [DOI] [Google Scholar]
- Wilcken R. Zimmermann M. O. Lange A. Zahn S. Kirchner B. Boeckler F. M. J. Chem. Theory Comput. 2011;7:2307–2315. doi: 10.1021/ct200245e. [DOI] [PubMed] [Google Scholar]
- Lange A. Zimmermann M. O. Wilcken R. Zahn S. Boeckler F. M. J. Chem. Inf. Model. 2013;53:3178–3189. doi: 10.1021/ci4004305. [DOI] [PubMed] [Google Scholar]
- Zimmermann M. O. Lange A. Zahn S. Exner T. E. Boeckler F. M. J. Chem. Inf. Model. 2016;56:1373–1383. doi: 10.1021/acs.jcim.6b00075. [DOI] [PubMed] [Google Scholar]
- Dammann M. Kramer M. Zimmermann M. O. Boeckler F. M. Front. Chem. 2022;9:815567. doi: 10.3389/fchem.2021.815567. [DOI] [PMC free article] [PubMed] [Google Scholar]
- Della Volpe S. Linciano P. Listro R. Tumminelli E. Amadio M. Bonomo I. Elgaher W. Adam S. Hirsch A. Boeckler F. Vasile F. Rossi D. Collina S. Bioorg. Chem. 2021;116:105305. doi: 10.1016/j.bioorg.2021.105305. [DOI] [PubMed] [Google Scholar]
- Dammann M. Stahlecker J. Zimmermann M. O. Klett T. Rotzinger K. Kramer M. Coles M. Stehle T. Boeckler F. M. J. Med. Chem. doi: 10.1021/acs.jmedchem.2c00951. [DOI] [PubMed] [Google Scholar]; in press
- Kaar J. L. Basse N. Joerger A. C. Stephens E. Rutherford T. J. Fersht A. R. Protein Sci. 2010;19:2267–2278. doi: 10.1002/pro.507. [DOI] [PMC free article] [PubMed] [Google Scholar]
- Lange A. Heidrich J. Zimmermann M. O. Exner T. E. Boeckler F. M. J. Chem. Inf. Model. 2019;59:885–894. doi: 10.1021/acs.jcim.8b00621. [DOI] [PubMed] [Google Scholar]
- de Andrade K. C. Lee E. E. Tookmanian E. M. Kesserwan C. A. Manfredi J. J. Hatton J. N. Loukissas J. K. Zavadil J. Zhou L. Olivier M. Frone M. N. Shahzada O. Longabaugh W. J. R. Kratz C. P. Malkin D. Hainaut P. Savage S. A. Cell Death Differ. 2022;29:1071–1073. doi: 10.1038/s41418-022-00976-3. [DOI] [PMC free article] [PubMed] [Google Scholar]
- Sung H. Ferlay J. Siegel R. L. Laversanne M. Soerjomataram I. Jemal A. Bray F. Ca-Cancer J. Clin. 2021;71:209–249. doi: 10.3322/caac.21660. [DOI] [PubMed] [Google Scholar]
- Ferlay J. Colombet M. Soerjomataram I. Parkin D. M. Piñeros M. Znaor A. Bray F. Int. J. Cancer. 2021;149:778–789. doi: 10.1002/ijc.33588. [DOI] [PubMed] [Google Scholar]
- Kandoth C. McLellan M. D. Vandin F. Ye K. Niu B. Lu C. Xie M. Zhang Q. McMichael J. F. Wyczalkowski M. A. Leiserson M. D. M. Miller C. A. Welch J. S. Walter M. J. Wendl M. C. Ley T. J. Wilson R. K. Raphael B. J. Ding L. Nature. 2013;502:333–339. doi: 10.1038/nature12634. [DOI] [PMC free article] [PubMed] [Google Scholar]
- Blandino G. Levine A. J. Oren M. Oncogene. 1999;18:477–485. doi: 10.1038/sj.onc.1202314. [DOI] [PubMed] [Google Scholar]
- Oren M. Rotter V. Cold Spring Harbor Perspect. Biol. 2010;2:a001107. doi: 10.1101/cshperspect.a001107. [DOI] [PMC free article] [PubMed] [Google Scholar]
- Alvarado-Ortiz E. de la Cruz-López K. G. Becerril-Rico J. Sarabia-Sánchez M. A. Ortiz-Sánchez E. García-Carrancá A. Front. Cell Dev. Biol. 2021;8:607670. doi: 10.3389/fcell.2020.607670. [DOI] [PMC free article] [PubMed] [Google Scholar]
- Brown K. K. Hann M. M. Lakdawala A. S. Santos R. Thomas P. J. Todd K. Med. Chem. Commun. 2018;9:606–613. doi: 10.1039/C7MD00633K. [DOI] [PMC free article] [PubMed] [Google Scholar]
- Dalvit C. Fagerness P. E. Hadden D. T. A. Sarver R. W. Stockman B. J. J. Am. Chem. Soc. 2003;125:7696–7703. doi: 10.1021/ja034646d. [DOI] [PubMed] [Google Scholar]
- Dalvit C. Vulpetti A. J. Med. Chem. 2019;62:2218–2244. doi: 10.1021/acs.jmedchem.8b01210. [DOI] [PubMed] [Google Scholar]
- Geerlof A., M9 mineral medium, https://www.helmholtz-muenchen.de/fileadmin/PEPF/Protocols/M9-medium_150510.pdf
- Lee W. Tonelli M. Markley J. L. Bioinformatics. 2015;31:1325–1327. doi: 10.1093/bioinformatics/btu830. [DOI] [PMC free article] [PubMed] [Google Scholar]
- Williamson M. P. Prog. Nucl. Magn. Reson. Spectrosc. 2013;73:1–16. doi: 10.1016/j.pnmrs.2013.02.001. [DOI] [PubMed] [Google Scholar]
- Helmus J. J. Jaroniec C. P. J. Biomol. NMR. 2013;55:355–367. doi: 10.1007/s10858-013-9718-x. [DOI] [PMC free article] [PubMed] [Google Scholar]
- Keeley A. Ábrányi Balogh P. Keserű G. M. Med. Chem. Commun. 2019;10:263–267. doi: 10.1039/C8MD00327K. [DOI] [PMC free article] [PubMed] [Google Scholar]
- Kabsch W. Acta Crystallogr., Sect. D: Biol. Crystallogr. 2010;66:125–132. doi: 10.1107/S0907444909047337. [DOI] [PMC free article] [PubMed] [Google Scholar]
- McCoy A. J. Grosse-Kunstleve R. W. Adams P. D. Winn M. D. Storoni L. C. Read R. J. J. Appl. Crystallogr. 2007;40:658–674. doi: 10.1107/S0021889807021206. [DOI] [PMC free article] [PubMed] [Google Scholar]
- Winn M. D. Ballard C. C. Cowtan K. D. Dodson E. J. Emsley P. Evans P. R. Keegan R. M. Krissinel E. B. Leslie A. G. W. McCoy A. McNicholas S. J. Murshudov G. N. Pannu N. S. Potterton E. A. Powell H. R. Read R. J. Vagin A. Wilson K. S. Acta Crystallogr., Sect. D: Biol. Crystallogr. 2011;67:235–242. doi: 10.1107/S0907444910045749. [DOI] [PMC free article] [PubMed] [Google Scholar]
- Emsley P. Lohkamp B. Scott W. G. Cowtan K. Acta Crystallogr., Sect. D: Biol. Crystallogr. 2010;66:486–501. doi: 10.1107/S0907444910007493. [DOI] [PMC free article] [PubMed] [Google Scholar]
- Liebschner D. Afonine P. V. Baker M. L. Bunkóczi G. Chen V. B. Croll T. I. Hintze B. Hung L.-W. Jain S. McCoy A. J. Moriarty N. W. Oeffner R. D. Poon B. K. Prisant M. G. Read R. J. Richardson J. S. Richardson D. C. Sammito M. D. Sobolev O. V. Stockwell D. H. Terwilliger T. C. Urzhumtsev A. G. Videau L. L. Williams C. J. Adams P. D. Acta Crystallogr., Sect. D: Biol. Crystallogr. 2019;75:861–877. doi: 10.1107/S2059798319011471. [DOI] [PMC free article] [PubMed] [Google Scholar]
- Immirzi A., Crystallographic Computing Techniques, ed. F. R. Ahmed, Munksgaard, 1966, p. 399 [Google Scholar]
- Ten Eyck L. F. Acta Crystallogr., Sect. A: Cryst. Phys., Diffr., Theor. Gen. Crystallogr. 1973;29:183–191. doi: 10.1107/S0567739473000458. [DOI] [Google Scholar]
- Read R. J. Schierbeek A. J. J. Appl. Crystallogr. 1988;21:490–495. doi: 10.1107/S002188988800562X. [DOI] [Google Scholar]
- Long F. Nicholls R. A. Emsley P. Gražulis S. Merkys A. Vaitkus A. Murshudov G. N. Acta Crystallogr., Sect. D: Biol. Crystallogr. 2017;73:112–122. doi: 10.1107/S2059798317000067. [DOI] [PMC free article] [PubMed] [Google Scholar]
- Long F. Nicholls R. A. Emsley P. Gražulis S. Merkys A. Vaitkus A. Murshudov G. N. Acta Crystallogr., Sect. D: Biol. Crystallogr. 2017;73:103–111. doi: 10.1107/S2059798317000079. [DOI] [PMC free article] [PubMed] [Google Scholar]
- TURBOMOLE V7.2 2017, a development of University of Karlsruhe and Forschungszentrum Karlsruhe GmbH, 1989–2007, TURBOMOLE GmbH, since 2007, available from https://www.turbomole.com
- Weigend F. Ahlrichs R. Phys. Chem. Chem. Phys. 2005;7:3297. doi: 10.1039/B508541A. [DOI] [PubMed] [Google Scholar]
- Hättig C. Phys. Chem. Chem. Phys. 2005;7:59–66. doi: 10.1039/B415208E. [DOI] [Google Scholar]
- Feyereisen M. Fitzgerald G. Komornicki A. Chem. Phys. Lett. 1993;208:359–363. doi: 10.1016/0009-2614(93)87156-W. [DOI] [Google Scholar]
- Weigend F. Häser M. Patzelt H. Ahlrichs R. Chem. Phys. Lett. 1998;294:143–152. doi: 10.1016/S0009-2614(98)00862-8. [DOI] [Google Scholar]


