Abstract
Background and Objectives
Neurodegeneration and astrocytic activation are pathologic hallmarks of progressive multiple sclerosis (MS) and can be quantified by serum neurofilament light chain (sNfL) and glial fibrillary acidic protein (sGFAP). We investigated sNfL and sGFAP as tools for stratifying patients with progressive MS based on progression and disease activity status.
Methods
We leveraged our Comprehensive Longitudinal Investigation of MS at the Brigham and Women's Hospital (CLIMB) natural history study, which includes clinical, MRI data and serum samples collected over more than 20 years. We included patients with MS with a confirmed Expanded Disability Status Scale (EDSS) score ≥3 that corresponds with our classifier for patients at high risk of underlying progressive pathology. We analyzed sNfL and sGFAP within 6 months from the confirmed EDSS score ≥3 corresponding with our baseline visit. Patients who further developed 6-month confirmed disability progression (6mCDP) were classified as progressors. We further stratified our patients into active/nonactive based on new brain/spinal cord lesions or relapses in the 2 years before baseline or during follow-up. Statistical analysis on log-transformed sGFAP/sNfL assessed the baseline association with demographic, clinical, and MRI features and associations with future disability.
Results
We included 257 patients with MS who had an average EDSS score of 4.0 and a median follow-up after baseline of 7.6 years. sNfL was higher in patients with disease activity in the 2 years before baseline (adjusted β = 1.21; 95% CI 1.04–1.42; p = 0.016), during the first 2 years of follow-up (adjusted β = 1.17; 95% CI = 1.01–1.36; p = 0.042). sGFAP was not increased in the presence of disease activity. Higher sGFAP levels, but not sNfL levels, were associated with higher risk of 6mCDP (adjusted hazard ratio [HR] = 1.71; 95% CI = 1.19–2.45; p = 0.004). The association was stronger in patients with low sNfL (adjusted HR = 2.44; 95% CI 1.32–4.52; p = 0.005) and patients who were nonactive in the 2 years prior or after the sample.
Discussion
Higher levels of sGFAP correlated with subsequent progression, particularly in nonactive patients, whereas sNfL reflected acute disease activity in patients with MS at high risk of underlying progressive pathology. Thus, sGFAP and sNfL levels may be used to stratify patients with progressive MS for clinical research studies and clinical trials and may inform clinical care.
Multiple sclerosis (MS) is a chronic inflammatory and neurodegenerative disease of the CNS.1-3 The majority of patients manifest the disease with a clinically relapsing-remitting course and later transition to a secondary progressive phase of relentless disability accrual.4 About 20% of patients with MS experience their first symptoms at the progressive stage and are diagnosed as primary progressive MS.5 Secondary progressive MS and primary progressive MS are referred together as progressive MS. The transition to a clinical progressive MS phenotype reflects a shift from a disease sustained by the peripheral immune system to a self-sustaining pathology localized to the CNS.6,7 Disability progression occurring independently from a relapse is a hallmark of progressive MS, but does occur also in patients with relapsing-remitting MS.8 The 2 phases of MS are in a continuum where biology and clinical phenotype slowly transition from one phase to another. Defining a patient as progressive MS rather than relapsing-remitting MS is therefore challenging and may only be correctly classified years after the biological transition has taken place.9,10
The accurate enrollment of patients with progressive MS in clinical trials is in fact critical to succeed in identifying effective therapies for progressive MS. Treatments that affect the peripheral immune system reduce disease activity in patients with relapsing-remitting MS or patients with active secondary progressive MS but have so far been disappointing in treating nonactive progressive MS.11,12 In contrast, patients with active progressive MS may respond to highly effective therapies, making the accurate identification of this patient group crucial.13 Designations of active and nonactive progressive MS are now being routinely used in clinical trials; however, there are no easily accessible biomarkers that can enable high-frequency monitoring of disease activity.
The study of the biology of progression and the evaluation of new treatments require the identification of biologically progressive patients. Neurodegeneration and astrocytic activation are pathologic hallmarks of progressive MS.14-16 Blood biomarkers emerged as an easily accessible tool that allows for repeated quantification of biological processes from a blood sample.17 Neurofilament light chain (NfL) and glial fibrillary acidic protein (GFAP) are cytoskeletal proteins of, respectively, neurons and astrocytes. NfL emerged as a biomarker specific for neuronal damage18,19 whose levels increase with relapses or new MRI lesions20 and decrease with effective treatment.21,22 In studies with a majority of patients with relapsing-remitting MS, NfL levels were also prognostic for disability20,23-26 and CNS atrophy.23,27,28 On the other hand, GFAP is postulated to be a biomarker of astrocytic damage29,30 and reactive astrogliosis.31,32 GFAP has been less investigated than NfL, and evidence collected in blood and CSF has demonstrated contrasting findings regarding its association with acute disease activity.17,33-36 The joint use of these biomarkers for stratifying patients with progressive MS has not been explored.
We therefore sought to evaluate serum NfL (sNfL) and serum GFAP (sGFAP) as predictors of progression within patients with MS at high risk of having an underlying progressive pathology, who were also stratified into those with active and nonactive disease. In our MS cohort, we investigated (1) the ability of sNfL and sGFAP to discriminate active from nonactive patients and (2) the prognostic value of sGFAP and sNfL to identify subsequent disease progression.
Methods
Study Population
The patients included in this study were part of the Comprehensive Longitudinal Investigation of MS at the Brigham and Women's Hospital (climbstudy.org), a natural history study that encompasses biannual clinical assessment, annual MRI, and blood samples.37 The biannual clinical assessment includes measurement of the Expanded Disability Status Scale (EDSS) score. A relapse was recorded by the treating neurologist at onset of new or recurrent MS symptoms lasting for ≥24 hours. We included patients who (1) met the diagnostic criteria of MS by the 2010 McDonald criteria, (2) EDSS score ≥3 over 2 consecutive visits at least 3 months apart, and (3) available serum sample at or after sustained EDSS score ≥3. The EDSS scores of all patients were validated by a Neurostatus-EDSS certified physician (C.B.) by review of all visit notes and Functional Systems and EDSS scores before biomarker analysis, and if discrepancies were identified, the treating neurologist or an attending neurologist (T.C.) verified the data.
Standard Protocol Approvals, Registrations, and Patient Consents
Institutional Review Board approval was granted by the Partners Human Research Committee, and participants provided written informed consent for participation.
Clinical Definitions
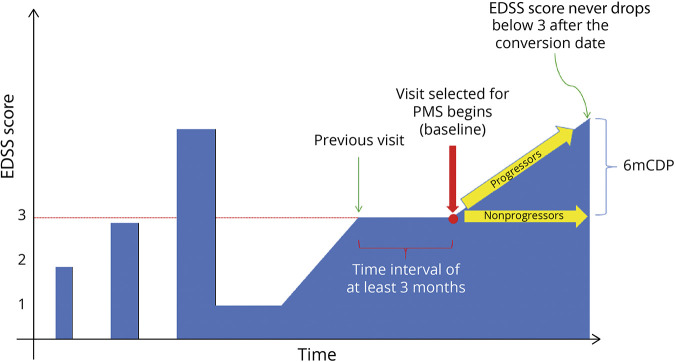
Disease progression in MS is unremitting starting at EDSS score 3 or 4,12,38 which is generally thought to correlate with the clinical start of secondary progressive MS. We therefore sought to evaluate sNfL and sGFAP as predictors of progression within MS patients at high risk of having an underlying progressive pathology, who were also stratified into those with active and nonactive MS. Confirmed EDSS score ≥3 was our classifier for high risk of progressive MS pathology. The first visit at or after a confirmed EDSS score ≥3 with available serum sample within 6 months was retained as the baseline visit and as the baseline serum sample, respectively (Figure 1). Several definitions regarding active or nonactive progressive MS have been proposed, and we classified patients using 4 definitions.39 These definitions considered the presence of clinical and/or brain and spinal cord MRI disease activity: (1) patients with a relapse or gadolinium-enhancing lesion or new/enlarging T2 lesion in the 2 years after baseline, (2) patients with relapses in the 2 years before baseline, (3) patients with a relapse or gadolinium-enhancing lesion or new/enlarging T2 lesion in the 2 years before baseline, and (4) patients with a relapse or gadolinium-enhancing lesion or new/enlarging T2 lesion in the 2 years prior or after the baseline visit.
Figure 1. Schematic Diagram of the Study Inclusion Criteria.
Patients were classified as progressive MS based on the presence of a confirmed EDSS score ≥3 at least 3 months apart and included in the study. The first visit at or after a confirmed EDSS score ≥3 with available serum sample within 6 months was retained as the baseline visit and as the baseline serum sample, respectively. Patients who experienced a 6mCDP after baseline were classified as progressors. 6mCDP = 6-month confirmed disability progression; EDSS = Expanded Disability Status Scale; MS = multiple sclerosis; PMS = progressive MS.
In addition to measures of disease activity, EDSS progression was defined as an increase in the EDSS score since the previous visit of ≥1.0 point from an EDSS score of 1.0–5.0 or ≥0.5 point from an EDSS score of ≥5.5. For our analysis, 6-months confirmed disability progression (6mCDP) was defined as EDSS progression that was sustained for at least 180 days.
Treatment status was defined in 3 categories, namely, untreated, low-efficacy (LET, Copaxone, Avonex, Rebif, Betaseron, Tecfidera, Imuran + Betaseron, CellCept, Copaxone + CellCept, Aubagio, Avonex + methotrexate, Copaxone + methotrexate, Avonex + CellCept, methotrexate, and Plegridy), and high-efficacy (HET, Ocrevus, Gilenya, Rituxan, Cytoxan, Zenapax, Tysabri, Cytoxan + Copaxone, Avonex + Zenapax, Cytoxan + Rilutek, Rituxan + methotrexate, and Campath) treatments.
sNfL and sGFAP Measurements
Serum samples were collected in red-top serum vacutainer tubes (glass, silicone coated, no additives) and left at room temperature for 30–60 minutes to allow the clot to form. The tubes were then centrifuged at 4°C, 2,000 rpm, for 10 minutes, and the serum was collected under sterile conditions and frozen at −80°C until analysis. The levels of sNfL and sGFAP were quantified on a single molecule array platform at Quanterix (Billerica, MA). Samples were measured over 6 runs with reagents from the same lot. Samples from each group were evenly distributed across all plates, and samples from the same patient were measured in consecutive order. All samples were between the lowest and the upper limit of quantification. The average intra-assay coefficient of variation (CV) for duplicate measurements was 4.8% for sNfL and 3.0% for sGFAP. Two quality controls provided with the kit and 2 additional native serum samples were measured at the beginning and at the end of each run. The average CV between begin and end of run was 6.7% for sNfL and 4.5% for sGFAP. The average interassay CV between runs was 5.6% for sNfL and 3.8% for sGFAP.
MRI Data
The presence of new gadolinium-enhancing or T2 lesions vs a previous visit was documented by review of the official MRI report in the patient's chart as determined by a neuroradiologist. Scanning was performed as part of routine care using 1.5T or 3T units at the Brigham and Women's Hospital. Brain imaging included fluid-attenuated inversion recovery and T1- and T2-weighted sequences. Spinal cord imaging included sagittal T2-weighted and short tau inversion recovery images and axial T2-weighted images of the cervical and thoracic spine. Brain and spinal cord T1 sequences were repeated 5 minutes after administration of 0.1 mmol/kg IV gadolinium contrast.
Statistical Analyses
Continuous variables were described by median and interquartile range and categorical variables by percentages. The biomarker levels were log transformed for the analyses to reduce the skewness of the distribution.
Using the baseline sNfL and sGFAP measurements, the association between the log-transformed values was estimated using the Pearson correlation coefficient. In addition, the cross-sectional associations between a set of demographic, clinical, and MRI measures and both sNfL and sGFAP were estimated using linear regression with sNfL and sGFAP as the outcomes. The demographic measures were age, sex (female vs male), race (White vs non-White), and ethnicity (Hispanic vs not Hispanic). In terms of associations between biomarkers and clinical measures, a linear regression model was used, and the predictors were disease duration, EDSS score, treatment group (HET vs LET vs untreated), and presence of a relapse within the previous 90 days. For MRI measures, the predictor was new gadolinium-enhancing lesion within 30 days. Regression coefficients were back transformed by exponentiation and represented multiplicative effects of the predictor on the geometric mean of sNfL/sGFAP, i.e., females β = 1.14 means that females have on average a 14% higher sNfL/sGFAP than males; for continuous variable, the estimate is for each SD increase, i.e., age β = 1.04 means that per 1 SD of age sNfL/sGFAP increase on average 4%.
In addition to the univariate associations, a multivariable model including all these features was fit to estimate the independent association of each measure with each biomarker. Finally, we compared the groups based on the activity definitions provided above. Each of the associations with the activity definitions was also estimated, adjusting for age, sex, EDSS score, and treatment group.
In addition to baseline correlations, the prognostic value of sGFAP and sNfL for the time to 6mCDP was estimated using a Cox proportional hazards model. Each biomarker was treated as a continuous variable and by categorizing the variable using quintiles. The model was fit with biomarkers alone and adjusting for age, sex, EDSS score, treatment type, and presence of relapse within 90 days of the sample. To explore the added value of sGFAP in patients with low sNfL, the association with sGFAP was also estimated in the subgroup of patients with a sNfL level below the median, and the association with sNfL was estimated in the subgroup with sGFAP level below the median. In addition, we explored the prognostic value of sNfL and sGFAP for time to 6mCDP separately for active patients and nonactive patients as defined by each of the activity definitions.
All statistical analyses were completed in the statistical package R version 3.6.3 (r-project.org). p Values less than 0.05 were considered statistically significant for all analyses.
Data Availability
Anonymized data not published within this article will be made available by request from any qualified investigator.
Results
Patients
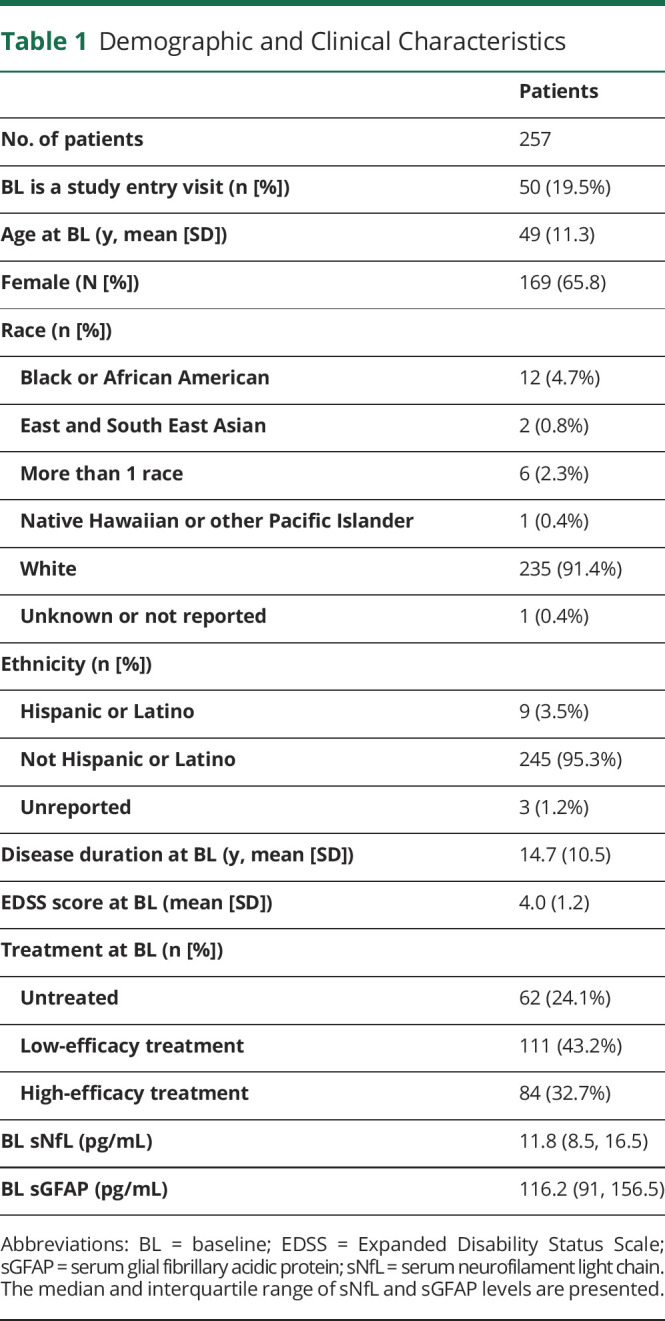
A total of 257 patients with MS who had a confirmed EDSS score ≥3 and available serum sample were included, Table 1. Thirty-two patients (12.5%) had a primary progressive onset of disease. The average (SD) age at baseline was 49 (11.3) years, and 65.8% were female. The average (SD) EDSS score at the baseline visit was 4.0 (1.2). The median follow-up after baseline was 7.6 years (interquartile range 3.8–10.2 years). After baseline, 143 patients experienced a disability progression that was confirmed by a follow-up visit at least 6 months later, meeting the definition of confirmed disability progression (CDP), and were therefore defined as progressors.
Table 1.
Demographic and Clinical Characteristics
Association of sNfL and sGFAP With Demographic and Clinical Variables
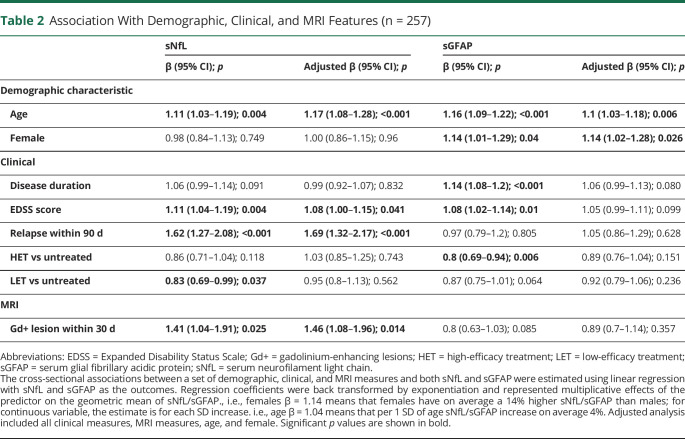
The log-transformed levels of sNfL and sGFAP showed a moderate correlation with each other (r = 0.42; 95% CI = 0.32–0.52; p < 0.001). The associations between baseline biomarker levels and demographic and clinical measures are provided in Table 2 sGFAP was higher in females than males, and sNfL did not differ between sexes, consistent with prior reports.20,40 Both biomarkers did not differ between races and ethnicities (data not shown). Age was a significant predictor of both sNfL and sGFAP. The levels of sGFAP and sNfL were positively correlated with EDSS scores, whereas only the levels of sNfL correlated with the presence of relapses and new gadolinium-enhancing lesions. Treatment (HET vs LET vs untreated) was not associated with lower sNfL levels, and HET was associated with lower sGFAP but only in the unadjusted analysis. In the multivariable model including all features, age, EDSS score, presence of a relapse, and presence of gadolinium-enhancing lesions remained significantly associated with sNfL. In contrast, only age and sex were significantly associated with sGFAP in the multivariable model (Table 2).
Table 2.
Association With Demographic, Clinical, and MRI Features (n = 257)
Clinical Definitions of Disease Activity and Biomarker Levels
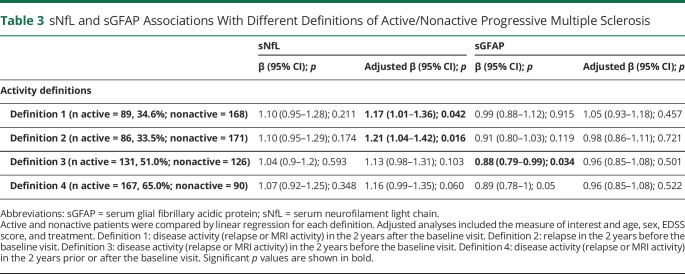
We classified the patients based on 4 definitions of activity status and compared the biomarker levels between active and nonactive by each definition (Table 3). In the adjusted analyses, patients defined as active by the presence of disease activity in the 2 years after baseline had an increased sNfL level (adjusted β = 1.17; 95% CI = 1.01, 1.36; p = 0.042). There was also a significant difference in sNfL when comparing those with and without relapses in the 2 years before baseline (adjusted β = 1.21; 95% CI = 1.04, 1.42; p = 0.016). No significant differences were observed in sNfL when accounting also for MRI activity in the 2 years before the baseline visit. Similarly, a composite definition that considered disease activity in the 2 years prior and after baseline resulted in a not significant difference in sNfL levels between active and nonactive patients. sGFAP was lower in patients who experienced clinical or MRI disease activity in the 2 years before baseline. However, this association was not significant in the adjusted analysis (Table 3).
Table 3.
sNfL and sGFAP Associations With Different Definitions of Active/Nonactive Progressive Multiple Sclerosis
Association of sNfL and sGFAP With 6mCDP
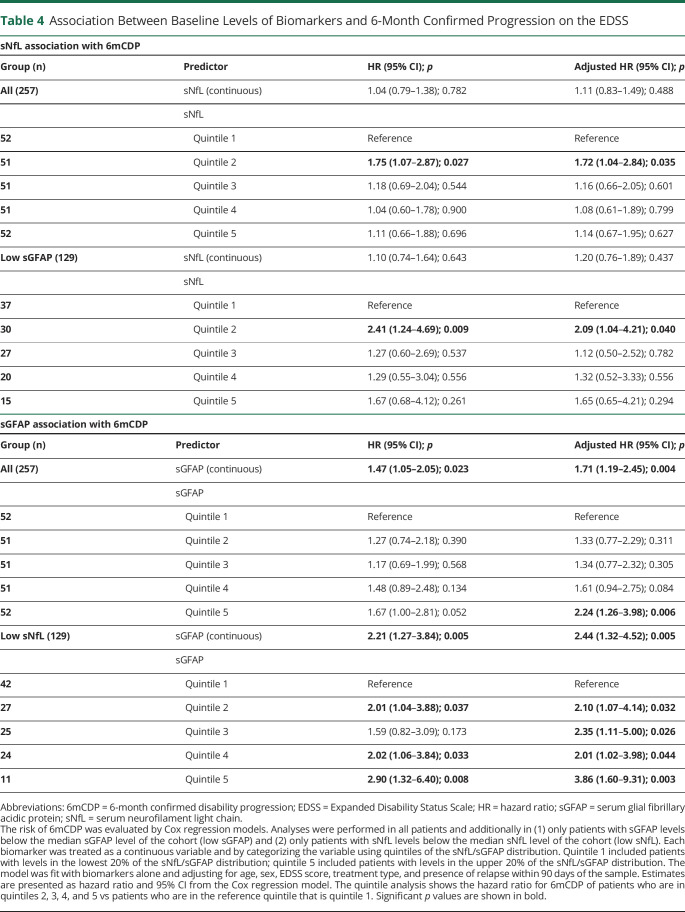
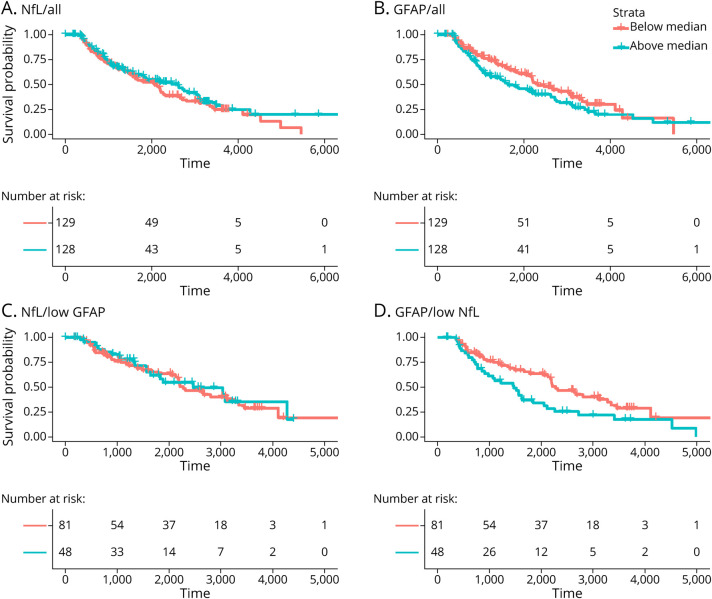
The association between baseline sNfL and sGFAP levels and subsequent 6mCDP is provided in Table 4, and the time to 6mCDP is shown in Figure 2. sNfL was not significantly associated with time to 6mCDP in all patients or in patients with low sGFAP in unadjusted or adjusted analyses. When sNfL was broken into quintiles, a difference between the second and first quintiles was observed, but there was no dose-response relationship across the quintiles. Conversely, sGFAP was significantly associated with time to 6mCDP in all patients in both unadjusted and adjusted analyses. The association became even stronger when only patients with low sNfL were analyzed. When the sGFAP was analyzed using quintiles, a dose-response relationship was observed, showing that increasing sGFAP increased the likelihood of 6mCDP (Table 4). We confirmed these findings also when excluding patients who did not have an available visit before EDSS score ≥3 (data not shown).
Table 4.
Association Between Baseline Levels of Biomarkers and 6-Month Confirmed Progression on the EDSS
Figure 2. Kaplan-Meier Estimates for Time to 6mCDP.
The risk of 6mCDP is compared in patients with (A) sNfL and (B) sGFAP above vs below the median. The risk of 6mCDP is then investigated in only patients with (C) sGFAP below the median or (D) sNfL below the median. For example, D considers only the 129 patients who have a level of sNfL below the median of the cohort; in this group, the risk for 6mCDP is compared between the 81 patients who have a sGFAP level above the median of the cohort and the 48 patients who have a sGFAP level below the median of the cohort. 6mCDP = 6-month confirmed disability progression; GFAP = glial fibrillary acidic protein; NfL = neurofilament light chain; sGFAP = serum GFAP; sNfL = serum NfL.
Association of sNfL and sGFAP With 6mCDP in Active and Nonactive Progressive MS
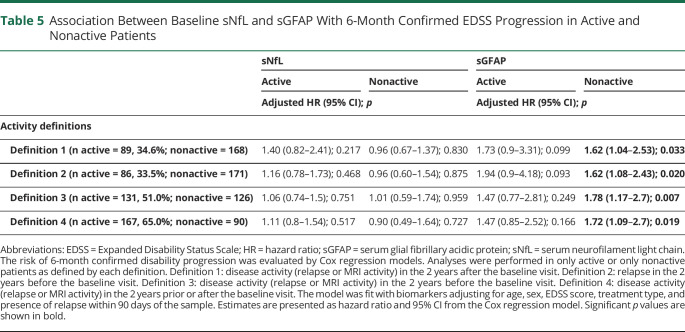
We explored the prognostic value of sGFAP for 6mCDP separately for active and nonactive patients (Table 5). sGFAP was prognostic for 6mCDP in those patients who were defined as nonactive by the absence of disease activity in the 2 years prior and/or after the sample, but was not prognostic for 6mCPD in those patients who were defined as active. This was consistent across all 4 definitions of disease activity.
Table 5.
Association Between Baseline sNfL and sGFAP With 6-Month Confirmed EDSS Progression in Active and Nonactive Patients
We also performed these analyzes for sNfL (Table 5). sNfL was not associated with the risk of future 6mCDP in either active or nonactive patients.
Discussion
Disability progression in MS is commonly recognized as the disability worsening occurring in patients with progressive MS1 or in the absence of relapse activity.8 This process begins early on in the disease and is not halted by current therapeutics.41 The ability to accurately identify nonactive progressive patients is crucial to observational and therapeutic studies focused on identifying effective treatments for progressive MS. A biological measure of progressive MS can enable us to define a patient based on their degree of progressive pathology rather than being or not being progressive MS. Neurodegeneration and astrocytic activation are pathologic hallmarks of progressive MS14 and can be estimated by sNfL and sGFAP levels.17 We here investigated 257 patients with MS at high risk of having an underlying progressive pathology and classified them based on EDSS progression and activity status. We provide evidence that levels of sGFAP and sNfL qualify as biomarkers for stratifying patients with MS at high risk of progressive MS pathology.
The moderate correlation between sGFAP and sNfL suggested that biomarkers of neurodegeneration and astrocytic activation can provide us with complementary information. This is further supported by the fact that sGFAP was associated with MS disease duration, whereas sNfL was associated only with aging that is per se not specific to disease.
The levels of sGFAP, but not sNfL, were higher in female than male patients. A previous study focused on patients with primary progressive MS showed a similar difference despite a limited sample size (18 males and 7 females).40 However, studies that did not focus on patients with progressive MS did not find different GFAP levels between sexes in either blood or CSF33,42 or found GFAP to be increased in males.43 Hence, GFAP levels and the associated astrocytic pathology appear to be higher in females than males at the progressive MS stage, whereas there is no clear difference at earlier MS stages. This might be related to hormonal changes associated with aging and their effect on the pathology of MS.44 This introduces the idea that the interpretation of sGFAP will require age- and sex-adjusted reference ranges similarly to how sNfL requires age-adjusted reference ranges.20,23,45
In our cohort, treated patients did not have lower sNfL levels than untreated patients as previously shown in randomized controlled settings.22,46 In this not randomized controlled setting, there are different factors that need to be considered when interpreting the relationship between sNfL levels and treatment: (1) our patients with an average of 15 years of disease duration are usually treated except if their disease has a mild activity that corresponds per se to lower sNfL levels; hence, there is a nonrandom assignment of treatment and a selection bias; and (2) we evaluated a patient population that is at an advanced disease stage when treatments are the least effective and have therefore the least potential for decreasing sNfL levels.
We investigated how sGFAP and sNfL relate to clinical measures and whether they could improve the discrimination between patients with active and nonactive progressive MS. At baseline, the levels of sGFAP were not altered by the presence of either clinical or MRI acute disease activity that is opposite from what we showed here and was known for sNfL.18,47 Moreover, consistently with previous findings, both biomarkers were positively associated with the EDSS score.20,48,49
The Food and Drug Administration (FDA) has adopted a classification that divides patients with progressive MS into active and nonactive based on the presence or absence of clinical disease activity in the prior 2 years.4 Consequently, treatments targeting progressive MS are evaluated separately for their efficacy in active and nonactive patients. This resulted, for example, in the approval of siponimod for patients with active secondary progressive MS but not for patients with nonactive secondary progressive MS.50 Importantly, the patients who so far profited the least from MS treatments are the patients with nonactive progressive MS. In contrast, patients with active secondary progressive MS benefit the most from anti-inflammatory disease-modifying treatments.13
Considering the differential profile of sGFAP and sNfL in relation to clinical measures, we explored whether their use could help in stratifying patients by their progression and activity status. Indeed, baseline sNfL, but not sGFAP, was elevated in patients with active MS defined by the presence of clinical or focal MRI activity at follow-up. In addition, sNfL was higher in patients who developed a relapse in the 2 years before baseline. Notably, relapse activity in the 2 years before baseline was the definition of activity used by the FDA in the EXPAND clinical trial where the efficacy of siponimod was evaluated in patients with secondary progressive MS.12 We here showed that the potential of sNfL is not limited in retrospectively identifying patients who were active before study inclusion—similarly to the clinical definition used in EXPAND—but could also predict the future development of disease activity and hence the future development of active progressive MS. Clinical trials and clinical research studies on nonactive progressive MS could improve their enrollment accuracy by screening patients based on their sNfL levels. Conversely, the presence of increased sNfL levels may allow for the identification of patients who could benefit from the currently available treatments.
Notably, despite the finding that both sGFAP and sNfL were associated with current EDSS score, only sGFAP was prognostic for future CDP. Moreover, the levels of sGFAP showed the highest prognostic value in patients with low sNfL, hence patients with the least inflammatory activity. The information conveyed by sNfL is comprehensive of the whole CNS18 and is potentially a more sensitive measure of inflammatory activity than the recording of clinical relapses or annual brain MRI scans.45,51 Nevertheless, it was of practical utility to understand how low NfL translated to clinical definitions of nonactive patients. Thus, we additionally explored whether sGFAP performs better in patients who were clinically nonactive. Consistently with the findings in low NfL patients, sGFAP was prognostic for 6mCDP in patients who by the definition of the FDA are to be defined as nonactive progressive MS and was not prognostic in patients who are to be defined as active progressive MS. This supports our hypothesis that sGFAP becomes a relevant biomarker at an advanced stage of progression where CNS compartmentalized processes are driving the pathology.6
The lack of prognostic value of sNfL for disability progression is consistent with references 27, 52, and 53, but differs from other studies where sNfL was prognostic for future disability.20,23-25 This discrepancy may be explained by the differences in the MS populations studied. We focused on patients with MS at high risk of an underlying progressive pathology, whereas the findings of other studies20,23-25 resulted from populations of almost entirely patients with relapsing-remitting MS(81%,20 73%,23 85%,24 and 75%25). Complementary to our findings, a study showed that sNfL failed to predict future disability worsening independent from relapse in 28 patients with relapsing-remitting MS whose inflammatory activity was suppressed by high-efficacy treatment.53 A recent study that leveraged 2 randomized control trials of patients with progressive MS showed that despite the high number of patients and the excellent data sets, the association between NfL and risk of disability progression was limited in magnitude, inconsistently found in either the placebo or the treated arms and present only in patients with clinical relapses.54 Coherently, our data support the idea that sNfL is an excellent biomarker of focal inflammatory activity but lacks the ability to reflect the pathology that drives disease progression. This biological limitation may have also influenced the interpretation of the sNfL analyzes of the phase 2 trial of ibudilast in patients with secondary progressive MS55 and should be considered in ongoing trials of progressive MS treatments. On the positive side, sGFAP stood out by being unaffected by acute disease activity and by its ability to be a marker of disease progression. Notably, sGFAP had prognostic value in those patients with progressive MS who were clinically and biologically (by low sNfL) nonactive. Our finding was further corroborated by the gradual increase in the risk of future progression with increasing sGFAP concentration—from one quintile to next quintile.
Our study had limitations. Not all our patients were included at an EDSS score of 3, but some were at a more advanced EDSS score. We addressed this potential confounder by adjusting for baseline EDSS score in the analyses and by performing an additional analysis on the risk of future 6mCDP with only patients who we knew had just reached EDSS score ≥3. There were differences in follow-up duration; however, we mitigated this factor by using a time-to-event analysis for predicting 6mCDP. A strength of our study is the use of a real-world cohort in a standard clinical setting. This supports the potential for clinical translation in a routine setting of sNfL and sGFAP.
The identification of patients with nonactive progressive MS based solely on a clinical phenotype creates an artificial construct disconnected from the underlying continuum of pathologic changes responsible for MS. The use of sNfL and sGFAP has the potential to assess a patient-specific degree of progression, instead of categorizing patients into progressive MS or not, supporting a precision medicine approach for MS.56 Thus, sNfL and sGFAP qualify as useful biomarkers for the enrollment of patients with nonactive progressive MS in studies dedicated to stop disease progression.
Acknowledgment
T. Chitnis has full access to all the data in the study and takes responsibility for the integrity of the data and the accuracy of the data analysis. The authors thank the following colleagues at the Brigham and Women's Hospital: Mark Anderson, MS, for his role in managing the Brigham Multiple Sclerosis Center research database and Taylor Saraceno, BSc, for her assistance in the submission and technical editing of the manuscript. Coauthor Harald Kropshofer, PhD, died in July 2022.
Glossary
- 6mCDP
6-month confirmed disability progression
- CV
coefficient of variation
- EDSS
Expanded Disability Status Scale
- FDA
Food and Drug Administration
- GFAP
glial fibrillary acidic protein
- HET
high-efficacy treatment
- LET
low-efficacy treatment
- MS
multiple sclerosis
- NfL
neurofilament light chain
- sGFAP
serum GFAP
- sNfL
serum NfL
Appendix. Authors

Study Funding
This work was supported by Novartis Pharmaceuticals Corporation, Postdoctoral Fellowship from the Swiss National Science Foundation (P400PM_191077 to C. Barro), and Department of Defense (W81XWH1810648 to T. Chitnis). Opinions, interpretations, conclusions, and recommendations are those of the authors and are not necessarily endorsed by the Department of Defense.
Disclosure
C. Barro, Y. Liu, S. Saxena, A. Paul, and M. Polgar-Turcsanyi report no disclosures. B.C. Healy has received research support from Analysis Group, Celgene (Bristol-Myers Squibb), Verily Life Sciences, Merck-Serono, Novartis, and Genzyme. C.R.G. Guttmann has received research funding from Sanofi, the National Multiple Sclerosis Society, the International Progressive Multiple Sclerosis Alliance, and the US Office for Naval Research and travel support from Roche Pharmaceuticals and owns stock in Roche, Novartis, GSK, Alnylam, Protalix Biotherapeutics, Arrowhead Pharmaceuticals, Cocrystal Pharma, and Sangamo Therapeutics. R.B. has received consulting fees from Bristol-Myers Squibb and EMD Serono and research support from Bristol-Myers Squibb, EMD Serono, Novartis, the US Department of Defense, the NIH, and the National Multiple Sclerosis Society. H.L.W. has received research support from Cure Alzheimer's Fund, EMD Serono, Inc., Genentech, Inc., NIH, National Multiple Sclerosis Society, Sanofi Genzyme, and Verily Life Sciences, and he has received payment for consulting from Genentech, Inc, IM Therapeutics, I-MAB Biopharma, MedDay Pharmaceuticals, Tiziana Life Sciences, and vTv Therapeutics. T.C. has received compensation for consulting from Banner Life Sciences, Biogen, Bristol-Myers Squibb, Novartis Pharmaceuticals, Roche Genentech, and Sanofi Genzyme, and she has received research support from the NIH, National MS Society, US Department of Defense, Sumaira Foundation, Brainstorm Cell Therapeutics, Bristol-Myers Squibb, EMD Serono, I-Mab Biopharma, Mallinckrodt ARD, Novartis Pharmaceuticals, Octave Bioscience, Roche Genentech, Sanofi Genzyme, and Tiziana Life Sciences. Author Harald Kropshofer is deceased—disclosures are not included for this author. Go to Neurology.org/NN for full disclosure.
References
- 1.Thompson AJ, Banwell BL, Barkhof F, et al. Diagnosis of multiple sclerosis: 2017 revisions of the McDonald criteria. Lancet Neurol. 2018;17(2):162-173. doi: 10.1016/s1474-4422(17)30470-2. [DOI] [PubMed] [Google Scholar]
- 2.Baecher-Allan C, Kaskow BJ, Weiner HL. Multiple sclerosis: mechanisms and immunotherapy. Neuron. 2018;97(4):742-768. doi: 10.1016/j.neuron.2018.01.021. [DOI] [PubMed] [Google Scholar]
- 3.Reich DS, Lucchinetti CF, Calabresi PA. Multiple sclerosis. N Engl J Med. 2018;378:169-180. doi: 10.1056/NEJMra1401483. [DOI] [PMC free article] [PubMed] [Google Scholar]
- 4.Lublin FD, Reingold SC, Cohen JA, et al. Defining the clinical course of multiple sclerosis: the 2013 revisions. Neurology. 2014;83(3):278-286. doi: 10.1212/WNL.0000000000000560. [DOI] [PMC free article] [PubMed] [Google Scholar]
- 5.Vaughn CB, Jakimovski D, Kavak KS, et al. Epidemiology and treatment of multiple sclerosis in elderly populations. Nat Rev Neurol. 2019;15(6):329-342. doi: 10.1038/s41582-019-0183-3. [DOI] [PubMed] [Google Scholar]
- 6.Yong HYF, Yong VW. Mechanism-based criteria to improve therapeutic outcomes in progressive multiple sclerosis. Nat Rev Neurol. 2021;18(1):40-55. doi: 10.1038/s41582-021-00581-x. [DOI] [PubMed] [Google Scholar]
- 7.Weiner HL. The challenge of multiple sclerosis: how do we cure a chronic heterogeneous disease? Ann Neurol. 2009;65(3):239-248. 10.1002/ana.21640. [DOI] [PubMed] [Google Scholar]
- 8.Kappos L, Wolinsky JS, Giovannoni G, et al. Contribution of relapse-independent progression vs relapse-associated worsening to overall confirmed disability accumulation in typical relapsing multiple sclerosis in a pooled analysis of 2 randomized clinical trials. JAMA Neurol. 2020;77(9):1132. doi: 10.1001/jamaneurol.2020.1568. [DOI] [PMC free article] [PubMed] [Google Scholar]
- 9.Katz Sand I, Krieger S, Farrell C, Miller AE. Diagnostic uncertainty during the transition to secondary progressive multiple sclerosis. Mult Scler. 2014;20(12):1654-1657. doi: 10.1177/1352458514521517. [DOI] [PubMed] [Google Scholar]
- 10.Cree BAC, Oksenberg JR, Hauser SL. Multiple sclerosis: two decades of progress. Lancet Neurol. 2022;21(3):211-214. doi: 10.1016/S1474-4422(22)00040-0. [DOI] [PMC free article] [PubMed] [Google Scholar]
- 11.Cree BAC, Arnold DL, Chataway J, et al. Secondary progressive multiple sclerosis: new insights. Neurology. 2021;97(8):378-388. doi: 10.1212/WNL.0000000000012323. [DOI] [PMC free article] [PubMed] [Google Scholar]
- 12.Kappos L, Bar-Or A, Cree BAC, et al. Siponimod versus placebo in secondary progressive multiple sclerosis (EXPAND): a double-blind, randomised, phase 3 study. The Lancet. 2018;391(10127):1263-1273. doi: 10.1016/S0140-6736(18)30475-6. [DOI] [PubMed] [Google Scholar]
- 13.Kalincik T, Manouchehrinia A, Sobisek L, et al. Towards personalized therapy for multiple sclerosis: prediction of individual treatment response. Brain. 2017;140(9):2426-2443. doi: 10.1093/brain/awx185. [DOI] [PubMed] [Google Scholar]
- 14.Mahad DH, Trapp BD, Lassmann H. Pathological mechanisms in progressive multiple sclerosis. Lancet Neurol. 2015;14(2):183-193. doi: 10.1016/S1474-4422(14)70256-X. [DOI] [PubMed] [Google Scholar]
- 15.Giovannoni F, Quintana FJ. The role of astrocytes in CNS inflammation. Trends Immunol. 2020;41(9):805-819. doi: 10.1016/j.it.2020.07.007. [DOI] [PMC free article] [PubMed] [Google Scholar]
- 16.Wheeler MA, Clark IC, Tjon EC, et al. MAFG-driven astrocytes promote CNS inflammation. Nature. 2020;578(7796):593-599. doi: 10.1038/s41586-020-1999-0. [DOI] [PMC free article] [PubMed] [Google Scholar]
- 17.Barro C, Zetterberg H. The blood biomarkers puzzle–a review of protein biomarkers in neurodegenerative diseases. J Neurosci Methods. 2021;361:109281. doi: 10.1016/j.jneumeth.2021.109281. [DOI] [PubMed] [Google Scholar]
- 18.Barro C, Chitnis T, Weiner HL. Blood neurofilament light: a critical review of its application to neurologic disease. Ann Clin Transl Neurol. 2020;7(12):2508-2523. doi: 10.1002/acn3.51234. [DOI] [PMC free article] [PubMed] [Google Scholar]
- 19.Kapoor R, Smith KE, Allegretta M, et al. Serum neurofilament light as a biomarker in progressive multiple sclerosis. Neurology. 2020;95(10):436-444. doi: 10.1212/WNL.0000000000010346. [DOI] [PMC free article] [PubMed] [Google Scholar]
- 20.Disanto G, Barro C, Benkert P, et al. Serum Neurofilament light: a biomarker of neuronal damage in multiple sclerosis. Ann Neurol. 2017;81(6):857-870. doi: 10.1002/ana.24954. [DOI] [PMC free article] [PubMed] [Google Scholar]
- 21.Delcoigne B, Manouchehrinia A, Barro C, et al. Blood neurofilament light levels segregate treatment effects in multiple sclerosis. Neurology. 2020;94(11):e1201-e1212. doi: 10.1212/WNL.0000000000009097. [DOI] [PMC free article] [PubMed] [Google Scholar]
- 22.Kuhle J, Kropshofer H, Haering DA, et al. Blood neurofilament light chain as a biomarker of MS disease activity and treatment response. Neurology. 2019;92(10):e1007-e1015. doi: 10.1212/WNL.0000000000007032. [DOI] [PMC free article] [PubMed] [Google Scholar]
- 23.Barro C, Benkert P, Disanto G, et al. Serum neurofilament as a predictor of disease worsening and brain and spinal cord atrophy in multiple sclerosis. Brain. 2018;141(8):2382-2391. doi: 10.1093/brain/awy154. [DOI] [PubMed] [Google Scholar]
- 24.Manouchehrinia A, Stridh P, Khademi M, et al. Plasma neurofilament light levels are associated with risk of disability in multiple sclerosis. Neurology. 2020;94(23):e2457-e2467. doi: 10.1212/WNL.0000000000009571. [DOI] [PMC free article] [PubMed] [Google Scholar]
- 25.Thebault S, Abdoli M, Fereshtehnejad SM, Tessier D, Tabard-Cossa V, Freedman MS. Serum neurofilament light chain predicts long term clinical outcomes in multiple sclerosis. Sci Rep. 2020;10(1):10381. doi: 10.1038/s41598-020-67504-6. [DOI] [PMC free article] [PubMed] [Google Scholar]
- 26.Goldschmidt C, Fox RJ. Relationship between serum neurofilament light and multiple sclerosis disability progression: clear as mud. Neurology. 2021;97(19):887-888. doi: 10.1212/WNL.0000000000012755. [DOI] [PubMed] [Google Scholar]
- 27.Cantó E, Barro C, Zhao C, et al. Association between serum neurofilament light chain levels and long-term disease course among patients with multiple sclerosis followed up for 12 years. JAMA Neurol. 1220;76(11):1359. doi: 10.1001/jamaneurol.2019.2137. [DOI] [PMC free article] [PubMed] [Google Scholar]
- 28.Chitnis T, Gonzalez C, Healy BC, et al. Neurofilament light chain serum levels correlate with 10-year MRI outcomes in multiple sclerosis. Ann Clin translational Neurol. 2018;5(12):1478-1491. doi: 10.1002/acn3.638. [DOI] [PMC free article] [PubMed] [Google Scholar]
- 29.Watanabe M, Nakamura Y, Michalak Z, et al. Serum GFAP and neurofilament light as biomarkers of disease activity and disability in NMOSD. Neurology. 2019;93(13):e1299-e1311. doi: 10.1212/WNL.0000000000008160. [DOI] [PubMed] [Google Scholar]
- 30.Aktas O, Smith MA, Rees WA, et al. Serum glial fibrillary acidic protein: a neuromyelitis optica spectrum disorder biomarker. Ann Neurol. 2021;89(5):895-910. doi: 10.1002/ana.26067. [DOI] [PMC free article] [PubMed] [Google Scholar]
- 31.Sofroniew MV, Vinters HV. Astrocytes: biology and pathology. Acta Neuropathol. 2010;119(1):7-35. doi: 10.1007/s00401-009-0619-8. [DOI] [PMC free article] [PubMed] [Google Scholar]
- 32.Petzold A. Markers for different glial cell responses in multiple sclerosis: clinical and pathological correlations. Brain. 2002;125(7):1462-1473. doi: 10.1093/brain/awf165. [DOI] [PubMed] [Google Scholar]
- 33.Abdelhak A, Huss A, Kassubek J, Tumani H, Otto M. Serum GFAP as a biomarker for disease severity in multiple sclerosis. Sci Rep. 2018;8(1):14798. doi: 10.1038/s41598-018-33158-8. [DOI] [PMC free article] [PubMed] [Google Scholar]
- 34.Ayrignac X, Le Bars E, Duflos C, et al. Serum GFAP in multiple sclerosis: correlation with disease type and MRI markers of disease severity. Sci Rep. 2020;10(1):10923. doi: 10.1038/s41598-020-67934-2. [DOI] [PMC free article] [PubMed] [Google Scholar]
- 35.Kassubek R, Gorges M, Schocke M, et al. GFAP in early multiple sclerosis: a biomarker for inflammation. Neurosci Lett. 2017;657:166-170. doi: 10.1016/j.neulet.2017.07.050. [DOI] [PubMed] [Google Scholar]
- 36.Abdelhak A, Foschi M, Abu-Rumeileh S, et al. Blood GFAP as an emerging biomarker in brain and spinal cord disorders. Nat Rev Neurol. 2022;18:158-172. doi: 10.1038/s41582-021-00616-3. [DOI] [PubMed] [Google Scholar]
- 37.Gauthier SA, Glanz BI, Mandel M, Weiner HL. A model for the comprehensive investigation of a chronic autoimmune disease: the multiple sclerosis CLIMB study. Autoimmun Rev. 2006;5(8):532-536. doi: 10.1016/j.autrev.2006.02.012. [DOI] [PubMed] [Google Scholar]
- 38.Lorscheider J, Buzzard K, Jokubaitis V, et al. Defining secondary progressive multiple sclerosis. Brain. 2016;139(9):2395-2405. doi: 10.1093/brain/aww173. [DOI] [PubMed] [Google Scholar]
- 39.Lublin FD. New multiple sclerosis phenotypic classification. Eur Neurol. 2014;72(suppl 1):1-5. doi: 10.1159/000367614. [DOI] [PubMed] [Google Scholar]
- 40.Giarraputo J, Giamberardino S, Arvai S, et al. Profiling serum neurofilament light chain and glial fibrillary acidic protein in primary progressive multiple sclerosis. J Neuroimmunology. 2021;354:577541. doi: 10.1016/j.jneuroim.2021.577541. [DOI] [PubMed] [Google Scholar]
- 41.Hauser SL, Cree BAC. Treatment of multiple sclerosis: a review. Am J Med. 2020;133(12):1380-1390.e2. doi: 10.1016/j.amjmed.2020.05.049. [DOI] [PMC free article] [PubMed] [Google Scholar]
- 42.Novakova L, Axelsson M, Khademi M, et al. Cerebrospinal fluid biomarkers as a measure of disease activity and treatment efficacy in relapsing-remitting multiple sclerosis. J Neurochem. 2017;141(2):296-304. doi: 10.1111/jnc.13881. [DOI] [PubMed] [Google Scholar]
- 43.Mane-Martinez MA, Olsson B, Bau L, et al. Glial and neuronal markers in cerebrospinal fluid in different types of multiple sclerosis. J Neuroimmunology. 2016;299:112-117. doi: 10.1016/j.jneuroim.2016.08.004. [DOI] [PubMed] [Google Scholar]
- 44.Ysrraelit MC, Correale J. Impact of sex hormones on immune function and multiple sclerosis development. Immunology. 2019;156(1):9-22. doi: 10.1111/imm.13004. [DOI] [PMC free article] [PubMed] [Google Scholar]
- 45.Benkert P, Meier S, Schaedelin S, et al. Serum neurofilament light chain for individual prognostication of disease activity in people with multiple sclerosis: a retrospective modelling and validation study. Lancet Neurol. 2022;21(3):246-257. doi: 10.1016/S1474-4422(22)00009-6. [DOI] [PubMed] [Google Scholar]
- 46.Kuhle J, Daizadeh N, Benkert P, et al. Sustained reduction of serum neurofilament light chain over 7 years by alemtuzumab in early relapsing–remitting MS. Mult Scler J. 2022;28(4):573573-573582. doi: 10.1177/13524585211032348. [DOI] [PMC free article] [PubMed] [Google Scholar]
- 47.Thebault S, Bose G, Booth R, Freedman MS. Serum neurofilament light in MS: the first true blood-based biomarker? Mult Scler. 2022;28(10):1491-1497. doi: 10.1177/1352458521993066. [DOI] [PMC free article] [PubMed] [Google Scholar]
- 48.Abdelhak A, Hottenrott T, Morenas-Rodríguez E, et al. Glial activation markers in CSF and serum from patients with primary progressive multiple sclerosis: potential of serum GFAP as disease severity marker? Front Neurol. 2019;10:280. doi: 10.3389/fneur.2019.00280. [DOI] [PMC free article] [PubMed] [Google Scholar]
- 49.Högel H, Rissanen E, Barro C, et al. Serum glial fibrillary acidic protein correlates with multiple sclerosis disease severity. Mult Scler. 2020;26(2):210-219. doi: 10.1177/1352458518819380. [DOI] [PubMed] [Google Scholar]
- 50.FDA Approves New Oral Drug to Treat Multiple Sclerosis. Accessed March 27, 2019. fda.gov/news-events/press-announcements/fda-approves-new-oral-drug-treat-multiple-sclerosis. [Google Scholar]
- 51.Uher T, Havrdova EK, Benkert P, et al. Measurement of neurofilaments improves stratification of future disease activity in early multiple sclerosis. Mult Scler J. 2021;27(13):2001-2013. doi: 10.1177/13524585211047977. [DOI] [PubMed] [Google Scholar]
- 52.Gafson AR, Jiang X, Shen C, et al. Serum neurofilament light and multiple sclerosis progression independent of acute inflammation. JAMA Netw Open. 2022;5(2):e2147588. doi: 10.1001/jamanetworkopen.2021.47588. [DOI] [PMC free article] [PubMed] [Google Scholar]
- 53.Bridel C, Leurs CE, van Lierop ZY, et al. Serum neurofilament light association with progression in natalizumab-treated patients with relapsing-remitting multiple sclerosis. Neurology. 2021;97(19):e1898-e1905. doi: 10.1212/WNL.0000000000012752. [DOI] [PubMed] [Google Scholar]
- 54.Leppert D, Kropshofer H, Häring DAA, et al. Blood neurofilament light in progressive multiple sclerosis: post hoc analysis of 2 randomized controlled trials. Neurology. 2022;98(21):e2120-e2131. doi: 10.1212/WNL.0000000000200258. [DOI] [PMC free article] [PubMed] [Google Scholar]
- 55.Fox RJ, Raska P, Barro C, et al. Neurofilament light chain in a phase 2 clinical trial of ibudilast in progressive multiple sclerosis. Mult Scler J. 2021;27(13):20142014-20142022. doi: 10.1177/1352458520986956. [DOI] [PMC free article] [PubMed] [Google Scholar]
- 56.Chitnis T, Prat A. A roadmap to precision medicine for multiple sclerosis. Mult Scler. 2020;26(5):522-532. doi: 10.1177/1352458519881558. [DOI] [PubMed] [Google Scholar]
Associated Data
This section collects any data citations, data availability statements, or supplementary materials included in this article.
Data Availability Statement
Anonymized data not published within this article will be made available by request from any qualified investigator.


