Background:
The COVID-19 pandemic, which broke out in Wuhan, China, in 2019, was declared an international public health emergency by the World Health Organization on January 31, 2020. The outbreak on the Diamond Princess cruise ship had appeared first as a cluster infection outside China during the early pandemic. The incident occurred on February 1, 2020, involved an 80-year-old Hong Kong man who was diagnosed with COVID-19. The cruise ship docked in Yokohama, Japan, for 14 days of onboard quarantine; however, cluster infection outbroke rapidly.
Methods:
We constructed a SIR mathematical model and conducted an epidemiological study of the COVID-19 outbreak on the Diamond Princess cruise ship, covering the period from February 5 (start of quarantine) to February 20 (completion of 14-day quarantine). We estimated the basic reproduction number (R0) using a novel method of nonlinear least-squares curve fitting under Microsoft Excel Solver. The 95% confidence interval (CI) values were estimated by the jackknife procedures.
Results:
Six hundred thirty-four (17.1%) cases were diagnosed in a total population of 3711 cruise passengers, and 328 (51.7%) cases were asymptomatic. As of April 24, 2020, 712 cases had been diagnosed and 14 (1.96%) deaths had occurred. The R0 with 95% CI of the COVID-19 outbreak was 3.04 (2.72–3.36). Without an evacuation plan for passengers and crew, we estimated the total number of cumulative cases would reach 3498 (CI, 3464–3541). If the R0 value was reduced by 25% and 50%, the cumulative cases would be reduced to 3161 (CI, 3087-3254) and 967 (CI, 729-1379), respectively. The abovementioned R0 value was estimated from the original Wuhan strain.
Conclusion:
Cruise conditions would accelerate the spread of infectious diseases and were not suitable for onboard quarantine. Early evacuation and isolation of all passengers and crew members would reduce the R0 value and avoid further infections.
Keywords: Basic reproduction number, Cluster infection, COVID-19, Diamond Princess cruise ship, Nonlinear least-square curve fitting
1. INTRODUCTION
In December 2019, a novel coronavirus, SARS-CoV-2, emerged in Wuhan, China, and spread rapidly within China and then to cities around the world that are highly interconnected with China.1–3 The resulting acute respiratory infection through this coronavirus, a disease now coined as COVID-19 by World Health Organization (WHO), is thought to spread primarily through respiratory droplets from an infected person.4,5
The incubation period of COVID-19 varies significantly from patient to patient. The US CDC data showed that the incubation period from infection to disease onset is from 2 to 14 days.6 A Chinese study published in the New England Journal of Medicine observed an average incubation of 5.2 days.7 Up to date, various SARS-CoV-2 variants have been identified, and the incubation periods of these variants are different. Through further investigation, the US CDC determined the incubation period of the Omicron variant was 2.9–3.2 days.8,9 This is shorter than the incubation period of 4.3 days for the Delta variant.10
Regarding the speed of transmission of new coronaviruses, the basic reproduction number (R0) of an infectious agent is defined as the average number of secondary infections produced by an infected individual in an otherwise susceptible host population.11 R0 less than 1 means the disease will gradually dissipate. The WHO estimates that the R0 of COVID-19 ranges from 1.4 to 2.5.12 Other preliminary studies had estimated that the R0 ranges from 2.24 to 3.58.13 Variants are known to have higher R0. A meta-study showed that R0 values for the Delta variant ranged from 3.2 to 8, with an average of 5.08.14 The Omicron variant has an average R0 of 8.2.15
The official mortality data released by China on February 4, 2020, reported around 2.1% worldwide, Wuhan 4.9%, Hubei Province 3.1%, and other provinces 0.16%.16 However, Wuhan Jinyintan Hospital, where many COVID-19 positive pneumonia patients are treated, has a mortality rate of 11%.17
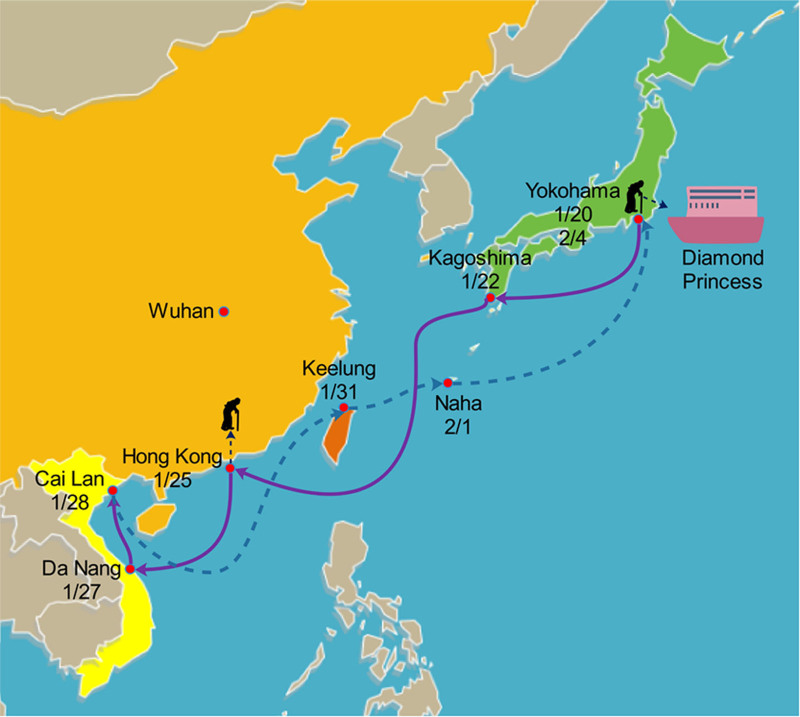
The Diamond Princess sailed from Yokohama on January 20, 2020, to Kagoshima on the 22nd, arrived in Hong Kong on the 25th, and then passed through Vietnam, Taiwan, and Okinawa. The cruise voyage is shown in Fig. 1. The incident occurred on February 1, 2020. An 80-year-old Hong Kong man was diagnosed with the new coronavirus. He took a flight to Tokyo on January 17 and started having cough symptoms on January 19. After this, he boarded the cruise in Yokohama on January 20 and landed at Kai Tak Wharf in Hong Kong on January 25. Fever was detected on January 31 and was confirmed COVID-19 positive on February 1.18
Fig. 1.
Brief cruise diary of the Diamond Princess cruise ship. An 80-year-old Hong Kong man got onboard in Yokohama, Japan, on January 20, disembarked in Hong Kong on January 25 and was confirmed COVID-19 positive on February 1. This Figure is modified from a map template https://yourfreetemplates.com/wp-content/uploads/2017/07/East_Asia_Map.pptx. The software used to make graphics is EdrawMax 9.4. We obtained permission to use and modify templates freely from YourFreeTemplates.com. The templates are under the terms of Creative Commons license, which is Attribution-NoDerivatives 4.0 International (CC BY-ND 4.0)
After the outbreak of the incident, the Diamond Princess was anchored at the port of Yokohama, Japan, on the night of February 3, and a total of 3711 people were quarantined onboard for 14 days in private cabins. However, outbreaks of cluster infections continued to occur during the quarantine period. As of February 20, 634 people had been diagnosed with COVID-19, and an average of one-fifth had been diagnosed. This was the most extensive cluster infection outside China in the early pandemic.18
This epidemic event attracted much attention and related academic research. Russell et al used age-adjusted data from the ship to calculate the estimated value of the case fatality ratio (CFR) and infection mortality ratio (IFR) among individuals aged 70 and older on the Diamond Princess. CFR was 6.4% and IFR was 13%.19 Mizumoto et al20 estimated that the asymptomatic proportion was 17.9%. For research on the basic reproduction number (R0), Mizumoto et al21 used the Monte Carlo Markov Chain (MCMC) method to predict the R0 as ~11. Rocklöv et al22 used the SEIR model to estimate the R0 as 14.8. Zhang et al23 used Maximum-Likelihood (ML) method to estimate the R0 as 2.28.
This study aims to analyze the time serial data of COVID-19 confirmed infections on the Diamond Princess cruise ship, use a novel method and SIR model to estimate the R0 under the cruise ship conditions during the onboard quarantine, predict the infection curve, and propose the countermeasures for the future when similar cluster infection occurs.
2. METHODS
2.1. Study design and data collection
We constructed a SIR mathematical model and conducted an epidemiological study of the COVID-19 outbreak on the Diamond Princess cruise ship, covering the period from February 5 (start of quarantine) to February 20 (completion of 14-day quarantine). Daily time series of laboratory reverse transcription polymerase chain reaction (PCR) test results of passengers and crew members were collected from secondary sources.24
2.2. Definition of study case
The study population is set as a total of 3711 people on the cruise ship, including 2666 passengers onboard from more than 50 countries and 1045 crew members. A confirmed case is defined as a passenger or crew member who tested COVID-19 PCR positive by pharyngeal swab specimen according to the national standard.25 Close contact is defined as the confirmed cases’ family members and cabinmates or partners staying in other cabins. A symptomatic case is defined as a passenger or crew member who had a fever of ≥37.5°C or respiratory symptoms. An asymptomatic case is defined as a person without symptoms at the time of the investigation. A mortality case is defined as a confirmed case who died.
2.3. Ethics statement
Research Ethics Committee A
National Taiwan University Hospital
NTUH-REC No.:202003148W
Title of protocol:A Major Outbreak of 2019 Novel Coronavirus (COVID-19) in the Diamond Princess Cruise Ship.
Trial/Research Institution: National Taiwan University Hospital
Department/ Principal Investigator: Department of Internal Medicine/ Dr. Hung-Bin Tsai
Version date of documents:[Protocol: 2020/04/09] declare that all methods were carried out in accordance with relevant guidelines and regulations. Signed informed consent was waived since only anonymized data were used. The data supporting the findings of this study are available within the article.
2.4. Screening test strategy
The PCR inspection process initially only tests for COVID-19 on symptomatic cases and close contacts. Due to the expansion of laboratory capacity, this screening strategy changed after February 11. All respiratory specimens of the passengers and crew were collected systematically, regardless of individuals’ symptoms.
2.5. Model development and statistical analysis
To assess the transmissibility of the COVID-19 outbreak on the cruise ship, we setup the SIR epidemic model, which is composed of three parts: S denotes the susceptible population, I denotes the infectious population, and R denotes the recovered (or immune) population. It consists of the following differential equations.
| (1) |
| (2) |
| (3) |
where N is the total population, β is the overall transmissibility and contact rate (unit: 1/day), and γ is the recovery rate (unit: 1/day). β and γ are parameters that can be used to define the basic reproduction number as follows
| (4) |
The SIR model satisfies the following equations
| (5) |
| (6) |
Microsoft Excel Solver 2019 was used to analyze the time serial data of confirmed cases. This is a powerful tool widely available in spreadsheets providing a least-squares method of fitting experimental data to nonlinear functions.26–28 The R0 value was estimated from the original Wuhan strain.
Consider the problem of fitting the cumulative infection data. “Cumulative confirmed infections” was established as the target function. The accuracy of minimizing the problem depends on the function model chosen.27
| (7) |
where can be calculated by difference series.
| (8) |
where n means day 1 to day n. Here, ∆t = 1 day was designated for simple demonstration of Figs. 2 and 3. Note that when approximating a set of differential equations by a series of difference equations, the step size (i.e., ∆t) is crucial. To make sure the approximation is accurate, the difference series need to be modified as follows
Fig. 2.
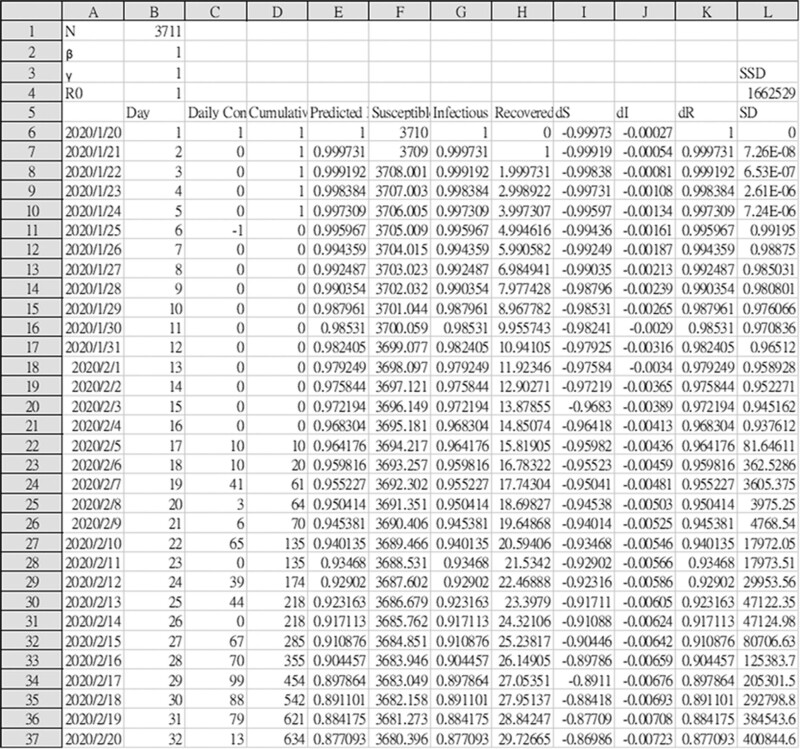
Initial “input” spreadsheet for finding the best values of and in equation (1)-(3). Numbers in columns C and D are daily confirmed infections and cumulative confirmed infections. Numbers in cell B2, B3 are initial guesses for and. The SSD in L4 is the sum to be minimized in equation (11).
Fig. 3.
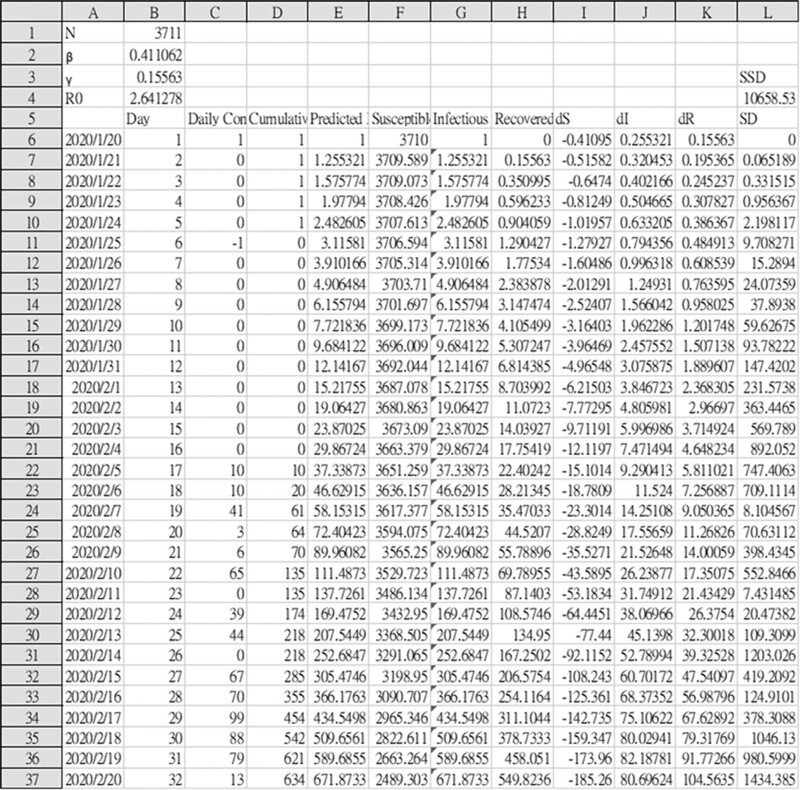
The appearance of the “output” spreadsheet from Fig. 2 after Solver has finished the operation.
| (9) |
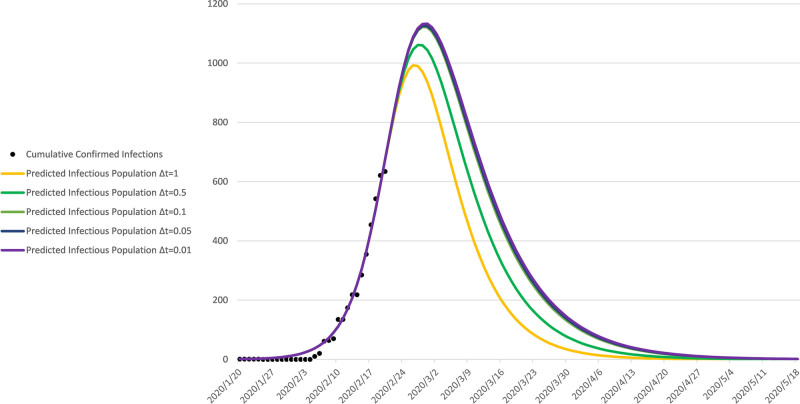
∆t = 0.01 day is used to obtain the result, and ∆t = 1, 0.5, 0.1, 0.05, 0.01 day is used to plot the predicted infectious population in Fig. 5.
Fig. 5.
Nonlinear least-squared curve fitting method. The cumulative confirmed infections (observations: black dot) and predicted infectious population (by SIR model choosing different step sizes: ∆t = 1, 0.5, 0.1, 0.05, 0.01 day respectively) of the Diamond Princess cruise ship are shown together for comparison.
2.6. The least-squares method
The vertical deviation from the th point of the “observed” curve to the “calculated” curve is
vertical deviation = (observed)- (calculated)
| (10) |
The least-squares method is used to find values of in equations (1)–(3) that minimize the sum of the squares of the vertical deviations of the points from the curve26:
| (11) |
Where n is the total number of points (=32)
Here are steps to find the best values of and that minimize the sum in equation (11):
List the reported values of “daily confirmed infections” and “cumulative confirmed infections” in columns C and D of Fig. 2.
Temporarily assign the value 1 to and at the left side of the spreadsheet in cell B2, B3.
In column E, calculate from column G.
In column L, compute the vertical deviation in equation (10) and then square the deviation. For example, L6 = (D6-E6)2.
In cell L4, compute the sum of the squares of vertical deviations in column L. The sum in cell L4 is the sum in equation (11).
The least-squares method is to find values of and that minimize the sum in cell L4. Microsoft Excel Solver is a tool that handles the problem. When Solver finishes its task in a few seconds, the spreadsheet will appear as in Fig. 3. The Solver has adjusted the values in cell B2, B3 to minimize the sum in cell L4. The values of and in cell B2, B3 were used to plot the SIR curve in Figs. 6 and 7.
Try some different initial values of and (other than 1) to see if Solver finds the same solution. A given problem may have many local minima.
Fig. 6.
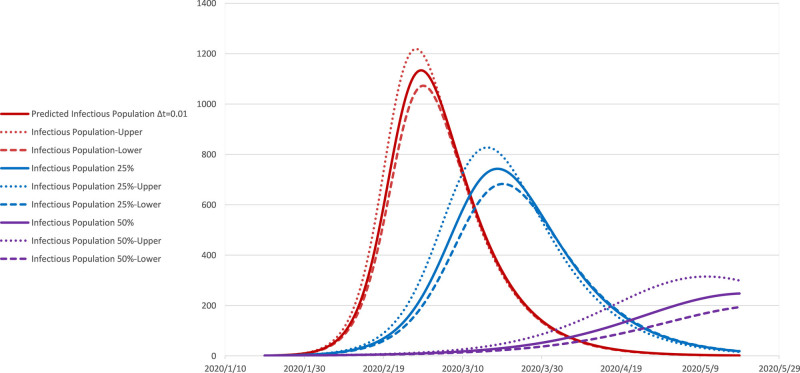
Predicted Infectious population on the Diamond Princess. The red, blue, and purple lines, obtained by the SIR model, estimated the infectious population with R0, 25% reduced R0, and 50% reduced R0, respectively on the cruise ship. The dotted lines represent 95% confidence intervals. The step size is ∆t =0.01 day.
Fig. 7.
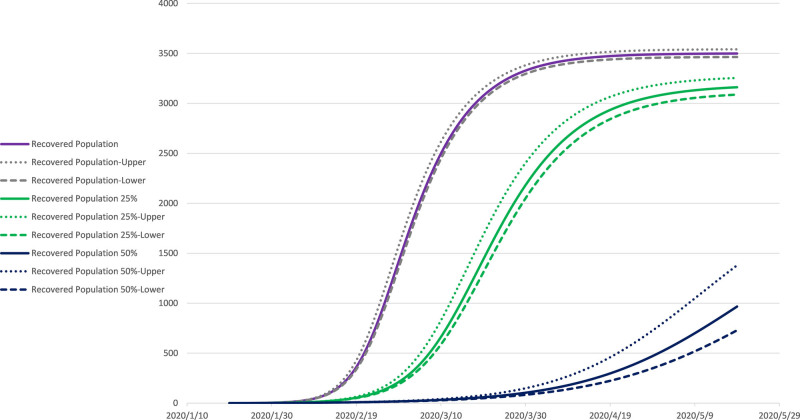
Predicted Recovered population on the Diamond Princess. The purple, green, and blue lines, obtained by the SIR model, estimated the recovered population with R0, 25% reduced R0, and 50% reduced R0, respectively on the cruise ship. The dotted lines represent 95% confidence intervals. The step size is ∆t =0.01 day.
2.7. Jackknife procedures
The jackknife procedures are using as statistical analysis of the COVID-19 outbreak.29,30 Because the number of samples is greater than 30 in this study, the population obeys the normal distribution. Here are steps on computing standard deviation, standard error, sampling error, and 95% confidence interval (CI) values for β, γ, and R0 of Fig. 3 by the jackknife procedures.
Write the sum in cell L4 of Fig. 3 in the form L4 = L6+L7+L8+ … +L37. Delete one term in the sum each time to generate the 32 lines.
For each column compute the standard deviation with the function STDEV.
Find the standard error for each parameter (,, and R0) by standard deviation, where is the number of data points.
Obtain the sampling error by using 1.96 × standard error for each parameter.
Finally, the 95% CI values for β, γ, and R0 are estimated.
This completes the statistical analysis by the jackknife procedures.
3. RESULTS
The Diamond Princess cruise ship carried a total of 3711 people, including 2666 tourists (i.e., 1285 Japanese, 470 Hong Kong residents, 425 Americans, 215 Canadians, 40 British, 25 Russians, 20 Taiwanese, 15 Israelis, and 13 New Zealanders), and 1045 staff/crew members (including 2 Taiwanese). The mean age of the crew was 36, and was 69 for the passengers. The passengers were 55% female, while the crew was 81% male.
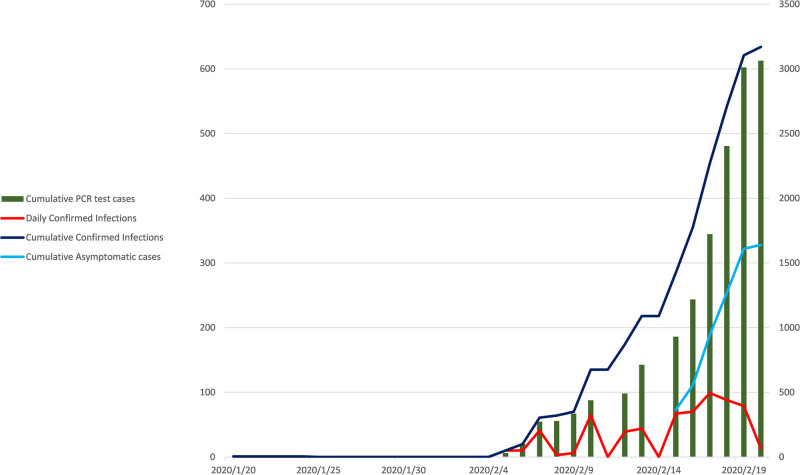
At the end of the quarantine on February 20, 2020, a total of 3063 people of the 3711 onboard the Diamond Princess had been tested for the virus, with a cumulative test rate of 82.5%. The difference is due to those who returned to Japan by plane before the PCR test. To date, a total of 634 cases have been diagnosed with COVID-19, accounting for 17.1% of the total. This includes remarkably high asymptomatic infection cases of 328, accounting for 51.7% of all confirmed cases, due to the change of screening strategy on February 11, the asymptomatic cases are underestimated. Two passengers died on February 20, which accounts for 0.55% of all confirmed cases. All passengers and crew members disembarked on March 1, however, as of April 24, 2020, 712 confirmed cases with 14 deaths and a cumulative mortality rate reached 1.96%. The daily time series of confirmed infections, cumulative confirmed infections, cumulative asymptomatic cases, and cumulative PCR test cases are shown in Fig. 4.
Fig. 4.
The trend of cluster infection and cumulative PCR test cases of the Diamond Princess cruise ship.
3.1. Estimation of parameters and R0
Using the nonlinear least-squares curve fitting method, the daily confirmed infections (observations) and predicted daily infections (by SIR model and choosing different step sizes ∆t = 1, 0.5, 0.1, 0.05, 0.01 day, respectively) are shown together for comparison in Fig. 5. We found that when ∆t=0.01, a good approximation can be obtained.
The results of the statistical analysis are shown in Table 1. We estimated the curve-fit value with 95% CI of β, γ, and R0 to be 0.340 (0.334-0.345), 0.112 (0.107-0.117), and 3.04 (2.72-3.36).
Table 1.
The statistical analysis by the jackknife procedures
| SIR Curve Fit | Standard Deviation | c Valuea | dfb | Sampling Error | 95% CI | ||
|---|---|---|---|---|---|---|---|
| Lower | Upper | ||||||
| β | 0.340 | 0.0157 | 1.96 | 31 | 0.0054 | 0.334 | 0.345 |
| γ | 0.112 | 0.0148 | 1.96 | 31 | 0.0051 | 0.107 | 0.117 |
| R0 | 3.040 | 0.9265 | 1.96 | 31 | 0.3210 | 2.720 | 3.361 |
a95% Confidence Interval (CI), c value =1.96.
bDegree of freedom = N-1.
Before infection prediction, the possibility of reinfection of patients with a weakened immune system should be considered. A recent study suggested that natural infections are protective against reinfection at least for 8–12 months.31 The passengers staying period on that ship was too short to be reinfected. Therefore, in cruise ship conditions, the SIR model was enough to estimate the R0 and predict the infection curve. However, in the real world, people might be reinfected by different variants. SIR model should be modified to SIRS or SEIRS model.
Using the SIR model can further estimate that if all passengers continued to stay on the cruises ship when the quarantine period expired, the infectious population (I) of the Diamond Princess would reach a peak of 1133 (CI, 1072–1219) cases on February 28. If the R0 value was reduced by 25% and 50%, the estimated peak number would be reduced to 742 (CI of 682-803) on Mar 19 and 248 (CI of 194-299) on May 18, respectively, as shown in Fig. 6. Further, assuming that all passengers and crew members continue to extend the onboard quarantine time, the recovered population (R) would be estimated to reach a dynamic equilibrium in about two months. A total of 3498 (CI, 3464–3541), accounts for 94.26% (CI, 93.34%–95.42%) people would have been infected. If the R0 value was reduced by 25% and 50%, the estimated total number of cumulative cases would be reduced to 3161 (CI, 3087–3254) and 967 (CI, 729–1379), accounts for 85.18% (CI, 83.20%–87.70%) and 26.06% (CI, 19.65%–37.16%), respectively, as shown in Fig. 7.
3.2. Sensitivity analysis
Now we perform a sensitivity analysis on the basic reproduction number. The basic reproduction number of the SIR model is given by equation 4,. Sensitivity analysis is often used to determine the robustness of model predictions to parameter values. Such an analysis tells us how important each parameter is to disease transmission. Because of data collection and assumed parameter values, there are often errors. It is used to discover parameters that have a large impact on R0 and should be targeted by intervention strategies. To do this, we use the variable’s normalized forward sensitivity index, with respect to a given parameter, defined as the ratio of the relative change in the variable to the relative change in the parameter, if such a variable is differentiable with respect to the parameters, the sensitivity index is defined using partial derivatives as follows32,33
| (12) |
Where p denotes parameters. An analytical expression for the sensitivity of R0 to each of the parameters it contains can be easily calculated using equation (4). Sensitivity index values for the parameter values in Table 1 are listed in Table 2.
Table 2.
Sensitivity of R0 evaluated for the parameter values given in Table 1, according with equation (4) and definition equation (12)
| Parameter | Sensitivity Index |
|---|---|
| β | +1 |
| γ | -1 |
Note that the sensitivity index may depend on several parameters of the system, but can also be constant, independent of any parameter. For example,, which means increasing (decreasing) β by a given percentage increase (decrease) is always the same percentage as R0. According to Table 2, two estimations of parameters have the same sensitivity index value, but the opposite sign.
In section 2.6, we mentioned that β = 1, γ = 1 (Fig. 2) is used as the initial value of the model, and then the least-square method of Excel Solver is used to converge two parameters to a certain precise value (Fig. 3). This paragraph analyzes whether different results would be obtained if different initial values were used. We use [β = 1, γ = 0.1~1;step 0.1] and [β = 0.1~1;step 0.1, γ = 1], ∆t = 0.01 for analysis, and the results are shown in Table 3. We found that the average values of the three parameters β, γ, and R0 values were 0.34, 0.11, and 3.04, respectively. Different initial values have no effect on the results of this paper.
Table 3.
Sensitivity of different initial values of parameters β and γ to the results
| Initial | Average | ||||||||||
|---|---|---|---|---|---|---|---|---|---|---|---|
| β | 0.1 | 0.2 | 0.3 | 0.4 | 0.5 | 0.6 | 0.7 | 0.8 | 0.9 | 1.0 | |
| γ | 1 | 1 | 1 | 1 | 1 | 1 | 1 | 1 | 1 | 1 | |
| Final | |||||||||||
| β | a | 0.340 | 0.340 | 0.340 | 0.340 | 0.339 | 0.339 | 0.340 | 0.340 | 0.340 | 0.340 |
| γ | a | 0.112 | 0.112 | 0.112 | 0.112 | 0.111 | 0.111 | 0.112 | 0.112 | 0.112 | 0.112 |
| R0 | 3.039 | 3.044 | 3.039 | 3.040 | 3.048 | 3.048 | 3.037 | 3.038 | 3.040 | 0.340 | |
| Initial | |||||||||||
| β | 1 | 1 | 1 | 1 | 1 | 1 | 1 | 1 | 1 | 1 | |
| γ | 0.1 | 0.2 | 0.3 | 0.4 | 0.5 | 0.6 | 0.7 | 0.8 | 0.9 | 1.0 | |
| Final | |||||||||||
| β | 0.340 | 0.340 | 0.340 | 0.340 | 0.340 | 0.340 | 0.340 | 0.340 | 0.340 | 0.340 | 0.340 |
| γ | 0.112 | 0.112 | 0.112 | 0.112 | 0.112 | 0.112 | 0.112 | 0.112 | 0.111 | 0.112 | 0.112 |
| R0 | 3.045 | 3.038 | 3.038 | 3.043 | 3.037 | 3.039 | 3.041 | 3.041 | 3.047 | 3.040 | 3.040 |
aNo converge to any certain value.
4. DISCUSSION
Several aspects of the COVID-19 cluster infection event on the Diamond Princess cruise ship are worthy of discussion. First, is the cruise ship suitable for the isolation of infectious diseases? In the 2 weeks of port quarantine, the infection cases became the largest number of people infected with the COVID-19 virus outside of China. On February 4th, the first day that the Diamond Princess was quarantined, 10 of the 3711 passengers and crew members tested positive for the virus. People with symptoms left the ship and were taken to a Japanese hospital, and the remaining passengers stayed in their staterooms during quarantine. Patients negative for the virus were allowed to disembark and a cumulative 634 cases tested positive for the virus when quarantine was lifted on February 20. The increasing number of cases onboard made it appear as though confinement to the ship was “promoting transmission.”
The environment is a potential medium for virus transmission. A hospital ward environmental virus sampling study of patients with mild upper respiratory tract COVID-19 infection in Singapore showed that the ward was extensively polluted: toilet and sink samples were positive, air samples were negative, and swabs drawn from the exhaust port tested positive. Patients themselves cause severe pollution in the environment through respiratory droplets and fecal discharge.34 Yamagishi et al conducted an environmental sampling study during the outbreak of cluster infection on the Diamond Princess cruise ship. The results showed that SARS-CoV-2 RNA was detected in 58 (10%) of 601 environmental samples. Approximately two-thirds of confirmed cases were detected in the cabins, and none were detected in the cabin of any nonconfirmed cases. The virus was not detected in any samples swabbed in public areas and air samples.35 The above studies indicate that the environment is thoroughly contaminated by viruses and that ship cabins are not suitable for 14-day quarantine measures. Indeed, without evacuation, we estimated that the cumulative infection rate may reach 94.26%.
Secondly, quarantine is a public health crisis for the people onboard, and it can also be used as a microexperiment: despite accelerated artificial conditions, the ship is still a small-scale model of a large-scale outbreak; even patients diagnosed in follow-up actions warrant further research. In particular, even given the COVID-19 data from Wuhan and Hubei, China, there is also a lack of knowledge of how viruses are transmitted outside of China. As already reported the Chinese disease prevention and control department modified the diagnostic conditions on February 13, resulting in significant data changes. Data over time for patients with the new coronavirus on the Diamond Princess cruise ship and the disease progression of those who are positive for the virus but not sick are extremely valuable.
Why are cruise ships prone to cluster infections? Scholars have speculated that there are five main reasons36:
Inside the cruise ship is like a small city and many social activities involving thousands of people will facilitate more intensive and close contacts.
Due to long-term close contact, the spread of infectious diseases can be extended to the second or even the fourth generation and spread widely. This will occur even if some people only stay on the ship for 1 to 3 days.
Thousands of people disembark from ships; their on-shore activities will include playing and purchasing, which promotes the spread of different viruses worldwide.
Once the crew is infected, the situation may become a “super spreader,” spreading to their countrymen and new passengers who come up one after another.
“Air conditioning” equipment with poor design is added to the “narrow space” in a large cruise ship. When a person gets infected with such a respiratory tract virus, coughs, or sneezes, droplets or aerosols will be easily inhaled by other passengers.
4.1. Comparison with prior works
The R0 of COVID-19 cluster infection on the subject cruise ship is 3.04. This value is lower than the R0 of Mizumoto et al and Rocklöv et al, which range from 11 to 14.8,21,22 but the result is higher than the R0 of Zhang et al as 2.28.23 The detailed information of abovementioned studies is compiled in Table 4. The present study has estimated the R0 on this cruise ship based on the cumulative confirmed infections. However, the screening test capacity is insufficient in the early stage of cluster infection outbreaks, and underestimates the number of daily confirmed cases.
Table 4.
Estimation of the R0 of COVID-19 outbreak on Diamond Princess cruise ship
In addition, 51.7% of the asymptomatic patients are diagnosed on the Diamond Princess cruise ship, although the cases are underestimated, which still is higher than the estimation of 17.9% by Mizumoto et al20 and a community-based cohort study report of 40% to 45%.37 These data are precious because asymptomatic infected patients will not enter clinics or hospitals, or undergo virus detection by PCR screening. This high prevalence rate indicates that the virus may have a greater potential than previously estimated to transmit silently and deeply throughout the population.
The limitations of this study are as follows. R0 is obtained using the SIR model, which assumes that the passengers and crew members are uniformly mixed, and the disease transmission and removal rates are constant. Since multiple interventions are implemented during the onboard quarantine to limit the spread of the disease. Population mixing and transmission rate may not be constant. In addition, the assumptions about demographic dynamics (e.g., boarding, disembarking, and migration over time) are critical model parameters. The above factors are confounding factors that may affect the estimated value of R0.
In conclusion, in this study, we use a novel method of nonlinear least-squares curve fitting and SIR model under Microsoft Excel Solver to estimate the R0 of the COVID-19 cluster infection on the Diamond Princess cruise ship. The results show that even with few passengers diagnosed with COVID-19 on a large cruise ship on the high seas, epidemics will break out within a short time, and the cruise ship cabins are not suitable for a 14-day quarantine. To mitigate the spread of infection, the R0 should be reduced. All passengers and crew members must be evacuated to the designated isolation building on the shore, perform the comprehensive PCR test, and quarantine as needed. The new method proposed in this study can rapidly estimate the parameters and R0 value of the infectious transmission model, which is worthy of further study.
ACKNOWLEDGMENTS
We wish to thank the Health 101 Clinic, Beauty 101 Ltd, Taipei Medical Association, Taiwan Primary Care Association, Taiwan Medical Association, Academia Sinica colleagues, and Rear Admiral David Yang of R.O.C. Navy for their assistance and encouragement. The authors would like to pay the highest tribute to the frontline medical staff who fight against COVID-19. This study was supported by the grants from the Ministry of Science and Technology (MOST-111-2410-H-002-212-), Taipei, Taiwan. The funding sources had no roles in study design; in the collection, analysis and interpretation of data; in the writing of the report; and in the decision to submit this article for publication.
Footnotes
Conflicts of interest: The authors declare that they have no conflicts of interest related to the subject matter or materials discussed in this article.
REFERENCES
- 1.Lu H, Stratton CW, Tang YW. Outbreak of pneumonia of unknown etiology in Wuhan, China: the mystery and the miracle. J Med Virol 2020;92:401–2. [DOI] [PMC free article] [PubMed] [Google Scholar]
- 2.Hui DS, Azhar EI, Madani TA, Ntoumi F, Kock R, Dar O, et al. The continuing 2019-nCoV epidemic threat of novel coronaviruses to global health—The latest 2019 novel coronavirus outbreak in Wuhan, China. Int J Infect Dis 2020;91:264–6. [DOI] [PMC free article] [PubMed] [Google Scholar]
- 3.Huang C, Wang Y, Li X, Ren L, Zhao J, Hu Y, et al. Clinical features of patients infected with 2019 novel coronavirus in Wuhan, China. Lancet 2020;395:497–506. [DOI] [PMC free article] [PubMed] [Google Scholar]
- 4.World Health Organization. Coronavirus disease (COVID-2019) situation reports. Available at https://www.who.int/emergencies/diseases/novel-coronavirus-2019/situation-reports; 2019 Accessed Feburay 13, 2021.
- 5.World Health Organization Statement (31 January 2020). Available at https://www.who.int/news/item/30-01-2020-statement-on-the-second-meeting-of-the-international-health-regulations-(2005)-emergency-committee-regarding-the-outbreak-of-novel-coronavirus-(2019-ncov); 2020 Accessed May 31, 2022.
- 6.Centers for Disease Control and Prevention. Coronavirus Disease 2019. Available at https://www.cdc.gov/coronavirus/2019-ncov/index.html; 2019 Accessed Feburay 13, 2021.
- 7.Li Q, Guan X, Wu P, Wang X, Zhou L, Tong Y, et al. Early transmission dynamics in Wuhan, China, of novel coronavirus–infected pneumonia. N Engl J Med 2020;382:1199–207. [DOI] [PMC free article] [PubMed] [Google Scholar]
- 8.World Health Organization. Contact tracing and quarantine in the context of the Omicron SARS-CoV-2 variant: interim guidance. Available at https://www.who.int/publications/i/item/WHO-2019-nCoV-Contact-tracing-and-quarantine-Omicron-variant-2022.1; 2022 Accessed March 26, 2022. [PubMed]
- 9.Jansen L, Tegomoh B, Lange K, Showalter K, Figliomeni J, Abdalhamid B, et al. Investigation of a SARS-CoV-2 B.1.1.529 (Omicron) Variant Cluster —Nebraska, November–December 2021. MMWR Morb Mortal Wkly Rep 2021;70:1782–84. [DOI] [PMC free article] [PubMed] [Google Scholar]
- 10.Grant R, Charmet T, Schaeffer L, Galmiche S, Madec Y, Von Platen C, et al. Impact of SARS-CoV-2 Delta variant on incubation, transmission settings and vaccine effectiveness: re(Grant et al., 2022)sults from a nationwide case-control study in France. Lancet Reg Health Eur 2022;13:100278. [DOI] [PMC free article] [PubMed] [Google Scholar]
- 11.Anderson RM, May RM. Infectious diseases of humans: dynamics and control. Oxford university press; 1992. [Google Scholar]
- 12.World Health Organization. Statement on the meeting of the International Health Regulations (2005) Emergency Committee regarding the outbreak of novel coronavirus 0.(2019-nCoV). Available at https://www.who.int/news-room/detail/23-01-2020-statement-on-the-meeting-of-the-international-health-regulations-(2005)-emergency-committee-regarding-the-outbreak-of-novel-coronavirus-(2019-nCov). 2005. Accessed Feburay 13, 2021.
- 13.Zhao S, Lin Q, Ran J, Musa SS, Yang G, Wang W, et al. Preliminary estimation of the basic reproduction number of novel coronavirus (2019-nCoV) in China, from 2019 to 2020: a data-driven analysis in the early phase of the outbreak. Int J Infect Dis 2020;92:214–7. [DOI] [PMC free article] [PubMed] [Google Scholar]
- 14.Liu Y, Rocklöv J. The reproductive number of the Delta variant of SARS-CoV-2 is far higher compared to the ancestral SARS-CoV-2 virus. J Travel Med 2021;28:taab124. [DOI] [PMC free article] [PubMed] [Google Scholar]
- 15.Liu Y, Rocklöv J. The effective reproduction number for the omicron SARS-CoV-2 variant of concern is several times higher than Delta. J Travel Med 2022:taac037. [DOI] [PMC free article] [PubMed] [Google Scholar]
- 16.National Health Commission of the People’s Republic of China. Available at http://www.nhc.gov.cn/xcs/xwbd/202002/35990d56cfcb43f4a70d7f9703b113c0.shtml; 2020. Accessed Feburay 13, 2021. [DOI] [PMC free article] [PubMed]
- 17.Chen N, Zhou M, Dong X, Qu J, Gong F, Han Y, et al. Epidemiological and clinical characteristics of 99 cases of 2019 novel coronavirus pneumonia in Wuhan, China: a descriptive study. Lancet 2020;395:507–13. [DOI] [PMC free article] [PubMed] [Google Scholar]
- 18.2020 coronavirus outbreak in cruise ships. Wikipedia. Available at https://en.wikipedia.org/wiki/2020_coronavirus_outbreak_in_cruise_ships#Diamond_Princess. 2020. Accessed Feburay 13, 2021.
- 19.Russell TW, Hellewell J, Jarvis CI, Van Zandvoort K, Abbott S, Ratnayake R, et al. Estimating the infection and case fatality ratio for coronavirus disease (COVID-19) using age-adjusted data from the outbreak on the Diamond Princess cruise ship, February 2020. Euro Surveill 2020;25:2000256. [DOI] [PMC free article] [PubMed] [Google Scholar]
- 20.Mizumoto K, Kagaya K, Zarebski A, Chowell G. Estimating the asymptomatic proportion of coronavirus disease 2019 (COVID-19) cases on board the Diamond Princess cruise ship, Yokohama, Japan, 2020. Euro Surveill 2020;25:2000180. [DOI] [PMC free article] [PubMed] [Google Scholar]
- 21.Mizumoto K, Chowell G. Transmission potential of the novel coronavirus (COVID-19) onboard the diamond Princess Cruises Ship, 2020. Infect Dis Model 2020;5:264–70. [DOI] [PMC free article] [PubMed] [Google Scholar]
- 22.Rocklöv J, Sjödin H, Wilder-Smith A. COVID-19 outbreak on the Diamond Princess cruise ship: estimating the epidemic potential and effectiveness of public health countermeasures. J Travel Med 2020;27:taaa030. [DOI] [PMC free article] [PubMed] [Google Scholar]
- 23.Zhang S, Diao M, Yu W, Pei L, Lin Z, Chen D. Estimation of the reproductive number of novel coronavirus (COVID-19) and the probable outbreak size on the Diamond Princess cruise ship: a data-driven analysis. Int J Infect Dis 2020;93:201–4. [DOI] [PMC free article] [PubMed] [Google Scholar]
- 24.National Instatitute of Infectious Disease Japan (NIID) field briefing: Diamond princess COVID-19 cases. Available at https://www.niid.go.jp/niid/en/2019-ncov-e/9407-covid-dp-fe-01.html. 2020. Accessed Feburay 13, 2021.
- 25.National Institute of Infectious Diseases (NIID). [Manual of laboratory diagnosis of novel coronavirus, Japan]. Tokyo: NIID. Japanese. Available at https://www.niid.go.jp/niid/ja/labo-manual.html#class0. 2020. Accessed March 8, 2020. [Google Scholar]
- 26.Least squares. Wikipedia. Available at https://en.wikipedia.org/wiki/Least_squares. 2021. Accessed Feburay 13, 2021.
- 27.Williams JH. Quantifying Measurement. Morgan & Claypool Publishers; 2016. [Google Scholar]
- 28.Harris DC. Nonlinear least-squares curve fitting with Microsoft Excel Solver. J Chem Educ 1998;75:119. [Google Scholar]
- 29.Caceci MS. Estimating error limits in parametric curve fitting. Anal Chem 1989;61:2324–7. [Google Scholar]
- 30.Efron B, Gong G. A leisurely look at the bootstrap, the jackknife, and cross-validation. Am Stat 1983;37:36–48. [Google Scholar]
- 31.Rahman S, Rahman MM, Miah M, Begum MN, Sarmin M, Mahfuz M, et al. COVID-19 reinfections among naturally infected and vaccinated individuals. Sci Rep 2022;12:1–10. [DOI] [PMC free article] [PubMed] [Google Scholar]
- 32.Lloyd L. Sensitivity of model-based epidemiological parameter estimation to model assumptions. In Mathematical and statistical estimation approaches in epidemiology (pp. 123–141). Springer, Dordrecht; 2009. [Google Scholar]
- 33.Wu J, Dhingra R, Gambhir M, Remais JV. Sensitivity analysis of infectious disease models: methods, advances and their application. J R Soc Interface 2013;10:20121018. [DOI] [PMC free article] [PubMed] [Google Scholar]
- 34.Ong SWX, Tan YK, Chia PY, Lee TH, Ng OT, Wong MSY, et al. Air, surface environmental, and personal protective equipment contamination by severe acute respiratory syndrome coronavirus 2 (SARS-CoV-2) from a symptomatic patient. JAMA 2020;323:1610–2. [DOI] [PMC free article] [PubMed] [Google Scholar]
- 35.Yamagishi T, Ohnishi M, Matsunaga N, Kakimoto K, Kamiya H, Okamoto K, et al. Environmental sampling for severe acute respiratory syndrome coronavirus 2 during a COVID-19 outbreak on the Diamond Princess cruise ship. J Infect Dis 2020;222:1098–102. [DOI] [PMC free article] [PubMed] [Google Scholar]
- 36.The News Lens. Five reasons cause warships and cruise ships to be susceptible to “cluster infection”. How can we stop the spread of viruses in large ships? Available at https://www.thenewslens.com/article/134094. 2020. Accessed Feburay 13, 2021.
- 37.Oran DP, Topol EJ. Prevalence of asymptomatic SARS-CoV-2 infection: a narrative review. Ann Intern Med 2020;173:362–7. [DOI] [PMC free article] [PubMed] [Google Scholar]


