

Abstract
Background
Among patients with nonvalvular atrial fibrillation (AF) and an elevated stroke risk, guidelines recommend direct oral anticoagulants (DOACs) over warfarin for stroke prevention. Changes in DOAC use over the past decade have not been well described.
Methods and Results
We evaluated trends in use of DOACs and warfarin from 2011 to 2020 among adults with AF and a CHA2DS2‐VASc score ≥2 based on electronic health record data from 88 health systems in the United States contributing to Cerner Real World Data. The use of DOACs and warfarin was described over time, by age, sex, race, and ethnicity, and at the health‐system level. We identified 436 864 patients with AF at risk for stroke (median age, 78 years; 52.1% men). From 2011 to 2020, overall anticoagulation rates increased from 56.3% to 64.7%, as DOAC use increased steadily (from 4.7% to 47.9%), while warfarin use declined (from 52.4% to 17.7%). DOAC uptake was similar across age, sex, and race and ethnicity groups but varied by health system. In 2020, the median health‐system‐level proportion of patients with AF on a DOAC was 49% (interquartile range, 40%–54%).
Conclusions
Over the past decade, anticoagulation rates for patients with AF have increased modestly as DOACs largely replaced warfarin, though significant gaps remain: One in 3 high‐risk patients with AF is not on any anticoagulant. While DOAC adoption was generally consistent across major demographic groups, use between health systems remained highly variable, suggesting that provider and system factors influence DOAC uptake use more than patient‐level factors.
Keywords: atrial fibrillation, direct oral anticoagulant, quality of care, stroke prevention
Nonstandard Abbreviations and Acronyms
- DOAC
direct oral anticoagulant
- ORBIT‐AF
Outcomes Registry for Better Informed Treatment of Atrial Fibrillation
Clinical Perspective.
What Is New?
From 2011 to 2020 across 88 health systems in the United States, direct oral anticoagulant use increased steadily (4.7% of patients with atrial fibrillation [AF] in 2011 to 47.9% in 2020) while warfarin use declined (from 52.4% to 17.7%), leading to only small increases in the overall rates of anticoagulation in patients with AF (from 56.3% to 64.7% of patients with AF on any anticoagulant).
DOAC uptake trends were similar across age, sex, race, and ethnicity but varied substantially between health systems, suggesting that provider‐ and system‐level factors drive DOAC use more than patient individual characteristics.
What Are the Clinical Implications?
Although increases in DOAC use have led to higher rates of anticoagulation overall in people with AF, many patients remain untreated.
The substantial variability in DOAC uptake between health systems highlights the need for system‐level interventions to improve stroke prevention in AF.
For years, vitamin K antagonists (eg, warfarin) were the only available anticoagulant to prevent stroke in people with atrial fibrillation (AF). However, the need for frequent international normalized ratio monitoring, clinic visits, and the associated need for dietary restrictions posed barriers to optimal implementation of vitamin K antagonists in real‐world practice. 1 The advent of non–vitamin K antagonists, direct oral anticoagulants (DOACs), has provided an important alternative to vitamin K antagonists in nonvalvular AF (defined as AF in the absence of moderate or severe mitral stenosis or a prior valve replacement). 2 In randomized trials, compared with warfarin, DOACs have demonstrated equivalent or superior efficacy to reduce the risk of cardioembolic stroke in AF with consistently less bleeding risk. 3 , 4 , 5 , 6 Based on these data, over the past decade 4 DOACs have been sequentially approved by the US Food and Drug Administration (dabigatran in 2010, rivaroxaban in 2011, apixaban in 2013, and edoxaban in 2015). DOACs are now recommended as preferred over warfarin for stroke prevention among eligible patients with nonvalvular AF. 2
Because of their improved safety profile and ease of use, the availability of DOACs had the potential to increase overall rates of anticoagulation in people with AF. Early studies using data through 2015 showed some early increases in overall use of anticoagulation with increases in DOAC availability. 7 , 8 , 9 Whether this trend has continued in the past 7 years remains unknown.
In this analysis, we sought to assess anticoagulation prescribing patterns in patients with AF across the United States to determine (1) overall trends in uptake of DOACs and pattern of oral anticoagulant use in patients with nonvalvular AF over the past decade; (2) whether DOAC use varied by race, ethnicity, or sex; and (3) whether use of DOACs varied by health system.
METHODS
This study used data from Cerner Real World Data, a large deidentified database from participating health systems using Cerner's electronic health record (EHR) platform. 10 Because of data license restrictions, study data will not be made available upon request. Cerner Real World Data includes all EHR data on patients seen in the health system, including EHR data from other vendors' (non‐Cerner) EHR systems, harmonized into a common data model. Medication data are based on EHR‐documented medication use, which includes both self‐reported medications recorded as part of medication reconciliation processes at visits with the health care system and prescriptions created by the EHR. All visits and medications entered into the EHR at the participating health system are included in Cerner Real World Data, including medications prescribed by outside providers that are entered into the medical record as part of medication reconciliation.
This analysis included all patients seen between January 1, 2011, and December 31, 2020. Patients were included if they were >40 years of age and had ≥2 diagnoses of AF (International Classification of Diseases, Tenth Revision [ICD‐10]: I48.0, I48.1×, I48.2×, I48.91; International Classification of Diseases, Ninth Revision [ICD‐9]: 427.3 or 427.31, or Logical Observation Identifiers Names and Codes code LA27837‐6 or LA17084‐7) at least 1 month apart at any point in the past from an inpatient or outpatient visit. The 2‐code requirement was used because it was previously shown to maximize the positive predictive value of EHR‐based diagnoses of AF. 11 Exclusion criteria included prior mechanical valve or lack of any follow‐up visit within the health system after the second AF diagnosis date.
Comorbidities were derived using a combination of ICD‐9, ICD‐10, and Systemized Nomenclature of Medicine codes, and procedures were identified using ICD‐9 procedure, ICD‐10 procedure, Current Procedural Technology, and Healthcare Common Procedure Coding System codes. A person was considered to have a comorbidity if at least 1 diagnosis or procedure code indicating the comorbidity was present before the date of data evaluation. Relevant comorbidities, age, and sex were then used to calculate individual patient CHA2DS2‐VASc score, which was evaluated in a time‐updated manner for each patient in the database throughout the study period. Patients with a CHA2DS2‐VASc score <2 were excluded, though if they developed comorbidities or if age increased such that their CHA2DS2‐VASc score became ≥2 over time, they were included as of that time point. Patients were censored at their last encounter date in the database.
Medication data available included all medications prescribed through the EHR as well as medications documented as part of clinical care on the basis of patient self‐report or provider entry during medication reconciliation. Medication data were evaluated as of the date of the last health system visit in each quarter, and patients must have met criteria for the diagnosis of AF and a CHA2DS2‐VASc score ≥2 on or before that date to be included in that quarter. When patient medication data included both warfarin and a DOAC (rivaroxaban, edoxaban, dabigatran, or apixaban), they were assigned to the DOAC group to create 3 mutually exclusive groups: warfarin, DOAC, or no anticoagulation. A small proportion of patients were prescribed >1 DOAC; to evaluate patterns of specific DOAC use, these were assigned to each medication for medication‐specific analyses.
Trends in anticoagulation rates and use of warfarin and DOACs over time were evaluated quarterly over the study period, including all eligible people who had a visit with the health system in each quarter. Stratified analyses were used to evaluate for potential differences by sex, race, ethnicity, age, and region. Region was defined on the basis of the first digit of the ZIP code of the health system: Northeast (0, 1), Southeast (2, 3), Midwest (4, 6), South (7), Southwest (8), and West Coast (9). When sex was missing or indicated as “other” (n=1475, 0.3%), they were excluded from the sex‐specific analysis. Race and ethnicity were based on what was documented in the EHR. Race and ethnicity were reported separately in the data set, but combined to establish 3 categories for the main analysis: “Black” included all people with reported Black or African American race, regardless of ethnicity; “Hispanic” included all non‐Black Hispanic people, regardless of race; and “White, Non‐Hispanic” included White, Non‐Hispanic people. As part of the deidentification algorithm for the data, all ages >89 are set to age 89. For this reason, descriptive analyses of age use median age (rather than mean).
To assess for health‐system‐level variability in DOAC adoption, health‐system‐level rates of DOAC use were evaluated by year on the basis of each person's last visit in each calendar year. The median, 25th percentile, and 75th percentile (interquartile range) of the proportion of patients treated with a DOAC was calculated for each health system and evaluated and graphed using a box and whisker plot. For health‐system‐level analyses, health systems with <20 patients in the data set in a single year were excluded. Because not all health systems contributed data starting in 2011, sensitivity analysis was performed including only health systems that began to contribute data in or before 2014.
Contemporary characteristics of patients treated with warfarin, a DOAC, or no anticoagulation were evaluated using data from patients who were in the data set in 2019 or later, using medication data from each person's final visit in the study period. Using the proportion of patients on a DOAC in this time period by health system, we categorized health systems into high, medium, and low adopters of DOACs on the basis of tertile of DOAC use after 2019. Using the last patient visit within each health system to evaluate patient characteristics, we then assessed for differences in patient characteristics seen at low‐, medium‐, and high‐adopter systems, as well as differences in health‐system‐level factors including bed size, ZIP code, and type of health system. Standardized differences between patients seen at low versus high DOAC health systems were calculated, using a standardized difference >0.2 to indicate a moderate difference between groups and >0.5 to indicate a large difference between groups. Trends in patient‐level factors by tertile of DOAC use were assessed using the following: Jonckheere‐Terpstra test for continuous variables, Kruskall‐Wallis test for categorical variables, and Cochran‐Armitage test for binary variables.
Descriptive statistics are presented using median (interquartile range) for continuous measures and n (%) for categorial variables. All data were analyzed on the Cerner‐hosted data science environment HealtheDataLab using fully deidentified data, with statistical analyses and data management conducted using Python 3.7, Spark 2.4 (Apache), and R 4.0 (R Foundation for Statistical Computing, Vienna, Austria). The study was deemed exempt from institutional review board review by the Duke University Institutional Review Board.
RESULTS
We identified 699 954 adults with at least 1 diagnosis of AF between 2011 and 2021, of whom 501 678 had ≥2 diagnoses separated by at least 30 days. We excluded 48 812 patients who had CHADS‐VASc score<2, 1072 with a mechanical valve, and 14 930 who had no longitudinal follow‐up data beyond the date of their second AF diagnosis. The final study population included 436 864 patients across 88 health systems in the United States.
The number of patients seen at these health systems included a median of 1454 and interquartile range of 247 to 6331 patients. The sample size increased over time, from 14 534 in 2011, to 68 675 in 2014, 170 737 in 2016, and 281 067 in 2020, reflecting increasing numbers and size of health systems contributing data to the data set. Individuals were included from the time of their second qualifying diagnosis of AF: The median follow‐up time for patients in the data set was 22.3 months (interquartile range, 28.8–40.0 months).
Table 1 shows characteristics of the study population in the overall data set (n=436 864 patients with AF). Across the entire sample, the median age of patients was 78.3, 52.1% were men, 6.2% were Black, and 6.3% were Hispanic. Nearly all patients (92.0%) had hypertension, and a large proportion had chronic kidney disease (30.5%), diabetes (40.8%), and coronary artery disease (20.9%). Of the overall population, 76.0% (n=331 842) had at least 1 encounter after 2019. Among these patients, 56 512 (17.0%) were on warfarin, n=155 371 (46.8%) were on a DOAC, and n=119 959 (36.1%) were on no anticoagulation. Characteristics of those patients are shown in Table 1. Compared with those on warfarin, those on a DOAC were slightly younger (median age, 77.1 versus 79.2 years), included slightly more women (48.0% versus 44.8%), and slightly fewer White people (87.4% versus 89.6%). Among those on a DOAC, ≤2% patients had active medication records for >1 DOAC in any given quarter (Figure S1).
Table 1.
Characteristics of Patients With AF Between 2011 and 2020 Overall and Stratified by Anticoagulant Use Among Those Seen After 2019
| Overall AF population | Warfarin users after 2019 | DOAC users after 2019 | No anticoagulant after 2019 | |
|---|---|---|---|---|
| Characteristics | 436 864 | 56 512 | 155 371 | 119 959 |
| Age, y | ||||
| Median (25th, 75th) | 78.3 (71.3, 84.5) | 79.2 (72.7, 85.3) | 77.1 (70.4, 83.5) | 77.8 (70.4, 85.1) |
| Sex | ||||
| Female | 207 698 (47.5) | 25 316 (44.8) | 74 639 (48.0) | 57 703 (48.1) |
| Male | 227 691 (52.1) | 30 997 (54.9) | 80 194 (51.6) | 61 831 (51.5) |
| Other/Unknown | 1475 (0.3) | 199 (0.4) | 538 (0.3) | 425 (0.4) |
| Race | ||||
| Black/African American | 27 227 (6.2) | 2971 (5.3) | 10 492 (6.8) | 7365 (6.1) |
| White | 383 162 (87.7) | 50 794 (89.9) | 135 936 (87.5) | 105 195 (87.7) |
| Other * +Unknown | 26 475 (6.1) | 2747 (4.9) | 8943 (5.8) | 7399 (6.2) |
| Ethnicity | ||||
| Not Hispanic or Latino | 397 819 (91.1) | 52 896 (93.6) | 141 845 (91.3) | 108 889 (90.8) |
| Hispanic or Latino | 27 570 (6.3) | 2346 (4.2) | 9836 (6.3) | 8600 (7.2) |
| Ethnicity unknown | 11 475 (2.6) | 1270 (2.2) | 3690 (2.4) | 2470 (2.1) |
| Comorbidities | ||||
| Coronary artery disease | 91 161 (20.9) | 11 129 (19.7) | 29 578 (19.0) | 28 290 (23.6) |
| Peripheral arterial disease | 43 561 (10.0) | 5731 (10.1) | 15 127 (9.7) | 13 618 (11.4) |
| Prior stroke | 74 402 (17.0) | 9469 (16.8) | 26 411 (17.0) | 19 577 (16.3) |
| Hypertension | 402 110 (92.0) | 51 687 (91.5) | 143 811 (92.6) | 110 711 (92.3) |
| Type 2 diabetes | 178 128 (40.8) | 23 189 (41.0) | 61 371 (39.5) | 48 811 (40.7) |
| End‐stage renal disease | 17 699 (4.1) | 2174 (3.8) | 4249 (2.7) | 6178 (5.2) |
| Heart failure | 120 434 (27.6) | 17 609 (31.2) | 46 183 (29.7) | 36 471 (30.4) |
| CHA2DS2‐VASc score (median, 25th, 75th) | 3.0 (2.0, 4.0) | 3.0 (2.0, 3.0) | 3.0 (2.0, 4.0) | 3.0 (2.0, 4.0) |
The first column shows characteristics of all patients with AF seen in participating health systems between 2011 and 2020, based on data from each patient's final encounter with the health system. The last 3 columns include data from patients seen after 2019, stratified by anticoagulant use at the final encounter with the health system through 2020. All data are presented as n (%) except where noted. AF indicates atrial fibrillation; and DOAC, direct oral anticoagulant.
Unknown racial group, other racial group, mixed racial group, and American Indian or Alaska Native were combined into the Other category.
Figure 1 shows use of any anticoagulant, warfarin, and DOAC from 2011 to 2020. Overall rates of anticoagulation rose slightly over time, with decreasing use of warfarin offset by increasing use of DOACs. By 2017, DOACs had overtaken warfarin as the dominant anticoagulant used. Figure S2 temporal trends in specific DOACs used, with early uptake of dabigatran, followed by rivaroxaban, then apixaban. Since 2015, apixaban use has exceeded other DOACs, while dabigatran use has declined.
Figure 1. Rates of anticoagulation in patients with AF and CHA2DS2‐VASc score ≥2, 2011 to 2020.

Proportion of patients with AF on any anticoagulant, DOAC, and warfarin between 2011 and 2020. AF indicates atrial fibrillation; and DOAC, direct oral anticoagulant.
Figure 2 shows temporal trends in anticoagulant use by age (Figure 2A), sex (Figure 2B), and race and ethnicity (Figure 2C). Throughout the past decade, very small differences were seen in the proportion of adults receiving any anticoagulant by age and sex, with older adults and women receiving DOACs at slightly higher rates than younger adults and men throughout the study period. No consistent trend was seen in anticoagulation rates between race and ethnicity groups. Figure S3 shows use of oral anticoagulants by region of the United States: the lowest rates of DOAC use were observed in patients seen in health systems in the Southwest and Midwest.
Figure 2. Proportion of patients with atrial fibrillation on a DOAC by age, race and ethnicity, and sex over time.
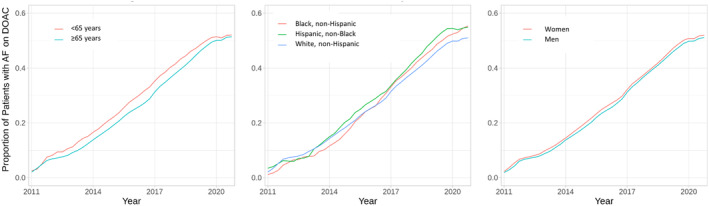
Proportion of patients with atrial fibrillation on any anticoagulant, DOAC, and warfarin between 2011 and 2020, stratified by age (A), race and ethnicity (B), and sex (C). DOAC indicates direct oral anticoagulant.
Significant variability was observed in the proportion of patients with AF receiving a DOAC at the hospital level. Figure 3 shows the distribution of health‐system‐level rates of DOAC use by year from 2011 to 2020. Across 41 hospitals contributing data in 2013, the median rate of DOAC use was 10%, with an interquartile range from 4% to 15%. By 2020, the median proportion of patients receiving a DOAC was 49%; for health systems in the highest quartile of DOAC use, >54% were on a DOAC, while <33% of patients were on a DOAC in health systems in the lowest quartile of use. As new health systems began contributing data to the data set in the prior 5 years, the number of health systems increased over time. Figure S4 shows the same data (distribution of health‐system rates of DOAC use by year) restricted to hospitals that had contributed data beginning in 2014 or before; similar heterogeneity in health‐system rates of DOAC use was seen (2020 median DOAC rate was 49%, interquartile range, 41–54%). While insurance information was not available for patients in the data set, we did evaluate health‐system rates of DOAC use among those ≥65 years of age (the age at which most would be eligible for Medicare). Similar health‐system‐level variability in DOAC use was also noted for patients >65 years of age as shown in Figure S5; in 2020, the median proportion of those >65 years of age on a DOAC was 72%, with an interquartile range between 62% and 80%.
Figure 3. Health‐system‐level proportion of patients with AF on a DOAC by year, 2011 to2020.

Distribution of health‐system rates of DOAC use between 2011 and 2020, including health systems that had at least 20 patients with AF in the data set in a given year. The data table shows the number of health systems in the year and the percentiles of patients on a DOAC across those health systems in each year. AF indicates atrial fibrillation; and DOAC, direct oral anticoagulant.
To evaluate differences in patient populations between high, average, and low DOAC user health systems, we stratified health systems into 3 tertiles on the basis of the proportion of patients at that health system on a DOAC after 2019. In the lowest tertile of health systems, 49.7% of patients were on a DOAC; in the middle tertile, 64.5% were on a DOAC; and in the highest tertile, 75.7% were on a DOAC. There was no association between health‐system tertile of DOAC use and health‐system rates of anticoagulation for patients with AF: 65.7% of patients with AF were on any anticoagulant in the tertile of health systems with the lowest DOAC use, 58.1% were on any anticoagulant in the second tertile, and 62.0% in the third tertile (P‐trend=0.806):
Table 2 shows characteristics of patients included in the analysis after 2019 stratified by health‐system tertile of DOAC use. Small differences were seen in patient age and sex by tertile of DOAC use, with patients treated at health systems with high DOAC use being slightly older (standardized difference, 0.171) and having fewer women (standardized difference, 0.095) than at health systems with low DOAC use. In contrast, moderate differences were seen in the distribution of race and sex at the health system level by tertile of DOAC use, with increasing rates of Black race and Hispanic ethnicity as tertile of DOAC use increased (P‐trend <0.001). Small differences were seen in rates of all comorbidities, with trends for increasing prevalence of comorbidities with increasing tertile of health‐system DOAC use. Health systems with more DOAC use tended to be larger and more likely to include regional health systems and academic medical centers compared with low‐use health systems (Table 2).
Table 2.
Characteristics of Patients and Health Systems Stratified by Tertile of Health‐System DOAC Use
| Low | Mid | High | Standardized difference (low vs high) | ||
|---|---|---|---|---|---|
| 49 330 | 190 169 | 197 365 | (low vs high) | P‐trend | |
| Patient characteristics | |||||
| Any anticoagulant | 32 401 (65.7) | 110 459 (58.1) | 122 309 (62.0) | 0.077 | 0.806 |
| Any DOAC | 16 114 (49.7) | 71 301 (64.5) | 92 647 (75.7) | 0.559 | <0.001 |
| Apixaban | 10 665 (21.6) | 48 739 (25.6) | 61 972 (31.4) | … | … |
| Dabigatran | 786 (1.6) | 4679 (2.5) | 5972 (3.0) | … | … |
| Edoxaban | 250 (0.5) | 589 (0.3) | 644 (0.3) | … | … |
| Rivaroxaban | 4592 (9.3) | 18 392 (9.7) | 26 071 (13.2) | … | … |
| Warfarin | 16 633 (33.7) | 40 887 (21.5) | 31 797 (16.1) | … | … |
| Age, y | |||||
| Median (25th, 75th) | 79.7 (72.7, 85.3) | 78.3 (71.4, 84.4) | 78.0 (70.8, 84.4) | 0.171 | 0.002 |
| Sex | |||||
| Female | 24 226 (49.1) | 90 781 (47.7) | 92 691 (47.0) | 0.095 | <0.001 |
| Male | 25 072 (50.8) | 99 018 (52.1) | 103 601 (52.5) | ||
| Other/Unknown | 32 (0.1) | 370 (0.2) | 1073 (0.5) | ||
| Race | |||||
| Black or African American | 379 (0.8) | 7618 (4.0) | 19 230 (9.7) | 0.437 | <0.001 |
| Other†/Unknown | 2651 (5.4) | 7340 (3.9) | 16 484 (8.4) | ||
| White | 46 300 (93.9) | 175 211 (92.1) | 161 651 (81.9) | ||
| Ethnicity | |||||
| Ethnic group unknown | 2053 (4.2) | 3749 (2.0) | 5673 (2.9) | 0.359 | <0.001 |
| Hispanic or Latino | 1013 (2.1) | 5738 (3.0) | 20 819 (10.5) | ||
| Not Hispanic or Latino | 46 264 (93.8) | 180 682 (95.0) | 170 873 (86.6) | ||
| Comorbidities | |||||
| CAD | 8471 (17.2) | 42 868 (22.5) | 39 822 (20.2) | 0.077 | 0.01 |
| PAD | 3808 (7.7) | 16 344 (8.6) | 23 409 (11.9) | 0.140 | <0.001 |
| Prior stroke | 7459 (15.1) | 32 521 (17.1) | 34 422 (17.4) | 0.063 | <0.001 |
| Hypertension | 43 517 (88.2) | 174 793 (91.9) | 183 800 (93.1) | 0.169 | <0.001 |
| Type 2 diabetes | 18 919 (38.4) | 75 754 (39.8) | 83 455 (42.3) | 0.080 | <0.001 |
| ESRD | 1127 (2.3) | 6701 (3.5) | 9871 (5.0) | 0.145 | <0.001 |
| HF | 10 059 (20.4) | 49 164 (25.9) | 61 211 (31.0) | 0.245 | <0.001 |
| Health‐system characteristics | |||||
| Bed size | |||||
| <100 | 17 (58.6) | 8 (27.6) | 6 (20.7) | ||
| 100–500 | 10 (34.5) | 7 (24.1) | 8 (28.6) | ||
| 500–1000 | 2 (6.9) | 10 (34.5) | 7 (25.0) | ||
| 1000+ | 0 | 4 (13.8) | 7 (25.0) | ||
| Unknown | 1 (3.5) | 0 | 1 (3.6) | ||
| Health‐system type | |||||
| Academic medical center | 1 (3.3) | 3 (10.3) | 2 (6.9) | * | |
| Regional health system/IDN | 1 (3.3) | 11 (37.9) | 11 (37.9) | * | |
| All other | 28 (93.3) | 15 (51.7) | 16 (55.2) | * | |
CAD indicates coronary artery disease; DOAC, direct oral anticoagulant; ESRD, end‐stage renal disease; HF, heart failure; IDN, integrated delivery network; and PAD, peripheral arterial disease.
Because of small numbers of health systems in some cells, statistical testing was not performed on health‐system characteristics.
Unknown racial group, other racial group, mixed racial group, and American Indian or Alaska Native were combined into the Other category.
DISCUSSION
In this large EHR‐based analysis of >400 000 patients with AF across 88 health systems in the United States, we observed a slow but steady increase in the use of DOACs over the past 10 years. The uptake of DOACs was remarkably constant among patient groups including by sex, race, ethnicity, and age group. In contrast, there was wide variability in DOAC uptake between health systems. While DOACs now predominate, a significant lag was observed between when these medications were approved by the US Food and Drug Administration and when they became widely used. Dabigatran was approved in 2010, rivaroxaban in 2011, and apixaban in 2013. However, DOAC use did not overtake warfarin among individuals with AF for >5 years. The reasons for this lag are likely multifactorial, including the relatively higher cost compared with warfarin, provider unfamiliarity with new agents, concerns about the lack of reversibility of agents, and prior authorization processes limiting access to medications.
Given the logistical challenges of warfarin, there was potential that increasing use of DOACs could have helped improve anticoagulation rates in high‐risk patients with AF. Early data from registry studies suggested that this may be the case, 7 , 9 but in this study while DOAC use accelerated, because of a large corresponding decline in warfarin use, the overall use of any anticoagulant increased only slightly over time. In this analysis, as recently as 2020, 1 in 3 patients with a guideline indication for anticoagulation based on elevated CHA2DS2‐VASc score were on no anticoagulant. Furthermore, health systems with the highest rates of DOAC use did not have correspondingly higher rates of anticoagulation. This suggests that the availability of more convenient, lower‐bleeding‐risk therapies such as DOACs as an alternative to warfarin has been insufficient to fully close the gap in stroke prevention in AF. While we do not expect 100% anticoagulant use, as some patients may choose to not take an anticoagulant and others may be contraindicated because of high bleeding risk, the variability in rates of any anticoagulation between health systems seen throughout the study period demonstrates continued opportunity for improvement.
Our analysis included data through the end of 2020, a time that overlapped with the COVID‐19 pandemic. This may have impacted rates of DOAC use in this period given the dramatic changes in clinical care during this period. After a steady increase in DOAC uptake from 2011 through 2019, we did observe a plateauing in the rate of DOAC use in 2020, which may have been a result of the COVID‐19 pandemic. Whether the prior trend of increasing DOAC use will resume after the pandemic remains to be seen.
While other studies showed that Black people were less likely to be treated with a DOAC, including a large registry study and an analysis of Medicare beneficiaries, this was not seen in our analysis. 12 , 13 Rather, Black and Hispanic individuals received anticoagulation and DOACs at similar rates as non‐Hispanic White adults. The reasons for our observed differences may relate to differences in the populations studied and study designs. Registry studies require prospective patient enrollment and consent, and participating sites may be more engaged in AF care, which may lead to a selection bias. Claims‐based analyses from insurance data sets, including Medicare, by design are subject to selection bias for people with the type of insurance in the database, and may not reflect the overall patterns of care for patients with atrial fibrillation seen in clinical practice. Importantly, our analysis was not designed to determine if racial differences exist for DOAC use within health systems, but rather to evaluate DOAC use across the entire population of patients cared for across the participating health systems. In our study, health systems with the highest tertile of DOAC use also had the largest proportions of African American/Black and Hispanic patients compared with health systems in the low and average tertiles of DOAC use. It is still possible for racial variability in DOAC use to exist within individual health systems that is obscured when these data are viewed in aggregate.
While this study included a large number of health systems, the EHR database used is not designed to be a nationally representative sample and includes data from only health systems that opt into the database. The racial and ethnic breakdown of patients with AF in this study is likely influenced by the demographics of the populations seen by participating health systems but did include a large number of non‐White and Hispanic people. In our study, 6.5% of those with AF were Black, which is less than the proportion of people overall in the United States who are Black. However, Black/African American people in the United States have been shown to have lower rates of AF compared with White people. 14 In the United States Medicare population, 93.0% of those with AF in 2010 were White and 4.1% were Black. 14 , 15
Similar to race and ethnicity, we found no clinically significant difference in use of anticoagulation or DOACs by sex, even using the same CHA2DS2‐VASc. Older adults, at higher risk for stroke on average, had only very slightly higher rates of DOAC use during the study period. Taken as a whole, we found that patient‐level clinical and demographic factors did not appear to be driving DOAC use. Unlike patient‐level factors such as age, sex, or race and ethnicity influencing DOAC use, we did observe substantial variability in DOAC use at the health‐system level, resulting also in apparent differences in DOAC use by region. As recently as 2020, at half of the health systems studied, fewer than half of patients with AF at risk for stroke were on a DOAC. This suggests that much of the ongoing variability at the health‐system level observed in the rates of DOAC between health systems may be attributable to differences in prescribing practices and not differences in patient mix.
Moving forward, research on reasons for differential use of DOACs between health system may help reveal potential target interventions to improve overall DOAC use. Health‐system‐level interventions that could be considered to increase DOAC use include provider detailing and education, and support to overcome system‐level barriers to DOAC use such as prior authorization and high patient out‐of‐pocket costs. Further work should also examine whether additional variability exists between providers or provider types or individual clinics within health systems to further tailor quality improvement interventions.
Our study has several notable limitations. First, while we used prior EHR data to determine CHA2DS2‐VASc score, incomplete data may have led some patients to be inappropriately excluded because of a low CHA2DS2‐VASc score. However, <10% of our initial sample of patients with AF was found to have a CHA2DS2‐VASc score <2, thus this is unlikely to impact our overall findings. Second, some patients may have been inappropriately diagnosed in the EHR with comorbidities, artificially increasing their CHA2DS2‐VASc score, and may not have been truly eligible for anticoagulation. However, given the high median age of the population and high rates of multiple comorbidities, the proportion of patients truly at low risk who were inappropriately categorized is likely low. Epidemiologic studies show that <20% of patients with AF have a CHA2DS2‐VASc score <2. 16 , 17 Because CHA2DS2‐VASc is a composite score that includes age and sex (which are easily captured), and a cutoff of 2 was used to identify those indicated for anticoagulation, EHR‐based algorithms for identifying CHA2DS2‐Vasc scores ≥2 have high positive predictive value. In one prior study that used a 10‐year lookback period to identify comorbidities in EHR data to calculate a CHA2DS2‐Vasc score, the positive predictive value of a CHA2DS2‐Vasc score ≥ 2 was 96.2%. 18 Furthermore, the distribution of those meeting criteria for anticoagulation is unlikely to shift over time; therefore, the conclusions regarding temporal trends and site‐level variation are likely unaffected by those with low CHA2DS2‐VASc scores. Third, DOACs are not recommended in people with valvular AF, that is, AF in the setting of moderate to severe mitral stenosis or in the presence of an artificial heart valve. 19 Although we did exclude patients with prior valve replacement, we were not able to exclude those with moderate to severe mitral stenosis, as we did not have access to echocardiographic data. However, the relative size of this population compared with those with nonvalvular AF in the United States is small: in the ORBIT‐AF (Outcomes Registry for Better Informed Treatment of Atrial Fibrillation) registry, only 4.1% of participants with AF had a mechanical valve or mitral stenosis. 20 Furthermore, the prevalence of this is unlikely to vary substantially across health systems and therefore unlikely to qualitatively change our findings. Regardless of indication, some ongoing warfarin use is expected: Patients may prefer warfarin over a DOAC, and others may not be able to afford a DOAC. Fourth, regarding health‐system‐level differences, we are unable to determine the degree to which variability between health systems may be attributable to differences in the proportion of patients with access to prescription drug coverage, a factor we were unable to evaluate in our data set because of lack of adequate data on insurance status. However, even when restricted to the population of patients >65 years of age (the vast majority of whom would be eligible for Medicare), the heterogeneity in DOAC use remained. Fifth, our analysis of differences in DOAC use by race and ethnicity used data from the EHR, which likely varies in quality and accuracy and is subject to variability in capture between health systems. Finally, we did not exclude patients with relative or absolute contraindications to any anticoagulation, including those with bleeding diatheses, high bleeding risk, or prior bleeds.
Similarly, our study has several strengths. By examining data from the EHR for all patients in the participating health systems, we are able to both evaluate health‐system‐level rates of anticoagulation and examine trends over time across patients seen in routine care. In addition, because the source of medication data was the EHR, we are able to identify those filling prescriptions who pay cash or use coupon or patient assistance programs who would not be identified in claims‐based analyses.
CONCLUSIONS
While DOACs are now much more commonly used than warfarin in patients with AF at risk for stroke, DOAC use did not overtake warfarin use for more than half a decade after the first DOAC reached the market. At a population level, patient‐level differences did not appear to drive differences in DOAC use. Substantial variability in the proportion of patients receiving a DOAC between health systems and lack of large patient‐level differences in those receiving warfarin versus DOACs suggests that provider and health‐system‐level factors are responsible for the majority of ongoing warfarin use. Despite increasing use of DOACs, nearly 1 in 3 patients with AF and elevated CHA2DS2‐VASc score remains on no anticoagulation. Regardless of agent chosen, significant room for improvement remains in improving stroke prevention in patients with AF.
Sources of Funding
The study was sponsored by Janssen Pharmaceuticals, which provided support to the institutions of the co‐authors for the research and funded access to the data. The study sponsor had no role in the design of the study, analysis, or interpretation of the data, nor the decision to publish. Dr Kolkailah was supported by the National Heart, Lung, and Blood Institute of the National Institutes of Health under Award Number T32HL125247. The content is solely the responsibility of the authors and does not necessarily represent the official view of the National Institutes of Health.
Disclosures
Drs Peterson, Navar, Shah, Rousseau, Flaker, and Pignone and R. Overton received research support to their respective institutions from Janssen for work on this study. Drs Navar and Peterson receive research funding to their institution for research from Bristol Myers Squibb outside the scope of this research project, consulting fees for research consulting from Bristol Myers Squibb, Boehringer Ingelheim, and Janssen Pharmaceuticals, and consulting fees for research advising from Cerner outside of this project. The remaining authors have no disclosures to report.
Supporting information
Figures S1–S5
Portions of this research were presented at the American College of Cardiology's Scientific Sessions, April 2‐4, 2022.
Supplemental Material is available at https://www.ahajournals.org/doi/suppl/10.1161/JAHA.122.026723
For Sources of Funding and Disclosures, see page 9.
References
- 1. Ingelgard A, Hollowell J, Reddy P, Gold K, Tran K, Fitzmaurice D. What are the barriers to warfarin use in atrial fibrillation?: development of a questionnaire. J Thromb Thrombolysis. 2006;21:257–265. doi: 10.1007/s11239-006-5633-2 [DOI] [PubMed] [Google Scholar]
- 2. January CT, Wann LS, Calkins H, Chen LY, Cigarroa JE, Cleveland JC Jr, Ellinor PT, Ezekowitz MD, Field ME, Furie KL, et al. 2019 AHA/ACC/HRS focused update of the 2014 AHA/ACC/HRS guideline for the management of patients with atrial fibrillation: a report of the American College of Cardiology/American Heart Association task force on clinical practice guidelines and the Heart Rhythm Society in collaboration with the Society of Thoracic Surgeons. Circulation. 2019;140:e125–e151. doi: 10.1161/CIR.0000000000000665 [DOI] [PubMed] [Google Scholar]
- 3. Connolly SJ, Ezekowitz MD, Yusuf S, Eikelboom J, Oldgren J, Parekh A, Pogue J, Reilly PA, Themeles E, Varrone J, et al. Dabigatran versus warfarin in patients with atrial fibrillation. N Engl J Med. 2009;361:1139–1151. doi: 10.1056/NEJMoa0905561 [DOI] [PubMed] [Google Scholar]
- 4. Giugliano RP, Ruff CT, Braunwald E, Murphy SA, Wiviott SD, Halperin JL, Waldo AL, Ezekowitz MD, Weitz JI, Spinar J, et al. Edoxaban versus warfarin in patients with atrial fibrillation. N Engl J Med. 2013;369:2093–2104. doi: 10.1056/NEJMoa1310907 [DOI] [PubMed] [Google Scholar]
- 5. Granger CB, Alexander JH, McMurray JJ, Lopes RD, Hylek EM, Hanna M, Al‐Khalidi HR, Ansell J, Atar D, Avezum A, et al. Apixaban versus warfarin in patients with atrial fibrillation. N Engl J Med. 2011;365:981–992. doi: 10.1056/NEJMoa1107039 [DOI] [PubMed] [Google Scholar]
- 6. Patel MR, Mahaffey KW, Garg J, Pan G, Singer DE, Hacke W, Breithardt G, Halperin JL, Hankey GJ, Piccini JP, et al. Rivaroxaban versus warfarin in nonvalvular atrial fibrillation. N Engl J Med. 2011;365:883–891. doi: 10.1056/NEJMoa1009638 [DOI] [PubMed] [Google Scholar]
- 7. Katz DF, Maddox TM, Turakhia M, Gehi A, O'Brien EC, Lubitz SA, Turchin A, Doros G, Lei L, Varosy P, et al. Contemporary trends in oral anticoagulant prescription in atrial fibrillation patients at low to moderate risk of stroke after guideline‐recommended change in use of the CHADS2 to the CHA2DS2‐VASc score for thromboembolic risk assessment: analysis from the National Cardiovascular Data Registry's outpatient practice innovation and clinical excellence atrial fibrillation registry. Circ Cardiovasc Qual Outcomes. 2017;10:e003476. doi: 10.1161/CIRCOUTCOMES.116.003476 [DOI] [PubMed] [Google Scholar]
- 8. Yu AYX, Malo S, Svenson LW, Wilton SB, Hill MD. Temporal trends in the use and comparative effectiveness of direct oral anticoagulant agents versus warfarin for nonvalvular atrial fibrillation: a Canadian population‐based study. J Am Heart Assoc. 2017;6:e007129. doi: 10.1161/JAHA.117.007129 [DOI] [PMC free article] [PubMed] [Google Scholar]
- 9. Marzec LN, Wang J, Shah ND, Chan PS, Ting HH, Gosch KL, Hsu JC, Maddox TM. Influence of direct oral anticoagulants on rates of oral anticoagulation for atrial fibrillation. J Am Coll Cardiol. 2017;69:2475–2484. doi: 10.1016/j.jacc.2017.03.540 [DOI] [PubMed] [Google Scholar]
- 10. Ehwerhemuepha L, Carlson K, Moog R, Bondurant B, Akridge C, Moreno T, Gasperino G, Feaster W. Cerner real‐world data (CRWD)—a de‐identified multicenter electronic health records database. Data Brief. 2022;42:108120. doi: 10.1016/j.dib.2022.108120 [DOI] [PMC free article] [PubMed] [Google Scholar]
- 11. Chamberlain AM, Roger VL, Noseworthy PA, Chen LY, Weston SA, Jiang R, Alonso A. Identification of incident atrial fibrillation from electronic medical records. J Am Heart Assoc. 2022;11:e023237. doi: 10.1161/JAHA.121.023237 [DOI] [PMC free article] [PubMed] [Google Scholar]
- 12. Essien UR, Magnani JW, Chen N, Gellad WF, Fine MJ, Hernandez I. Race/ethnicity and sex‐related differences in direct oral anticoagulant initiation in newly diagnosed atrial fibrillation: a retrospective study of Medicare data. J Natl Med Assoc. 2020;112:103–108. doi: 10.1016/j.jnma.2019.10.003 [DOI] [PMC free article] [PubMed] [Google Scholar]
- 13. Essien UR, Holmes DN, Jackson LR II, Fonarow GC, Mahaffey KW, Reiffel JA, Steinberg BA, Allen LA, Chan PS, Freeman JV, et al. Association of Race/ethnicity with Oral anticoagulant use in patients with atrial fibrillation: findings from the outcomes registry for better informed treatment of atrial fibrillation II. JAMA Cardiol. 2018;3:1174–1182. doi: 10.1001/jamacardio.2018.3945 [DOI] [PMC free article] [PubMed] [Google Scholar]
- 14. Mou L, Norby FL, Chen LY, O'Neal WT, Lewis TT, Loehr LR, Soliman EZ, Alonso A. Lifetime risk of atrial fibrillation by race and socioeconomic status: ARIC study (atherosclerosis risk in communities). Circ Arrhythm Electrophysiol. 2018;11:e006350. doi: 10.1161/CIRCEP.118.006350 [DOI] [PMC free article] [PubMed] [Google Scholar]
- 15. Shroff GR, Solid CA, Herzog CA. Atrial fibrillation, stroke, and anticoagulation in Medicare beneficiaries: trends by age, sex, and race, 1992‐2010. J Am Heart Assoc. 2014;3:e000756. doi: 10.1161/JAHA.113.000756 [DOI] [PMC free article] [PubMed] [Google Scholar]
- 16. Lahewala S, Arora S, Patel P, Kumar V, Patel N, Tripathi B, Patel N, Kallur KR, Shah H, Syed A, et al. Atrial fibrillation: utility of CHADS2 and CHA2DS2‐VASc scores as predictors of readmission, mortality and resource utilization. Int J Cardiol. 2017;245:162–167. doi: 10.1016/j.ijcard.2017.06.090 [DOI] [PubMed] [Google Scholar]
- 17. Naccarelli GV, Panaccio MP, Cummins G, Tu N. CHADS2 and CHA2DS2‐VASc risk factors to predict first cardiovascular hospitalization among atrial fibrillation/atrial flutter patients. Am J Cardiol. 2012;109:1526–1533. doi: 10.1016/j.amjcard.2012.01.371 [DOI] [PubMed] [Google Scholar]
- 18. Navar‐Boggan AM, Rymer JA, Piccini JP, Shatila W, Ring L, Stafford JA, Al‐Khatib SM, Peterson ED. Accuracy and validation of an automated electronic algorithm to identify patients with atrial fibrillation at risk for stroke. Am Heart J. 2015;169:39–44e2. [DOI] [PubMed] [Google Scholar]
- 19. January CT, Wann LS, Calkins H, Chen LY, Cigarroa JE, Cleveland JC Jr, Ellinor PT, Ezekowitz MD, Field ME, Furie KL, et al. 2019 AHA/ACC/HRS focused update of the 2014 AHA/ACC/HRS guideline for the Management of Patients with Atrial Fibrillation: a report of the American College of Cardiology/American Heart Association task force on clinical practice guidelines and the Heart Rhythm Society. J Am Coll Cardiol. 2019;74:104–132. doi: 10.1016/j.jacc.2019.01.011 [DOI] [PubMed] [Google Scholar]
- 20. Thomas KL, Jackson LR II, Shrader P, Ansell J, Fonarow GC, Gersh B, Kowey PR, Mahaffey KW, Singer DE, Thomas L, et al. Prevalence, characteristics, and outcomes of valvular heart disease in patients with atrial fibrillation: insights from the ORBIT‐AF (outcomes registry for better informed treatment for atrial fibrillation). J Am Heart Assoc. 2017;6:e006475. [DOI] [PMC free article] [PubMed] [Google Scholar]
Associated Data
This section collects any data citations, data availability statements, or supplementary materials included in this article.
Supplementary Materials
Figures S1–S5