

Abstract
Background
Heart failure (HF) has a dramatic impact on worldwide health care systems that is determined by the growing prevalence of and the high exposure to cardiovascular and noncardiovascular events. Prognosis remains poor. We sought to compare a large population with HF across the ejection fraction (EF) spectrum with a population without HF for patient characteristics, and HF, cardiovascular, and noncardiovascular outcomes.
Methods and Results
Patients with HF registered in the Swedish HF registry in 2005 to 2018 were compared 1:3 with a sex‐, age‐, and county‐matched population without HF. Outcomes were cardiovascular and noncardiovascular mortality and hospitalizations. Of 76 453 patients with HF, 53% had reduced EF, 23% mildly reduced EF, and 24% preserved EF. Compared with those without HF, patients with HF had more cardiovascular and noncardiovascular comorbidities and worse socioeconomic status. Incidence of cardiovascular and noncardiovascular events was higher in people with HF versus non‐HF, with increased risk of all‐cause (hazard ratio [HR], 2.53 [95% CI, 2.50–2.56]), cardiovascular (HR, 4.67 [95% CI, 4.59–4.76]), and noncardiovascular (HR, 1.49 [95% CI, 1.46–1.52]) mortality, 2‐ to 5‐fold higher risk of first/repeated cardiovascular and noncardiovascular hospitalizations, and ~4 times longer in‐hospital length of stay for any cause. Patients with HF with reduced EF had higher risk of HF hospitalizations, whereas those with HF with preserved EF had higher risk of all‐cause and noncardiovascular hospitalization and mortality.
Conclusions
Patients with HF exert a high health care burden, with a much higher risk of cardiovascular, all‐cause, and noncardiovascular events, and nearly 4 times as many days spent in hospital compared with those without HF. These epidemiological data may enable strategies for optimal resource allocation and HF trial design.
Keywords: comorbidity, ejection fraction, epidemiology, heart failure
Subject Categories: Heart Failure, Epidemiology
Nonstandard Abbreviations and Acronyms
- ARNI
angiotensin receptor neprilysin inhibitor
- IRR
incidence rate ratio
- HFmrEF
heart failure with mildly reduced ejection fraction
- HFpEF
heart failure with preserved ejection fraction
- HFrEF
heart failure with reduced ejection fraction
- RASI
renin‐angiotensin‐system inhibitor
- SwedeHF
Swedish Heart Failure Registry
Clinical Perspective.
What Is New?
We described much higher burden of cardiovascular and noncardiovascular comorbidities in heart failure (HF) versus non‐HF, which was linked with dramatically higher exposure to cardiovascular/noncardiovascular mortality and morbidity in the former versus the latter.
We highlighted the different patient profiles and outcomes in HF across the ejection fraction spectrum.
Patients with HF with reduced ejection fraction had more severe HF and higher risk of HF‐related outcomes compared with those with mildly reduced ejection fraction and with preserved ejection fraction, whereas patients with HF with preserved ejection fraction had higher comorbidity burden and were more likely exposed to all‐cause, cardiovascular and, in particular, noncardiovascular mortality/morbidity.
What Are the Clinical Implications?
Information derived from this comprehensive epidemiological overview increases the awareness of the burden that HF exerts on the whole health care system and might promote initiatives for the optimization of resource allocation and for the identification of best targets of intervention.
Heart failure (HF) is a global pandemic that affects more than 64 million people worldwide and its prevalence is steadily growing. 1 Prognosis in HF remains poor, and the burden of HF‐related hospitalizations is increasing. 2 , 3 Patients with HF are also exposed to cardiovascular and noncardiovascular events that are not directly explained by HF. 4 Consistently, in patients with HF, hospitalizations for HF and for cardiovascular causes account for <30% and 50%, respectively, of 30‐day readmissions after diagnosis. 5 , 6 The increasing prevalence of HF with preserved ejection fraction (HFpEF) has in part modified the phenotypic distribution of patients admitted for HF, with larger representation of HFpEF. 7
These aspects have a dramatic impact on worldwide health care systems, both in terms of human and financial resources. In Europe, the estimated costs for HF amount to ~€29 billion and are predominantly driven by frequent, prolonged, and recurrent hospitalizations. 8
Therefore, in the present study we sought to comprehensively compare a large population with HF across the ejection fraction (EF) spectrum with a matched control population without HF with regard to demographic features, comorbidities and treatments, and HF‐related and nonrelated outcomes, which might contribute to explain the significant burden of HF on health care resources.
METHODS
Data Sources
The data used in this study are available from the corresponding author, provided that data sharing is permitted by European Union General Data Protection Regulation and appropriate ethics committees. Patients with HF were identified through the SwedeHF (Swedish HF Registry). SwedeHF has been previously described. 9 Briefly, it is an ongoing voluntary health care quality registry founded in 2000 and implemented on a national basis in 2003. Written consent is not required, but patients are informed of registration and allowed to opt out. A majority of Swedish hospitals (~60 out of 75 hospitals) and to a minor extent also primary care centers enroll patients without financial compensation and collect approximately 80 variables, that is, data on demographics, comorbidities, clinical parameters, biomarkers, treatments, and organizational aspects, from adult inpatient wards and outpatient clinics (www.swedehf.se). The inclusion criterion was clinician‐judged HF until April 2017 and after that defined as a diagnosis of HF according to the following International Classification of Diseases, Tenth Revision (ICD‐10) codes: I50.0, I50.1, I50.9, I42.0, I42.6, I42.7, I25.5, I11.0, I13.0, and I13.2. Reported coverage of SwedeHF in 2019 was 30.4% of the prevalent population with HF in Sweden.
Linkage to Statistics Sweden provided socioeconomic data and the control population without HF. The National Patient Registry, a national mandatory registration of administrative records from hospitalizations and nonprimary outpatient care maintained by The National Board of Health and Welfare, provided data on additional comorbidities and hospital accesses outcomes. The DDR (Dispensed Drug Registry, established in July 2005) provided data on medications prescribed and actually dispensed to the individual patients. More details on selection criteria and variable definitions are available at https://kiheartfailure.github.io/shfdb3/ (ICD codes for additional variables and Anatomical Therapeutic Chemical codes for medications are reported in Table S1). Linkage between the registries was allowed by the personal identification number, which all residents in Sweden have.
Establishment of the HF registry and this analysis with linking of the registries was approved by the Swedish Ethical Review Authority and complies with the Declaration of Helsinki.
Patients and Outcomes
For the current analysis, 76 453 patients with HF registered between December 1, 2005 (DDR activation +5 months in order to capture available treatments) and December 31, 2018 were considered. Patients with HF who died during the hospitalization that prompted to the SwedeHF registration or had reused/changed personal identification numbers were excluded. For patients with >1 registration, the first was selected. EF was recorded as a categorical variable in SwedeHF: EF ≥50% (defined as HFpEF), EF=40%–49% (defined as mildly reduced EF—HFmrEF), and EF <40% (defined as reduced EF—HFrEF).
A control cohort of 229 359 individuals without HF was derived from Statistics Sweden. Controls were selected in a ratio of 1:3 for each post in SwedeHF. Eligible controls were individuals without a diagnosis of HF and were matched by sex, year of birth, and county of residence at index.
The outcomes of interest were all‐cause mortality, cardiovascular mortality, noncardiovascular mortality, first and repeated all‐cause HF, cardiovascular and noncardiovascular hospitalizations, first and repeated all‐cause outpatient visits and first emergency visits, and first coronary revascularization. Emergency visits were defined as unplanned admission to an emergency ward. Length of in‐hospital stay (LOS) was defined as total in‐hospital time (for the respective diagnosis in primary position) from index date to end of follow‐up, calculated per follow‐up year.
Statistical Analysis
Categorical variables were presented as absolute frequencies (%), and differences across study groups were tested by chi‐square test. Continuous variables were reported as median [interquartile range] and differences across groups were tested by Kruskal–Wallis test. The proportion of missing data for each variable is reported in Table S2. Percentage of use of HF treatments (renin‐angiotensin‐system inhibitors [RASI]/angiotensin receptor neprilysin inhibitors [ARNI], beta blockers, and mineralocorticoid receptor antagonists) over time was calculated, and the crude rate ratio for each EF phenotype was estimated using a generalized linear model with a binomial distribution and a log link.
Incidence rates per 1000 per year was calculated together with 95% Poisson CIs. Time to first events was presented by Kaplan–Meier curves for all‐cause mortality and by cumulative incidence curves treating death as competing event for the other outcomes. Median survival free from the event of interest was calculated for each group. Mean cumulative function was used to depict repeated events. Univariate Cox proportional hazards regressions were fitted to model the time to first event. Repeated events were modeled by a negative binomial generalized linear model including the log of time as an offset. Data were censored at December 31, 2019 or death/emigration, and, for the controls, also at a later diagnosis of HF. The level of significance was set to 5%, 2 sided. All analyses were performed using R v.4.0.2 (R Core Team 2019). The R codes for data management and statistical analyses are found at https://github.com/KIHeartFailure/useofcare.
RESULTS
The overall HF population included 76 453 patients. Of these, 53% had HFrEF, 23% HFmrEF, and 24% HFpEF. The control population without HF included 229 359 patients. Median age was 76 (67–83) years, and 36.9% were female.
Baseline Characteristics of Populations with HF Versus Without HF
Compared with subjects without HF, patients with HF showed an overall higher cardiovascular comorbidity burden (ie, ischemic heart disease) was observed in 52.4% of patients with HF versus 14.6% without HF, diabetes in 25.2% versus 8.5%, atrial fibrillation in 51.8% versus 7.8%, hypertension in 56.1% versus 22.2%, history of stroke in 14.3% versus 9.1%, and peripheral artery disease in 8.8% versus 2.8%, respectively (Table 1 and Figure 1).
Table 1.
Baseline Characteristics of the Population With HF Compared With the Population Without HF
| HF | Non‐HF | P | |
|---|---|---|---|
| No. | 76 453 | 229 359 | |
| Demographic/organizational characteristics | |||
| Sex, male, n (%) | 48 214 (63.1) | 144 642 (63.1) | 1.000 |
| Age, y, median (IQR) | 76.0 [67.0, 83.0] | 76.0 [67, 83] | 1.000 |
| Outpatient, n (%) | 39 872 (52.2) | … | |
| Follow‐up referral HF nurse clinic, n (%) | 40 813 (56.7) | … | |
| Follow‐up referral specialty, n (%) | |||
| Hospital | 48 209 (66.1) | ‐ | |
| Primary care | 22 657 (31.1) | ‐ | |
| Other | 2018 (2.8) | ‐ | |
| Year of registration, n (%) | 1.000 | ||
| 2005–2010 | 27 514 (36.0) | 82 542 (36.0) | |
| 2011–2015 | 28 256 (37.0) | 84 768 (37.0) | |
| 2016–2018 | 20 683 (27.1) | 62 049 (27.1) | |
| Clinical characteristics | |||
| EF category, n (%) | |||
| HF with reduced EF | 40 893 (53.5) | ||
| HF with mildly reduced EF | 17 395 (22.8) | ||
| HF with preserved EF | 18 165 (23.8) | ||
| HF duration >6 months, n (%) | 36 178 (48.6) | ‐ | |
| New York Heart Association class, n (%) | |||
| I | 6181 (11.8) | ‐ | |
| II | 25 423 (48.4) | ‐ | |
| III | 19 183 (36.6) | ‐ | |
| IV | 1693 (3.2) | ‐ | |
| Systolic blood pressure, mm Hg, median (IQR) | 125 [112, 140] | ‐ | |
| Diastolic blood pressure, mm Hg, median (IQR) | 72.0 [65, 80] | ‐ | |
| HR, bpm, median (IQR) | 72.0 [63, 83] | ‐ | |
| HR >70 bpm, n (%) | 39 108 (52.7) | ‐ | |
| Left bundle‐branch block, n (%) | 11 550 (18.2) | ‐ | |
| Laboratory measurements | |||
| Hemoglobin, g/L, median (IQR) | 133 [120, 145] | ‐ | |
| eGFR (mL/min per 1.73 m2)*, median (IQR) | 62.2 [45.1, 80.2] | ‐ | |
| eGFR <60 mL/min per 1.73 m2, n (%) | 35 145 (46.6) | ‐ | |
| N‐terminal pro‐B‐type natriuretic peptide, pg/mL, median (IQR) | 2399 [1044, 5338] | ‐ | |
| Hyperkalemia, n (%) | 1099 (1.4) | 345 (0.2) | <0.001 |
| Hypokalemia, n (%) | 1567 (2.0) | 1117 (0.5) | <0.001 |
| Medical history/comorbidities | |||
| BMI, kg/m2, median (IQR) | 26.5 [23.4, 30.2] | ‐ | |
| BMI ≥30, n (%) | 12 092 (26.5) | ‐ | |
| Former/current smoker, n (%) | 32 764 (56.0) | ‐ | |
| Diabetes, n (%) | 19 258 (25.2) | 19 429 (8.5) | <0.001 |
| Renal failure, n (%) | 9449 (12.4) | 4124 (1.8) | <0.001 |
| Atrial fibrillation, n (%) | 39 593 (51.8) | 17 950 (7.8) | <0.001 |
| Ischemic heart disease, n (%) | 40 056 (52.4) | 33 591 (14.6) | <0.001 |
| Anemia, n (%) | 10 866 (14.2) | 9456 (4.1) | <0.001 |
| Hypertension, n (%) | 42 910 (56.1) | 50 935 (22.2) | <0.001 |
| Peripheral artery disease, n (%) | 6715 (8.8) | 6378 (2.8) | <0.001 |
| Percutaneous coronary intervention, n (%) | 10 076 (13.2) | 4563 (2.0) | <0.001 |
| Coronary artery bypass graft, n (%) | 17 014 (22.3) | 8442 (3.7) | <0.001 |
| Stroke, n (%) | 10 959 (14.3) | 20 871 (9.1) | <0.001 |
| Valvular disease, n (%) | 15 373 (20.1) | 5297 (2.3) | <0.001 |
| Malignant cancer, n (%) | 10 853 (14.2) | 27 332 (11.9) | <0.001 |
| Chronic obstructive pulmonary disease, n (%) | 10 002 (13.1) | 6821 (3.0) | <0.001 |
| Liver disease, n (%) | 1552 (2.0) | 1482 (0.6) | <0.001 |
| Dementia, n (%) | 1310 (1.7) | 7520 (3.3) | <0.001 |
| Severe bleeding, n (%) | 13 486 (17.6) | 16 594 (7.2) | <0.001 |
| Musculoskeletal/connective tissue diseases, n (%) | 23 616 (30.9) | 46 145 (20.1) | <0.001 |
| Alcohol abuse, n (%) | 2430 (3.2) | 3117 (1.4) | <0.001 |
| Charlson comorbidity index | 2.0 [1.0, 4.0] | 0.0 [0.0, 2.0] | <0.001 |
| Treatments | |||
| Devices (implantable cardioverter‐defibrillator/cardiac resynchronization therapy) | 3530 (4.6) | 78 (0.0) | <0.001 |
| Renin‐angiotensin system/angiotensin receptor neprilysin inhibitors, n (%) | 66 654 (87.2) | 68 008 (29.7) | <0.001 |
| Diuretics, n (%) | 59 022 (77.2) | 54 737 (23.9) | <0.001 |
| Beta blockers, n (%) | 67 377 (88.1) | 61 882 (27.0) | <0.001 |
| Calcium channel blockers, n (%) | 16 804 (22.0) | 44 029 (19.2) | <0.001 |
| Mineralocorticoid receptor antagonists, n (%) | 27 721 (36.3) | 4255 (1.9) | <0.001 |
| Antiplatelet therapy, n (%) | 37 776 (49.4) | 60 663 (26.4) | <0.001 |
| Anticoagulant therapy, n (%) | 34 936 (45.7) | 17 775 (7.7) | <0.001 |
| Insulin, n (%) | 9309 (12.2) | 9714 (4.2) | <0.001 |
| Oral glucose lowering therapy, n (%) | 10 733 (14.0) | 17 906 (7.8) | <0.001 |
| Lipid lowering therapy, n (%) | 38 270 (50.1) | 54 300 (23.7) | <0.001 |
| Digoxin, n (%) | 12 389 (16.2) | 3438 (1.5) | <0.001 |
| Nitrates, n (%) | 22 696 (29.7) | 13 108 (5.7) | <0.001 |
| Antiarrhythmic therapy, n (%) | 2694 (3.5) | 807 (0.4) | <0.001 |
| Socioeconomic characteristics | |||
| Family type living alone, n (%) | 36 985 (48.5) | 100 138 (43.7) | <0.001 |
| Children, n (%) | 63 815 (83.5) | 194 416 (84.8) | <0.001 |
| Education, n (%) | <0.001 | ||
| Compulsory school | 33 681 (45.0) | 91 255 (40.5) | |
| Secondary school | 29 013 (38.8) | 84 227 (37.4) | |
| University | 12 107 (16.2) | 49 671 (22.1) | |
| Income above median, n (%) | 34 588 (45.3) | 118 275 (51.6) | <0.001 |
Categorical variables are presented with number and percentage, continuous variables with median and interquartile range. BMI indicates body mass index; EF, ejection fraction; eGFR, estimated glomerular filtration rate; HF, heart failure; HR, heart rate; and IQR, interquartile range.
GFR estimation derived from Chronic Kidney Disease Epidemiology Collaboration formula.
Figure 1. Differences in comorbidities and treatments between patients with HF and control individuals without HF.
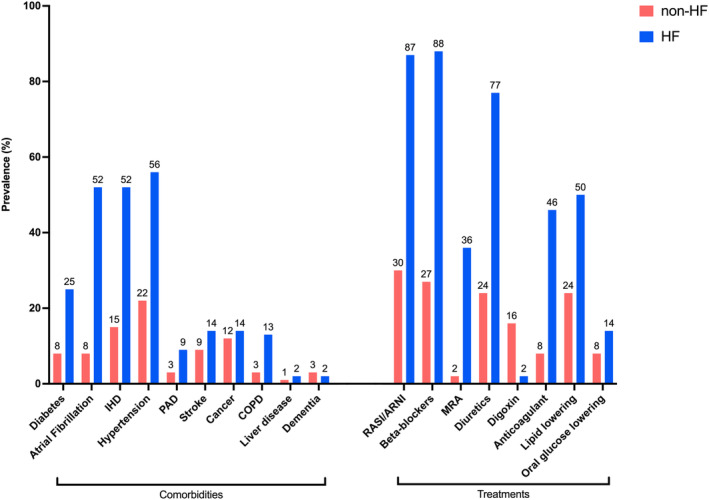
COPD indicates chronic obstructive pulmonary disease; HF, heart failure; IHD, ischemic heart disease; MRA, mineralocorticoid receptor antagonists; PAD, peripheral artery disease; and RASI/ARNI, renin‐angiotensin system inhibitor/angiotensin receptor neprilysin inhibitor.
With the only exception of dementia (1.7% in HF versus 3.3% in non‐HF), prevalence of noncardiovascular comorbidities was also higher in HF versus non‐HF, that is, renal failure was reported in 12.4% in the HF versus 1.8% in the cohort without HF, chronic obstructive pulmonary disease in 13.1% versus 3.0%, anemia in 14.2% versus 4.1%, cancer in 14.2% versus 11.9%, and liver disease in 2.0% versus 0.6%, respectively. Patients with HF were also more likely to have lower education level and income.
All the examined therapies, including also non‐HF drugs (ie, antiplatelet drugs, anticoagulants, oral glucose lowering drugs, and statins), were more likely prescribed to patients with HF.
Baseline Characteristics Across the Range of EF
Patients with HFpEF were more likely to be female (53.6%), whereas those with HFmrEF (61.7%) and HFrEF (71%) were more likely to be male. Patients with HFrEF were the youngest (median 73 years, interquartile range 64–81), whereas those with HFpEF were the oldest (median 80 years, interquartile range 72–85) (Table 2, Figure 2).
Table 2.
Baseline Characteristics of the HF Population Across the EF Categories
| Variable | HF with reduced EF | HF with mildly reduced EF | HF with preserved EF | P |
|---|---|---|---|---|
| No. | 40 893 | 17 395 | 18 165 | |
| Demographic/organizational characteristics | ||||
| Sex male, n (%) | 29 047 (71.0) | 10 733 (61.7) | 8434 (46.4) | <0.001 |
| Age, y, median (IQR) | 73 [64, 81] | 76 [68, 83] | 80 [72, 85] | <0.001 |
| Outpatient, n (%) | 22 347 (54.6) | 9899 (56.9) | 7626 (42.0) | <0.001 |
| Follow‐up referral HF nurse clinic, n (%) | 24 691 (63.7) | 9143 (55.6) | 6979 (41.6) | <0.001 |
| Follow‐up referral speciality, n (%) | <0.001 | |||
| Hospital | 29 757 (75.9) | 10 324 (62.1) | 8128 (47.6) | |
| Primary care | 8437 (21.5) | 5852 (35.2) | 8368 (49.1) | |
| Other | 1012 (2.6) | 444 (2.7) | 562 (3.3) | |
| Year of registration, n (%) | <0.001 | |||
| 2005–2010 | 15 174 (37.1) | 5971 (34.3) | 6369 (35.1) | |
| 2011–2015 | 15 075 (36.9) | 6355 (36.5) | 6826 (37.6) | |
| 2016–2018 | 10 644 (26.0) | 5069 (29.1) | 4970 (27.4) | |
| Clinical characteristics | ||||
| HF duration >6 months, n (%) | 18 326 (45.8) | 8458 (50.0) | 9394 (53.8) | <0.001 |
| New York Heart Association class, n (%) | <0.001 | |||
| I | 2753 (9.2) | 1872 (15.6) | 1556 (14.8) | |
| II | 14 160 (47.2) | 6436 (53.6) | 4827 (46.0) | |
| III | 11 962 (39.9) | 3451 (28.7) | 3770 (35.9) | |
| IV | 1100 (3.7) | 257 (2.1) | 336 (3.2) | |
| Systolic blood pressure, mm Hg, median (IQR) | 120 [110, 140] | 130 [117, 140] | 130 [120, 145] | <0.001 |
| Diastolic blood pressure, mm Hg, median (IQR) | 71 [65, 80] | 74 [65, 80] | 70 [65, 80] | <0.001 |
| HR, bpm, median (IQR) | 72 [64, 84] | 71 [62, 81] | 72 [63, 82] | <0.001 |
| HR >70 bpm, n (%) | 21 539 (54.1) | 8438 (50.1) | 9131 (52.2) | <0.001 |
| Left bundle‐branch block, n (%) | 8352 (24.5) | 2026 (14.1) | 1172 (7.8) | <0.001 |
| Laboratory measurements | ||||
| Hemoglobin, g/L, median (IQR) | 135 [122, 147] | 132 [120, 144] | 127 [115, 139] | <0.001 |
| eGFR (mL/min per 1.73 m2)*, median (IQR) | 64 [47, 82] | 63 [46, 80] | 57 [41, 75] | <0.001 |
| eGFR <60 mL/min per 1.73 m2, n (%) | 17 522 (43.3) | 7833 (45.7) | 9790 (55.0) | <0.001 |
| N‐terminal pro‐B‐type natriuretic peptide, pg/mL, median (IQR) | 2904 [1270, 6440] | 1932 [799, 4247] | 2020 [913, 4163] | <0.001 |
| Hyperkalemia, n (%) | 541 (1.3) | 226 (1.3) | 332 (1.8) | <0.001 |
| Hypokalemia, n (%) | 708 (1.7) | 361 (2.1) | 498 (2.7) | <0.001 |
| Medical history/comorbidities | ||||
| BMI, kg/m2, median (IQR) | 26 [23, 30] | 27 [24, 30] | 27 [24, 31.] | <0.001 |
| BMI ≥30, n (%) | 5875 (23.8) | 2958 (28.2) | 3259 (31.2) | <0.001 |
| Former/current smoker, n (%) | 19 172 (59.4) | 7243 (54.7) | 6349 (49.1) | <0.001 |
| Diabetes, n (%) | 10 125 (24.8) | 4212 (24.2) | 4921 (27.1) | <0.001 |
| Renal failure, n (%) | 4757 (11.6) | 2078 (11.9) | 2614 (14.4) | <0.001 |
| Atrial fibrillation, n (%) | 19 290 (47.2) | 9304 (53.5) | 10 999 (60.6) | <0.001 |
| Ischemic heart disease, n (%) | 22 076 (54.0) | 9569 (55.0) | 8411 (46.3) | <0.001 |
| Anemia, n (%) | 4790 (11.7) | 2508 (14.4) | 3568 (19.6) | <0.001 |
| Hypertension, n (%) | 20 401 (49.9) | 10 196 (58.6) | 12 313 (67.8) | <0.001 |
| Peripheral artery disease, n (%) | 3450 (8.4) | 1574 (9.0) | 1691 (9.3) | 0.001 |
| Percutaneous coronary intervention, n (%) | 5970 (14.6) | 2671 (15.4) | 1435 (7.9) | <0.001 |
| Coronary artery bypass graft, n (%) | 9723 (23.8) | 4198 (24.1) | 3093 (17.0) | <0.001 |
| Stroke, n (%) | 5491 (13.4) | 2486 (14.3) | 2982 (16.4) | <0.001 |
| Valvular disease, n (%) | 6806 (16.6) | 3660 (21.0) | 4907 (27.0) | <0.001 |
| Malignant cancer, n (%) | 5332 (13.0) | 2557 (14.7) | 2964 (16.3) | <0.001 |
| Chronic obstructive pulmonary disease, n (%) | 4788 (11.7) | 2253 (13.0) | 2961 (16.3) | <0.001 |
| Liver disease, n (%) | 849 (2.1) | 309 (1.8) | 394 (2.2) | 0.020 |
| Dementia, n (%) | 623 (1.5) | 263 (1.5) | 424 (2.3) | <0.001 |
| Severe bleeding, n (%) | 6120 (15.0) | 3208 (18.4) | 4158 (22.9) | <0.001 |
| Musculoskeletal/connective tissue diseases, n (%) | 11 162 (27.3) | 5574 (32.0) | 6880 (37.9) | <0.001 |
| Alcohol abuse, n (%) | 1502 (3.7) | 464 (2.7) | 464 (2.6) | <0.001 |
| Charlson comorbidity index | 2.0 [1.0, 4.0] | 2.0 [1.0, 4.0] | 3.0 [1.0, 4.0] | <0.001 |
| Treatments | ||||
| Devices (implantable cardioverter‐defibrillator/cardiac resynchronization therapy) | 2917 (7.1) | 422 (2.4) | 191 (1.1) | <0.001 |
| Renin‐angiotensin system/angiotensin receptor neprilysin inhibitors, n (%) | 37 606 (92.0) | 15 117 (86.9) | 13 931 (76.7) | <0.001 |
| Diuretics, n (%) | 31 563 (77.2) | 12 345 (71.0) | 15 114 (83.2) | <0.001 |
| Beta blockers, n (%) | 37 291 (91.2) | 15 137 (87.0) | 14 949 (82.3) | <0.001 |
| Calcium channel blockers, n (%) | 6706 (16.4) | 4137 (23.8) | 5961 (32.8) | <0.001 |
| Mineralocorticoid receptor antagonists, n (%) | 16 693 (40.8) | 5053 (29.0) | 5975 (32.9) | <0.001 |
| Antiplatelet therapy, n (%) | 21 157 (51.7) | 8718 (50.1) | 7901 (43.5) | <0.001 |
| Anticoagulant therapy, n (%) | 18 291 (44.7) | 7908 (45.5) | 8737 (48.1) | <0.001 |
| Insulin, n (%) | 4803 (11.7) | 2036 (11.7) | 2470 (13.6) | <0.001 |
| Oral glucose lowering therapy, n (%) | 5795 (14.2) | 2358 (13.6) | 2580 (14.2) | 0.113 |
| Lipid lowering therapy, n (%) | 21 198 (51.8) | 9086 (52.2) | 7986 (44.0) | <0.001 |
| Digoxin, n (%) | 6691 (16.4) | 2572 (14.8) | 3126 (17.2) | <0.001 |
| Nitrates, n (%) | 12 352 (30.2) | 5394 (31.0) | 4950 (27.3) | <0.001 |
| Antiarrhythmic therapy, n (%) | 1807 (4.4) | 480 (2.8) | 407 (2.2) | <0.001 |
| Socio‐economic characteristics | ||||
| Family type living alone, n (%) | 18 854 (46.2) | 8167 (47.0) | 9964 (54.9) | <0.001 |
| Children, n (%) | 33 655 (82.3) | 14 736 (84.7) | 15 424 (84.9) | <0.001 |
| Education, n (%) | <0.001 | |||
| Compulsory school | 17 414 (43.4) | 7524 (44.2) | 8743 (49.5) | |
| Secondary school | 16 115 (40.2) | 6617 (38.8) | 6281 (35.6) | |
| University | 6572 (16.4) | 2892 (17.0) | 2643 (15.0) | |
| Income above median, n (%) | 19 857 (48.7) | 7996 (46.0) | 6735 (37.1) | <0.001 |
Categorical variables are presented with number and percentage, continuous variables with median and interquartile range. BMI indicates body mass index; EF, ejection fraction; eGFR, estimated glomerular filtration rate; HF, heart failure; HR, heart rate; and IQR, interquartile range.
GFR estimation derived from Chronic Kidney Disease Epidemiology Collaboration formula.
Figure 2. Distribution of the main cardiovascular and noncardiovascular comorbidities and of HF and non‐HF treatments across the EF spectrum.
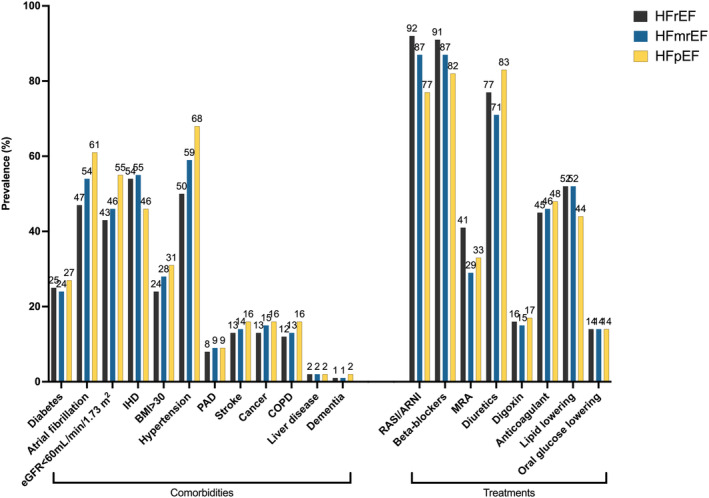
BMI indicates body mass index; COPD, chronic obstructive pulmonary disease; eGFR, estimated glomerular filtration rate; HF, heart failure; HFmrEF, mildly reduced ejection fraction heart failure; HFpEF, preserved ejection fraction heart failure; HFrEF, reduced ejection fraction heart failure; IHD, ischemic heart disease; MRA, mineralocorticoid receptor antagonists; PAD, peripheral artery disease; and RASI/ARNI, renin‐angiotensin system inhibitors/angiotensin receptor neprilysin inhibitors.
Across the EF spectrum, patients with HFpEF had longer history of HF, whereas patients with HFrEF had more severe HF (ie, higher New York Heart Association functional class and NT‐proBNP [N‐terminal pro–B‐type natriuretic peptide]). Compared with those with HFrEF and HFmrEF, patients with HFpEF were more likely to live alone rather than cohabitate, to have lower education level and income, and to be inpatients at the time of registration in SwedeHF and less likely to be followed in specialized care and to be referred to HF nurse‐led clinics.
With the exception of ischemic heart disease, the spectrum of comorbidities, including diabetes, impaired renal function, anemia, atrial fibrillation, history of stroke, and noncardiovascular comorbidities such as chronic obstructive pulmonary disease, cancer, and dementia, was more prevalent in HFpEF and consequently the Charlson comorbidity index 10 was highest in this HF subtype. HFmrEF was more similar to HFrEF in terms of comorbidity burden (eg, renal function, diabetes, anemia), and in particular for the prevalence of ischemic heart disease, but more similar to HFpEF for NT‐proBNP levels and New York Heart Association class.
Regarding treatments, patients with HFrEF were more likely to receive RASI/ARNI inhibitors, beta blockers, mineralocorticoid receptor antagonists, antiplatelet therapy, and statins. Use of RASI/ARNI and diuretics in HFmrEF was more similar to HFrEF. The use of oral glucose lowering drugs was similar across the EF spectrum. The use of device therapy (eg, implantable cardioverter‐defibrillator or cardiac resynchronization therapy) was more likely in HFrEF. As shown in Figure 3, a slight increase in the use of RASI/ARNI over time was observed across the entire EF spectrum. For beta blockers, treatment use remained stable in patients with HFrEF and HFpEF and slightly increased in patients with HFmrEF. Finally, the use of mineralocorticoid receptor antagonists decreased up to 2012 and then increased thereafter, with a larger increase in HFrEF compared with HFmrEF and HFpEF.
Figure 3. Temporal trends in the use of HF medications across the EF spectrum.
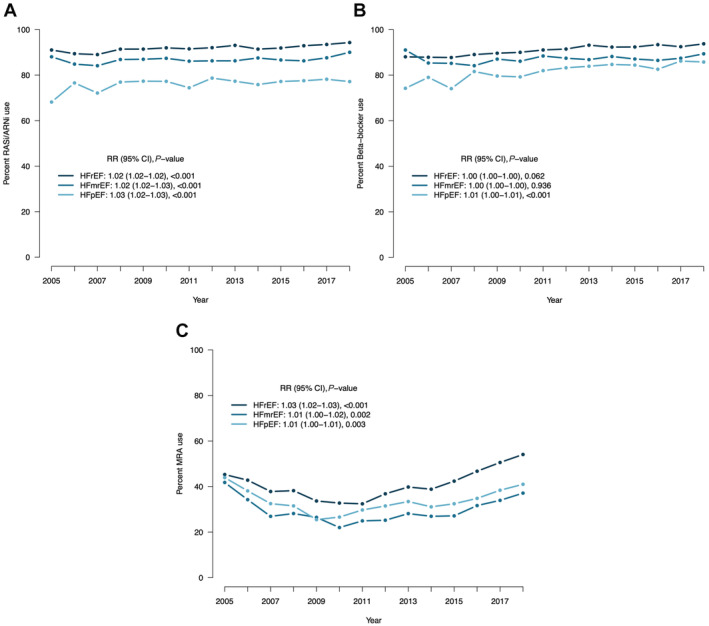
EF indicates ejection fraction; HFmrEF, mildly reduced ejection fraction heart failure; HFpEF, preserved ejection fraction heart failure; HFrEF, reduced ejection fraction heart failure; RASI/ARNI, renin‐angiotensin system inhibitors/angiotensin receptor neprilysin inhibitors; and RR, relative risk.
Table S3 reports the comparison between each EF category and respective control subjects without HF. The higher comorbidity burden and the larger use of HF and non‐HF drugs in the population with HF versus non‐HF were consistent across the range of EF.
Study Outcomes in the Population With HF Versus Non‐HF
The median follow‐up time was 4.0 (2.0–7.3) years. Compared with non‐HF, HF was characterized by higher incidence of first (hazard ratio [HR], 2.86 [95% CI, 2.83–2.89]) and repeated (incidence rate ratio [IRR], 3.93 [95% CI. 3.89–3.98]) all‐cause hospitalizations, first (HR, 5.47 [95% CI, 5.39–5.54]) and repeated (IRR, 10.4 [95% CI, 10.3–10.6]) cardiovascular hospitalizations, first (HR, 2.03 [95% CI, 2.01–20.5]) and repeated (IRR, 2.44 [95% CI, 2.41–2.47]) noncardiovascular hospitalizations, first (HR, 2.95 [95% CI, 2.92–2.97]) and repeated (IRR, 2.26 [95% CI, 2.24–2.28]) all‐cause outpatient visits, and repeated emergency visits (IRR, 2.38 [95% CI, 2.34–2.43]). Patients with HF also more likely required coronary revascularization procedures after diagnosis (IRR, 2.64 [95% CI, 2.54–2.74]) (Figure 4, Tables S4 and S5).
Figure 4. Differences in outcomes between patients with HF and control individuals without HF.

HF indicates heart failure; and HHF, hospitalization for heart failure. * ×10.
The average in‐hospital LOS for any cause per follow‐up year was 7.1 days in subjects with HF versus 2.1 days in subjects without HF. Patients with HF had 2.9 days of average in‐hospital LOS for cardiovascular causes per follow‐up year versus 0.4 in subjects without HF. The majority of in‐hospital stay was owing to noncardiovascular causes in both patients with HF (4.2 days per follow‐up year) and patients without HF (1.7 days per follow‐up year).
The risk of all‐cause (HR, 2.53 [95% CI, 2.50–2.56]), cardiovascular (HR, 4.67 [95% CI, 4.59–4.76]), and noncardiovascular (HR, 1.49 [95% CI, 1.46–1.52]) death was higher in the population with HF compared with non‐HF.
Study Outcomes Across the Range of EF
As summarized in Figure 5 and Table S6, within the population with HF the risk of outcomes varied according to the EF subtype. Patients with HFrEF reported the highest, patients with HFpEF intermediate, and patients with HFmrEF the lowest risk of first and repeated HF hospitalizations, with a median survival free from first HF hospitalization of 10.3 years in the cohort with HFrEF (Figure S1). For first all‐cause hospitalizations and first and repeated noncardiovascular hospitalization, patients with HFpEF were at higher risk, those with HFrEF at lowest risk, and those with HFmrEF had intermediate risk but more similar to HFrEF (Figures S2 and S3). Median survival free from all‐cause and noncardiovascular hospitalization was consistently shorter in HFpEF (0.7 and 1.6 years, respectively) compared with HFrEF (0.8 and 2.9 years, respectively) and HFmrEF (0.9 and 2.2 years, respectively). The risk of repeated all‐cause hospitalization was highest in HFpEF and similar in HFmrEF and HFrEF (Figure S2). The risk of first cardiovascular hospitalization was slightly higher in HFpEF and lower in HFmrEF compared with HFrEF, with a similar median survival free from cardiovascular hospitalization between HFrEF (2.4 years) and HFpEF (2.5 years) and slightly longer in HFmrEF (3.2 years), whereas the risk of repeated cardiovascular hospitalizations was similar in HFrEF versus HFpEF and lowest in HFmrEF (Figure S4). The risk of first all‐cause outpatient visit was highest in HFrEF versus HFpEF and HFmrEF, whereas patients with HFpEF had higher risk of repeated all‐cause and emergency visits compared with HFrEF, with HFmrEF being similar to HFrEF for the risk of repeated all‐cause and emergency visits (Figure S5). Incidence rates of revascularization procedures were higher in HFrEF and HFmrEF compared with HFpEF (Table S6).
Figure 5. Incidence of the study outcomes in the population with HF across the EF categories.
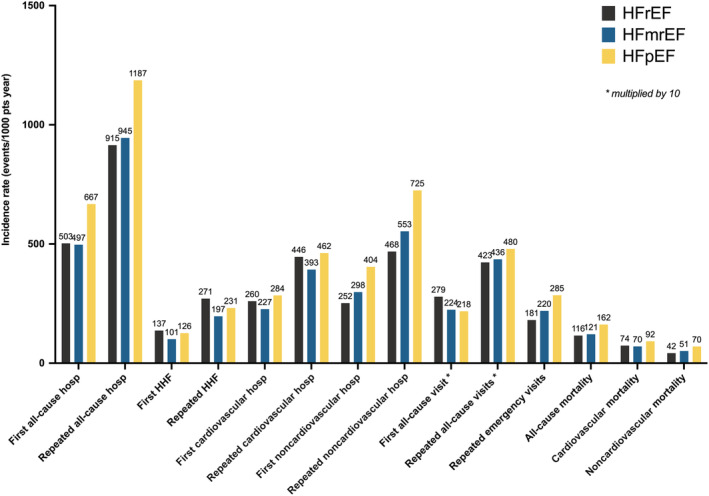
EF indicates ejection fraction; HF, heart failure; HFmrEF, mildly reduced ejection fraction heart failure; HFpEF, preserved ejection fraction heart failure; HFrEF, reduced ejection fraction heart failure; and HHF, hospitalization for heart failure. * ×10.
The risk of cardiovascular death was higher in HFpEF and lower in HFmrEF compared with HFrEF, whereas the risk of all‐cause and noncardiovascular death was the highest in HFpEF and higher in HFmrEF versus HFrEF (Figure S6). Median survival was shorter in HFpEF (4.2 years), compared with HFmrEF (5.8 years) and HFrEF (6.1 years). Patients with HFpEF had the longest average in‐hospital LOS for any cause, cardiovascular causes, and noncardiovascular causes (Table S5).
The comparison in risk of outcomes between each EF subtype and its matched non‐HF population was reported in Table S7 and Figures S1–S6. The higher risk in outcomes in HF versus non‐HF was consistent regardless of EF. Patients with HF presented shorter median overall survival (5.5 versus >10 years) and shorter survival free from all‐cause (0.8 versus 4.4 years), cardiovascular (2.6 versus >10 years) and noncardiovascular hospitalization (2.3 versus 5.7 years) compared with subjects without HF in the overall population and also across the entire EF spectrum. Patients with an ischemic cause of HF had higher incidence of the study outcomes compared with patients who were nonischemic (Table S8).
DISCUSSION
HF is progressively becoming the most demanding disease for the worldwide health care systems. In this study by comparing a large contemporary nationwide cohort of ≈76 000 patients with HF versus a control population of >200 000 individuals without HF, we showed that (1) the prevalence of comorbidities that burden HF is extremely high compared with non‐HF and involves both cardiovascular and noncardiovascular comorbidities; (2) the risk of cardiovascular and noncardiovascular mortality, and hospitalizations are much higher in HF versus non‐HF; (3) HfpEF, HfmrEF, and HFrEF show different profiles, with ischemic heart disease more prevalent in HFrEF and HFmrEF compared with HFpEF, patients with HFrEF with the most severe HF, and HFpEF characterized by older age and higher comorbidity burden; and (4) there are differences in the risk of HF‐related and unrelated events across the EF range, with patients with HFrEF more exposed to HF hospitalizations and patients with HFpEF at higher risk of all‐cause, cardiovascular and, in particular, noncardiovascular hospitalizations and mortality.
Differences in Patient Characteristics and Outcomes in HF Versus Non‐HF and Their Impact on the Health Care System
Previous studies suggested that ~80% of patients with HF have ≥3 coexisting comorbidities, and there is an increasing trend over time in the overall amount of cardiovascular and noncardiovascular comorbidities. 1 , 11 By comparing patients with versus without HF, we showed that the comorbidity burden is much higher in the presence of HF. For instance, patients with HF had a 3‐fold higher prevalence of ischemic heart disease and diabetes, 5‐ to 6‐fold higher prevalence of atrial fibrillation and obesity, and 6‐ to 7‐fold higher prevalence of renal failure. The increasing number of comorbidities is likely to be influenced by several factors, such as population aging, enhanced screening and diagnostics, physician awareness, and changes in risk factors over time. 1 Cardiac comorbidities have a well‐known unfavorable effect on the outcome in HF, 12 but the growing prevalence of noncardiac comorbidities has been shown to similarly influence prognosis. 13 Multimorbidity increases the complexity of the management of patients with HF and has obvious consequences in terms of health care system management and costs. Each comorbidity leads to a considerable increase in need of resources. The presence of HF doubles the annual costs of care in patients with diabetes, 14 and impaired renal failure is one of the major determinant of increasing costs in patients with HF. 15 In Spain, the average expenditure per patient with HF was €1147/year in patients with 1 comorbidity and €16 806/year in patients with >9 comorbidities. 16 Similar findings have been reported in Sweden. 17 Consistently with the higher comorbidity burden in HF versus non‐HF, in our analysis we showed that patients with HF were also more likely treated with non‐HF drugs, which further contributes to increasing costs.
The complexity of the population with HF has massive consequences in terms of prognosis. We observed dramatically higher mortality and risk of hospitalizations in patients with versus without HF, which was not only limited to HF‐ and cardiovascular‐related events but also to noncardiovascular outcomes. The risk was ~3‐fold higher for first and repeated all‐cause hospitalizations and 2‐fold higher for all‐cause mortality in HF versus non‐HF. The overall median survival was >6 years shorter in patients with HF versus individuals without HF and the survival free from all‐cause hospitalization 3 to 4 years shorter according to HF phenotype. However, we could also identify a higher risk of first and repeated noncardiovascular hospitalizations and, to a lesser extent, of noncardiovascular death in HF versus non‐HF, which might mirror the higher burden of noncardiovascular comorbidities in HF. Average in‐hospital LOS for cardiovascular and noncardiovascular reasons was also >3‐fold higher in HF versus non‐HF.
The growing number of hospitalizations characterizing the HF course determines an exponential increase in the health care expenditures, with the increasing number of HF hospitalizations over time being also a predictor of mortality. 18 In Sweden, the total amount of all‐cause secondary care costs in the first year after HF diagnosis was €12 890/patient/year. 17 The cardiovascular inpatient care accounted for the largest part of the total secondary care costs (€11 578/patient/year) and exhibited a strong decline after the first year from diagnosis. 17 However, this declining trend in costs is limited to the individual longitudinal trajectory. At a population level, costs are still rising over time because of growing prevalence of HF, higher burden of comorbidities, longer survival linked with advances in medical care, and the consequent increasing number of repeated HF and non‐HF hospitalizations. 17 , 19 The overall costs attributed to HF have been estimated to account for 1% to 2% of the total health care expenditure, reaching 7% in Spain. 16 , 20 Importantly, in accordance with the increasing weight of noncardiovascular events, HF‐specific costs accounted for 69% of the total costs in the first year but only 49% and 46% in the second and third year after the diagnosis. 17
Differences in Patient Characteristics and Outcomes Across the EF Subtypes
We confirmed that the 3 EF subtypes largely vary in demographic, clinical, and socioeconomic characteristics, with consequent differences in prognosis. These aspects are worth critical assessment as they might determine a different impact of these phenotypes on costs and allocation of resources. As previously reported, patients with HFpEF were older and had higher prevalence of cardiovascular and noncardiovascular comorbidities compared with patients with HFrEF and HFmrEF. 21 They were also less likely referred to specialized care and to HF nurse‐led clinics. The use of skilled nursing facilities and a multidisciplinary follow‐up in specialty care could aid to reduce the global costs linked with HFpEF by reducing the need of a hospital admission for HF. 22
We also observed different distribution of HF‐related and unrelated events across the EF spectrum. The risk of HF hospitalizations was higher in HFrEF, whereas HFpEF was characterized by more all‐cause and noncardiovascular hospitalizations and higher unadjusted risk of all‐cause, cardiovascular, and noncardiovascular death, which might reflect the lack of evidence‐based therapies and the overall higher comorbidity burden in HFpEF. The larger increase in costs linked with HFpEF versus HFmrEF and HFrEF might be explained by the higher LOS, risk of all‐cause hospitalization, disease complexity, and comorbidity burden in HFpEF, as we showed in our analysis. 17 , 23 , 24 In a previous analysis focusing on HFpEF, noncardiovascular hospitalizations accounted for ~40% of the overall hospitalization‐related costs (ie, € 3618/patient/year). 25 Annual costs for emergency noncardiovascular admissions have been reported to be higher in HFpEF versus HFrEF, 26 and in United States the total medication cost per patient was higher for HFpEF ($495/month/patient) versus HFrEF ($429/month/patient), although the costs related to HF medications were higher in HFrEF ($90/month/patient) versus HFpEF ($87/month/patient). 27 Costs specifically linked with HF hospitalizations have been reported to be highest in HFrEF, which is likely explained by the larger use of invasive treatments and devices in HFrEF compared with HFpEF/HFmrEF. 16 , 28 The use of HF medications showed only minimal variation over time for RASI/ARNI and beta blockers, whereas after an initial decrease the use of mineralocorticoid receptor antagonists progressively increased from 2012 to the end of follow‐up, particularly in HFrEF, probably related to the extension of the indications reported in the 2012 European Society of Cardiology Guidelines.
In the process of resource allocation, our observations might aid the identification of the better targets of intervention that could not necessarily be the same across the EF spectrum. For instance, actions aiming to improve the management of noncardiovascular comorbidities are more likely to play a role in the reduction of costs in HFpEF versus HFrEF, whereas optimizing the use of guideline‐recommended therapies might be the key in HFrEF/HFmrEF. 3 Use of drugs significantly decreasing the risk of HF hospitalizations/urgent visits may, thus, prove convenient in terms of economical net benefit. Post hoc analyses from trials on HFrEF supported their cost‐effectiveness both in the European and US health care systems. 29 , 30 In HFpEF/HFmrEF the sodium‐glucose cotransporter‐2 inhibitor empagliflozin has recently been shown to reduce the risk of HF hospitalization/cardiovascular death, 31 and use of dapagliflozin in the same setting is currently tested in the DELIVER (Dapagliflozin Evaluation to Improve the Lives of Patients With Preserved Ejection Fraction Heart Failure) trial (NCT03619213). The eligibility to treatments with novel drugs in the real‐world scenario has been recently defined in the SwedeHF registry and demonstrated discrete variability based on the adopted criteria (randomized clinical trial criteria versus pragmatic clinical or label criteria). For instance, patients eligible for sacubitril/valsartan were 63% and 52% in the pragmatic scenario with, respectively, EF <50% and ≥40%, but decreased to 32% and 22%, respectively, according to randomized clinical trial criteria. 32 Eligibility to sodium‐glucose cotransporter‐2 inhibitors using trial, pragmatic, and label scenarios ranged between 31% and 81% in HFrEF and between 30% and 75% in HFmrEF/HFpEF. 33
Limitations
SwedeHF coverage is not complete, and thus selection bias may be a limitation. EF is recorded in SwedeHF as a categorical variable, with HFmrEF defined as EF=40% to 49%, and therefore we could not adopt the HFmrEF definition recently proposed by the European Society of Cardiology guidelines (ie, 41–49%). 3 Comorbidities were derived from the National Patient Registry, and thus we cannot exclude that all the diagnoses were correctly captured. We were not able to provide a precise quantification of the economic impact of HF as no direct cost estimation was available.
CONCLUSIONS
In this large nationwide study, HF was characterized by a demanding profile that did not involve only cardiovascular aspects, that is, comorbidities and treatments. Patients with HF versus non‐HF had not only a 5‐ to 10‐fold higher risk of cardiovascular events but also a 2‐ to 4‐fold higher occurrence of all‐cause events, a 1.5‐ to 2.5‐ fold higher incidence of noncardiovascular events, together with a nearly 4 times longer length of in‐hospital stay. The high burden of hospitalizations, the large amount of coexisting comorbidities. and the large requirement of multiple therapies explain the exponential increase in costs linked with HF, with a dramatically growing burden on the health care system. Different strategies might be required to reduce costs in HFpEF versus HFrEF.
Sources of Funding
This study was supported by a grant from Boehringer Ingelheim. This funding source had no role in the design of this study, execution, analyses, interpretation of the data, or decision to submit results.
Disclosures
Dr Stolfo reports personal fees from Novartis, Merck, GSK, and Acceleron outside the submitted work. Dr Lund reports personal fees from Merck, grants and personal fees from Vifor‐Fresenius, grants and personal fees from AstraZeneca, personal fees from Bayer, grants from Boston Scientific, personal fees from Pharmacosmos, personal fees from Abbott, personal fees from Medscape, personal fees from Myokardia, grants and personal fees from Boehringer Ingelheim, grants and personal fees from Novartis, personal fees from Sanofi, personal fees from Lexicon, personal fees from Radcliffe cardiology, outside the submitted work. Dr Hage reports consulting fees from Novartis, Roche Diagnostics, and AnaCardio and speaker and honoraria from MSD and Novartis. Supported by the Swedish Research Council [grant 20 180 899] outside the submitted work. Dr Sinagra reports consulting fees from Novartis, Impulse Dynamics, and Biotronik and speaker and honoraria from Novartis, Bayer, Astrazeneca, Boston Scientific, Vifor Pharma, Menarini, and Akcea Therapeutics outside the submitted work. Dr Dahlström reports grants from AstraZeneca, Vifor Pharma, Pfizer, Boehringer Ingelheim, Boston Scientific, and Roche Diagnostics and honoraria/consultancies from Amgen, Pfizer, and AstraZeneca outside the submitted work. Dr Savarese received financial support as a grant from Boehringer Ingelheim for performing this study, reports grants and personal fees from Vifor, personal fees from Societa´ Prodotti Antibiotici, grants and personal fees from AstraZeneca, personal fees from Roche, personal fees from Servier, grants from Novartis, personal fees from GENESIS, personal fees from Cytokinetics, personal fees from Medtronic, grants from Boston Scientific, grants from PHARMACOSMOS, grants from Merck, and grants from Bayer outside the submitted work. L. Benson has nothing to disclose.
Supporting information
Tables S1–S8
Figures S1–S6
Acknowledgments
None.
Presented in part at Heart Failure 2022 and the World Congress on Acute Heart Failure in Madrid, Spain, May 21–24, 2022, and published in abstract form [European Journal of Heart Failure. 2022:24;3–282 or https://doi.org/10.1002/ejhf.2569].
Supplemental Material is available at https://www.ahajournals.org/doi/suppl/10.1161/JAHA.122.026708
For Sources of Funding and Disclosures, see page 13.
References
- 1. Conrad N, Judge A, Tran J, Mohseni H, Hedgecott D, Crespillo AP, Allison M, Hemingway H, Cleland JG, McMurray JJV, et al. Temporal trends and patterns in heart failure incidence: a population‐based study of 4 million individuals. Lancet. 2018;391:572–580. doi: 10.1016/S0140-6736(17)32520-5 [DOI] [PMC free article] [PubMed] [Google Scholar]
- 2. Thorvaldsen T, Benson L, Dahlstrom U, Edner M, Lund LH. Use of evidence‐based therapy and survival in heart failure in Sweden 2003‐2012. Eur J Heart Fail. 2016;18:503–511. doi: 10.1002/ejhf.496 [DOI] [PubMed] [Google Scholar]
- 3. McDonagh TA, Metra M, Adamo M, Gardner RS, Baumbach A, Bohm M, Burri H, Butler J, Celutkiene J, Chioncel O, et al. 2021 ESC guidelines for the diagnosis and treatment of acute and chronic heart failure. Eur Heart J. 2021;42:3599–3726. doi: 10.1093/eurheartj/ehab368 [DOI] [PubMed] [Google Scholar]
- 4. Moliner P, Lupon J, de Antonio M, Domingo M, Santiago‐Vacas E, Zamora E, Cediel G, Santesmases J, Diez‐Quevedo C, Troya MI, et al. Trends in modes of death in heart failure over the last two decades: less sudden death but cancer deaths on the rise. Eur J Heart Fail. 2019;21:1259–1266. doi: 10.1002/ejhf.1569 [DOI] [PubMed] [Google Scholar]
- 5. Dunlay SM, Redfield MM, Weston SA, Therneau TM, Hall Long K, Shah ND, Roger VL. Hospitalizations after heart failure diagnosis a community perspective. J Am Coll Cardiol. 2009;54:1695–1702. doi: 10.1016/j.jacc.2009.08.019 [DOI] [PMC free article] [PubMed] [Google Scholar]
- 6. Dharmarajan K, Hsieh AF, Lin Z, Bueno H, Ross JS, Horwitz LI, Barreto‐Filho JA, Kim N, Bernheim SM, Suter LG, et al. Diagnoses and timing of 30‐day readmissions after hospitalization for heart failure, acute myocardial infarction, or pneumonia. JAMA. 2013;309:355–363. doi: 10.1001/jama.2012.216476 [DOI] [PMC free article] [PubMed] [Google Scholar]
- 7. Chang PP, Wruck LM, Shahar E, Rossi JS, Loehr LR, Russell SD, Agarwal SK, Konety SH, Rodriguez CJ, Rosamond WD. Trends in hospitalizations and survival of acute decompensated heart failure in four US communities (2005–2014): ARIC study community surveillance. Circulation. 2018;138:12–24. doi: 10.1161/CIRCULATIONAHA.117.027551 [DOI] [PMC free article] [PubMed] [Google Scholar]
- 8. Cook C, Cole G, Asaria P, Jabbour R, Francis DP. The annual global economic burden of heart failure. Int J Cardiol. 2014;171:368–376. doi: 10.1016/j.ijcard.2013.12.028 [DOI] [PubMed] [Google Scholar]
- 9. Savarese G, Vasko P, Jonsson A, Edner M, Dahlstrom U, Lund LH. The Swedish heart failure registry: a living, ongoing quality assurance and research in heart failure. Ups J Med Sci. 2019;124:65–69. doi: 10.1080/03009734.2018.1490831 [DOI] [PMC free article] [PubMed] [Google Scholar]
- 10. Ludvigsson JF, Appelros P, Askling J, Byberg L, Carrero JJ, Ekstrom AM, Ekstrom M, Smedby KE, Hagstrom H, James S, et al. Adaptation of the Charlson comorbidity index for register‐based research in Sweden. Clin Epidemiol. 2021;13:21–41. doi: 10.2147/CLEP.S282475 [DOI] [PMC free article] [PubMed] [Google Scholar]
- 11. Pandey A, Vaduganathan M, Arora S, Qamar A, Mentz RJ, Shah SJ, Chang PP, Russell SD, Rosamond WD, Caughey MC. Temporal trends in prevalence and prognostic implications of comorbidities among patients with acute decompensated heart failure: the ARIC study community surveillance. Circulation. 2020;142:230–243. doi: 10.1161/CIRCULATIONAHA.120.047019 [DOI] [PMC free article] [PubMed] [Google Scholar]
- 12. Mountantonakis SE, Grau‐Sepulveda MV, Bhatt DL, Hernandez AF, Peterson ED, Fonarow GC. Presence of atrial fibrillation is independently associated with adverse outcomes in patients hospitalized with heart failure: an analysis of get with the guidelines‐heart failure. Circ Heart Fail. 2012;5:191–201. doi: 10.1161/CIRCHEARTFAILURE.111.965681 [DOI] [PubMed] [Google Scholar]
- 13. Sharma A, Zhao X, Hammill BG, Hernandez AF, Fonarow GC, Felker GM, Yancy CW, Heidenreich PA, Ezekowitz JA, DeVore AD. Trends in noncardiovascular comorbidities among patients hospitalized for heart failure: insights from the Get With The Guidelines‐Heart Failure Registry. Circ Heart Fail. 2018;11:e004646. doi: 10.1161/CIRCHEARTFAILURE.117.004646 [DOI] [PubMed] [Google Scholar]
- 14. Einarson TR, Acs A, Ludwig C, Panton UH. Economic burden of cardiovascular disease in type 2 diabetes: a systematic review. Value Health. 2018;21:881–890. doi: 10.1016/j.jval.2017.12.019 [DOI] [PubMed] [Google Scholar]
- 15. Wang V, Vilme H, Maciejewski ML, Boulware LE. The economic burden of chronic kidney disease and end‐stage renal disease. Semin Nephrol. 2016;36:319–330. doi: 10.1016/j.semnephrol.2016.05.008 [DOI] [PubMed] [Google Scholar]
- 16. Farre N, Vela E, Cleries M, Bustins M, Cainzos‐Achirica M, Enjuanes C, Moliner P, Ruiz S, Verdu‐Rotellar JM, Comin‐Colet J. Medical resource use and expenditure in patients with chronic heart failure: a population‐based analysis of 88 195 patients. Eur J Heart Fail. 2016;18:1132–1140. doi: 10.1002/ejhf.549 [DOI] [PubMed] [Google Scholar]
- 17. Boman K, Lindmark K, Stalhammar J, Olofsson M, Costa‐Scharplatz M, Fonseca AF, Johansson S, Heller V, Tornblom M, Wikstrom G. Healthcare resource utilisation and costs associated with a heart failure diagnosis: a retrospective, population‐based cohort study in Sweden. BMJ Open. 2021;11:e053806. doi: 10.1136/bmjopen-2021-053806 [DOI] [PMC free article] [PubMed] [Google Scholar]
- 18. Setoguchi S, Stevenson LW, Schneeweiss S. Repeated hospitalizations predict mortality in the community population with heart failure. Am Heart J. 2007;154:260–266. doi: 10.1016/j.ahj.2007.01.041 [DOI] [PubMed] [Google Scholar]
- 19. Lindmark K, Boman K, Olofsson M, Tornblom M, Levine A, Castelo‐Branco A, Schlienger R, Bruce Wirta S, Stalhammar J, Wikstrom G. Epidemiology of heart failure and trends in diagnostic work‐up: a retrospective, population‐based cohort study in Sweden. Clin Epidemiol. 2019;11:231–244. doi: 10.2147/CLEP.S170873 [DOI] [PMC free article] [PubMed] [Google Scholar]
- 20. Malek M. Health economics of heart failure. Heart. 1999;82(Suppl 4):IV11–IV13. doi: 10.1136/hrt.82.2008.iv11 [DOI] [PMC free article] [PubMed] [Google Scholar]
- 21. Savarese G, Stolfo D, Sinagra G, Lund LH. Heart failure with mid‐range or mildly reduced ejection fraction. Nat Rev Cardiol. 2021;19:100–116. doi: 10.1038/s41569-021-00605-5 [DOI] [PMC free article] [PubMed] [Google Scholar]
- 22. Rice H, Say R, Betihavas V. The effect of nurse‐led education on hospitalisation, readmission, quality of life and cost in adults with heart failure. A systematic review. Patient Educ Couns. 2018;101:363–374. doi: 10.1016/j.pec.2017.10.002 [DOI] [PubMed] [Google Scholar]
- 23. Clark H, Rana R, Gow J, Pearson M, van der Touw T, Smart N. Hospitalisation costs associated with heart failure with preserved ejection fraction (HFpEF): a systematic review. Heart Fail Rev. 2021;27:559–572. doi: 10.1007/s10741-021-10097-7 [DOI] [PubMed] [Google Scholar]
- 24. Urbich M, Globe G, Pantiri K, Heisen M, Bennison C, Wirtz HS, Di Tanna GL. A systematic review of medical costs associated with heart failure in the USA (2014–2020). Pharmacoeconomics. 2020;38:1219–1236. doi: 10.1007/s40273-020-00952-0 [DOI] [PMC free article] [PubMed] [Google Scholar]
- 25. Stalhammar J, Stern L, Linder R, Sherman S, Parikh R, Ariely R, Deschaseaux C, Wikstrom G. The burden of preserved ejection fraction heart failure in a real‐world Swedish patient population. J Med Econ. 2014;17:43–51. doi: 10.3111/13696998.2013.848808 [DOI] [PubMed] [Google Scholar]
- 26. Murphy TM, Waterhouse DF, James S, Casey C, Fitzgerald E, O'Connell E, Watson C, Gallagher J, Ledwidge M, McDonald K. A comparison of HFrEF vs HFpEF's clinical workload and cost in the first year following hospitalization and enrollment in a disease management program. Int J Cardiol. 2017;232:330–335. doi: 10.1016/j.ijcard.2016.12.057 [DOI] [PubMed] [Google Scholar]
- 27. Lam CSP, Wood R, Vaduganathan M, Bueno H, Chin A, Luporini Saraiva G, Sorstadius E, Tritton T, Thomas J, Qin L. Contemporary economic burden in a real‐world heart failure population with commercial and Medicare supplemental plans. Clin Cardiol. 2021;44:646–655. doi: 10.1002/clc.23585 [DOI] [PMC free article] [PubMed] [Google Scholar]
- 28. Olchanski N, Vest AR, Cohen JT, Neumann PJ, DeNofrio D. Cost comparison across heart failure patients with reduced and preserved ejection fractions: analyses of inpatient decompensated heart failure admissions. Int J Cardiol. 2018;261:103–108. doi: 10.1016/j.ijcard.2018.03.024 [DOI] [PubMed] [Google Scholar]
- 29. McEwan P, Darlington O, McMurray JJV, Jhund PS, Docherty KF, Bohm M, Petrie MC, Bergenheim K, Qin L. Cost‐effectiveness of dapagliflozin as a treatment for heart failure with reduced ejection fraction: a multinational health‐economic analysis of DAPA‐HF. Eur J Heart Fail. 2020;22:2147–2156. doi: 10.1002/ejhf.1978 [DOI] [PMC free article] [PubMed] [Google Scholar]
- 30. King JB, Shah RU, Bress AP, Nelson RE, Bellows BK. Cost‐effectiveness of Sacubitril‐valsartan combination therapy compared with Enalapril for the treatment of heart failure with reduced ejection fraction. JACC Heart Fail. 2016;4:392–402. doi: 10.1016/j.jchf.2016.02.007 [DOI] [PubMed] [Google Scholar]
- 31. Anker SD, Butler J, Filippatos G, Ferreira JP, Bocchi E, Bohm M, Brunner‐La Rocca HP, Choi DJ, Chopra V, Chuquiure‐Valenzuela E, et al. Empagliflozin in heart failure with a preserved ejection fraction. N Engl J Med. 2021;385:1451–1461. doi: 10.1056/NEJMoa2107038 [DOI] [PubMed] [Google Scholar]
- 32. Savarese G, Hage C, Benson L, Schrage B, Thorvaldsen T, Lundberg A, Fudim M, Linde C, Dahlstrom U, Rosano GMC, et al. Eligibility for sacubitril/valsartan in heart failure across the ejection fraction spectrum: real‐world data from the Swedish Heart Failure Registry. J Intern Med. 2021;289:369–384. doi: 10.1111/joim.13165 [DOI] [PMC free article] [PubMed] [Google Scholar]
- 33. Thorvaldsen T, Ferrannini G, Mellbin L, Benson L, Cosentino F, McMurray JJV, Dahlstrom U, Lund LH, Savarese G. Eligibility for dapagliflozin and empagliflozin in a real‐world heart failure population. J Card Fail. 2022;28:1050–1062. doi: 10.1016/j.cardfail.2022.04.011 [DOI] [PubMed] [Google Scholar]
Associated Data
This section collects any data citations, data availability statements, or supplementary materials included in this article.
Supplementary Materials
Tables S1–S8
Figures S1–S6