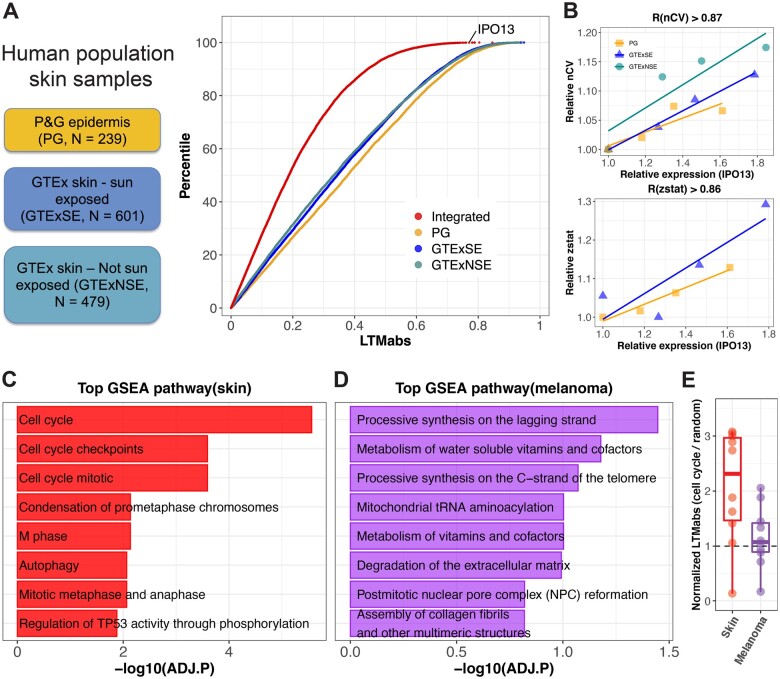
Fig. 2.
Circadian clock-coupled pathways screened by LTM in human population skin samples. (A) LTM is used to screen three groups of human population skin samples, including human epidermis samples from 239 subjects (PG), sun-exposed whole skin samples from 601 subjects (GTExSE) and not sun-exposed whole skin samples from 479 subjects (GTExNSE). The distribution of LTMabs for PG, GTExSE and GTExNSE is indicated by different color points. ‘Integrated’ represents LTMabs of a gene by integrating three datasets. A gene with a large LTMabs (e.g. IPO13) means its expression level is strongly correlated with clock strength in skin. (B) The expression level of IPO13 is linearly correlated with mean nCV of clock genes and Mantel’s zstat in skin datasets. (C) Top eight enriched pathways from GSEA analysis on all genes ranked by integrated LTMabs of three healthy skin datasets. (D) Top eight enriched pathways from GSEA analysis on all genes ranked by LTMabs of SKCM in TCGA database. (E) Cell-cycle regulators show lower LTMabs values in human skin tumors than healthy skin. Each point represents a cell-cycle gene listed in Supplementary Figure S2A. Only those cell-cycle genes detected in both healthy skin and melanoma datasets were used. Y-axis is the LTMabs value of each cell-cycle gene normalized by the LTMabs value of randomly selected genes

