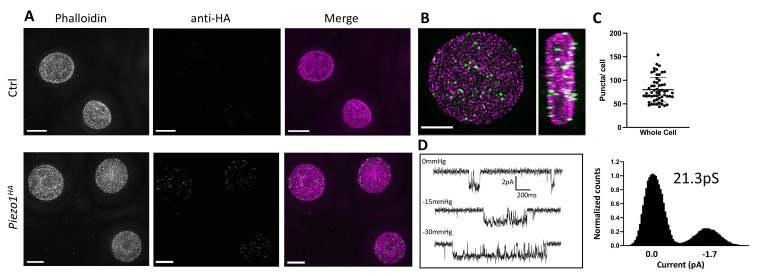
Figure 1. Detection of Piezo1 in RBCs.
(A) Reconstructed 3D-structured illumination microscopy (3D-SIM) images of red blood cells (RBCs), shown as maximum projections of z-stacks, from control (Ctrl, top row) or Piezo1HA (bottom row) mice labeled using rhodamine phalloidin (magenta) and an antibody directed against the HA tag of Piezo1 (green). Scale bar, 3 μm. (B) 3D volume rendering of a representative labeled Piezo1-HA-KI mouse RBC displayed as XY (left) and XZ (right) axis views, showing the distribution of Piezo1. Scale bar, 2 μm. (C) Quantification of the number of Piezo1 spots per cell from 3D-SIM maximum projections. Mean ± standard deviation (SD) = 80.2 ± 26 spots per cell. Numbers were calculated on individual cells (n = 57) using Imaris spot detection. (D) Representative single channel traces from excised inside-out patch recordings of RBCs in symmetric 150 mM NaMethanesulfonate. The patch was clamped at −80 mV and negative pressure (0 to −30 mm Hg) was applied to the patch pipette. Amplitude histogram (right) enables estimation of single channel conductance. Showing one trace from n = 4 recordings.


