. 2022 Dec 14;11:e82621. doi: 10.7554/eLife.82621

Figure 4. Gold-particle tracking of Piezo1 reveals its lateral mobility in the red blood cell membrane.

(A) Example of a RBC imaged under DIC microscopy showing three 40-nm gold particle-labeled Piezo1 channels. Scale bar, 2 μm. (B) Close-up image of the gold particles with trajectories from a 2-min recording at 100 Hz frequency. Scale bar, 1 μm. (C) Representative trajectories corresponding to distinct Piezo1 diffusive behaviors in unfixed conditions, shown in blue (trajectories U1, U2, and U3). The green trajectories correspond to labeled Piezo1 in cells fixed with paraformaldehyde (PFA). (D) MSD against time for the first 60 s of the trajectories U1, U2, and U3 in C corresponding to unfixed conditions (blue) and an average of n = 5 fixed trajectories (green). (E) MSD against time for the first 5 s of an average of 14 trajectories. The data are fit to a straight line with a slope corresponding to a 2D diffusion coefficient of 0.0075 μm2 s−1. R2 for linear fit to data is 0.99. (F) MSD against time for the first 50 ms of an average of 14 trajectories. The data are fit to a straight line with a slope corresponding to a 2D diffusion coefficient of 0.037 μm2 s−1. R2 for linear fit to data is 0.98. (G) Image of a RBC with a single gold-labeled Piezo1 channel that was recorded for 1 hr at 1 Hz frequency. Superimposed are the final tracking result (blue) and a circle (red) indicating the approximate segmentation of the RBC dimple. Scale bar, 1 μm.

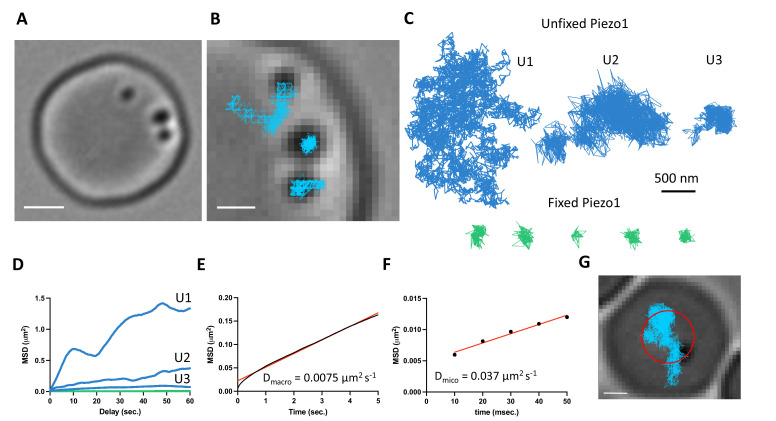
Figure 4.

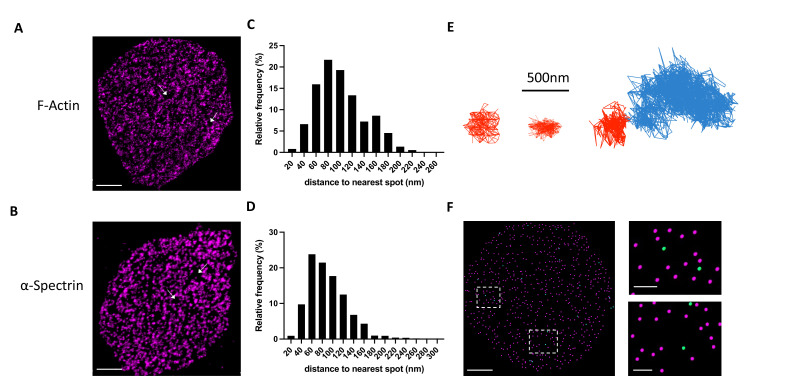
Figure 4—figure supplement 1. The observed diffusion behavior of Piezo1 is consistent with the organization of the actin–spectrin skeleton in red blood cells.

Figure 4—figure supplement 1.

(A) 2D stimulated emission depletion (STED) image of an unroofed RBC stained with phalloidin to label F-actin filaments. White arrows indicate voids deficient in phalloidin staining. These voids are approximately 200–500 nm in size. (B) As in (A) but with immunostaining against α-Spectrin. Scale bar, 1 μm. (C, D) Frequency distributions for the nearest-neighbor distance for F-actin (C) and α-Spectrin (D). (E) Example tracks of Piezo1 exhibiting confined diffusion in spaces <500 nm (red tracks). The right panel shows a track of a Piezo1 channel that becomes trapped in a <500-nm confinement radius (red portion of the track) toward the end of the recording. (F) (left) Imaris spot detection was used to detect spots of actin (magenta) and Piezo1 (green) from a 2D STED image of an unroofed RBC. Dashed squares indicate regions of focus (right) where Piezo1 is found in smaller (above) and larger (below) confinement spaces. Scale bars, 1 μm (left) and 200 nm (right).
Figure 4—figure supplement 2. The diffusion behavior of Piezo1 is comparable in the dimple and rim of the red blood cell.

Figure 4—figure supplement 2.

(A) Mean squared displacement (MSD) against time for the first 3 s of an average of n = 6 trajectories from tracks at the red blood cell (RBC) dimple and n = 8 trajectories from tracks at the RBC rim. R2 for linear fits is 0.98 for dimple measurements and 0.94 for rim measurements. (B) Comparison of diffusion coefficients measured from the slopes of MSD analysis of n = 6 trajectories from tracks at the RBC dimple and n = 8 trajectories from tracks at the RBC rim. The mean and standard error of the mean (SEM) are plotted and there is no statistically significant difference between mean diffusion coefficients at the dimple and the rim as determined by unpaired t-test analysis.