

Abstract
Background
Robotic, navigated, and patient-specific instrumentation (PSI) TKA procedures have been introduced to improve component placement precision and improve implant survivorship and other clinical outcomes. However, the best available evidence has shown that these technologies are ineffective in reducing revision rates in the general TKA patient population. Nonetheless, it seems plausible that these technologies could be an effective and cost-effective means of reducing revision risk in clinical populations that are at an elevated risk of revision because of patient-specific demographics (such as older age at index surgery, elevated BMI, and being a man). Since clinical trials on this topic would need to be very large, a simulation approach could provide insight on which clinical populations would be the most promising for analysis.
Questions/purposes
We conducted a simulation-based analysis and asked: (1) Given key demographic parameters characterizing a patient population, together with estimates of the precision achievable with selected forms of technology assistance in TKA, can we estimate the expected distributions of anticipated reductions in lifetime revision risk for that population and the associated improvements in quality-adjusted life years (QALYs) that would be expected to result? (2) Are there realistic practice characteristics (such as combinations of local patient demographics and capital and per-procedure costs) for which applying a per-patient risk-prioritized policy for using technology-assisted TKA could be considered cost-effective based on projected cost savings from reductions in revision rates?
Methods
We designed simulations of hypothetical practice-specific clinical scenarios, each characterized by patient volume, patient demographics, and technology-assisted surgical technique, using demographic information drawn from other studies to characterize two contrasting simulated clinical scenarios in which the distributions of factors describing patients undergoing TKA place one population at a comparatively elevated risk of revision (elevated-risk population) and the second at a comparatively reduced risk of revision (lower-risk population). We used results from previous systematic reviews and meta-analyses to estimate the implant precision in coronal plane alignment for patient-specific instrumentation, navigated, and robotic technology. We generated simulated TKA patient populations based on risk estimates from large clinical studies, structured reviews, and meta-analyses and calculated the patient-specific reduction in the revision risk and the change in QALYs attributable to the technology-assisted intervention in each of the two simulated clinical scenarios. We also incorporated a sensitivity analysis, incorporating variations in the effect size of deviations from overall coronal alignment on revision risk and difference in health state utilities acquired through a structured review process. We then simulated the outcomes of 25,000 operations per patient using the precisions associated with the conventional TKA technique, the three technology-assisted techniques, and a hypothetical technology-assisted intervention that could consistently deliver perfectly neutral overall coronal alignment, which is unachievable in practice. A risk-prioritized treatment policy was emulated by ordering the simulated patients from the highest to lowest predicted increase in QALYs, such that simulated patients who would see the greatest increase in the QALYs (and therefore the greatest reduction in lifetime revision risk) were the patients to receive technology-assisted TKA intervention in a practice. We used cost estimates acquired through a structured review process and calculated the net added costs of each of the three technology-assisted techniques as a function of the percent utilization (proportion of patients treated with technology assistance in a practice), factoring in fixed costs, per-procedure variable costs, and savings occurring from the prevention of future revision surgery. Finally, we calculated the incremental cost-effectiveness ratio (ICER) and marginal cost-effectiveness ratio (MCER) for each technology-assisted technique for the two clinical scenarios. We then used a Monte Carlo approach to simulate variations in key patient risk, health state, and economic factors as well as to obtain a distribution of estimates for cost-effectiveness. We considered an intervention to be cost effective if either the ICER or MCER values were below USD/QALY 63,000.
Results
For the lower-risk population, the median reduction in the revision risk was 0.9% (0.4% to 2.2%, extrema from the sensitivity analysis) and 1.8% (0.9% to 4.4%) for PSI and robotic TKA, respectively, and 1.9% (1.0% to 4.6%) for ideal TKA. In contrast, the median reduction in the revision risk in the elevated-risk clinical scenario was 2.0% (1.2% to 3.4%) and 4.6% (2.7% to 8.5%) for PSI and robotic TKA and 5.1% (3.0% to 9.4%) for ideal TKA. Estimated differences in the cumulative gain in QALYs attributable to technology-assisted TKA ranged from 0.6 (0.2 to 1.8) to 4.0 (1.8 to 10.0) QALYs per 100 patients, depending on the intervention type and clinical scenario. For PSI, we found treating 15% of patients in the lower-risk population and 77% in the elevated-risk population could meet the threshold for being considered cost effective. For navigated TKA systems offering high alignment precision, we found the intervention could meet this threshold for practice sizes of at least 300 patients per year and a percent utilization of 27% in the lower-risk population. In the elevated-risk population, cost-effectiveness could be achieved in practice volumes as small as 100 patients per year with a percent utilization of at least 6%, and cost savings could be achieved with a percent utilization of at least 45%. We found that robotic TKA could only meet the threshold for being considered cost-effectiveness in the lower-risk population if yearly patient volumes exceeded 600 and for a limited range of percent utilization (27% to 32%). However, in the elevated-risk patient population, robotic TKA with high alignment precision could potentially be cost effective for practice sizes as small as 100 patients per year and a percent utilization of at least 20% if a risk-prioritized treatment protocol were used.
Conclusion
Based on these simulations, a selective-use policy for technology-assisted TKA that prioritizes using technology assistance for those patients at a higher risk of revision based on patient-specific factors could potentially meet the cost-effectiveness threshold in selected circumstances (for example, primarily in elevated-risk populations and larger practice sizes). Whether it does meet that threshold would depend significantly on the surgical precision that can be achieved in practice for a given proposed technology as well as on the true local costs of using the proposed technology. We further recommend that any future randomized trials seeking to demonstrate possible effects of technology assistance on revision risk focus on clinical populations that are at higher risk of revision (such as, patient populations that are relatively younger, have higher BMIs, and higher proportions of men).
Clinical Relevance
This study suggests that technology assistance is only likely to prove cost effective in selected circumstances rather than in all clinical populations and practice settings. In general, we project that surgical navigation is most likely to prove cost effective in the widest range of circumstances, that PSI may be cost effective or cost neutral in a moderate range of circumstances, and that robotic surgery is only likely to be cost effective in moderately large practices containing patients who are on average at an intrinsically elevated risk of revision.
Introduction
Although TKA is one of the most successful and commonly used approaches to treating endstage symptomatic knee osteoarthritis, revision procedures still occur in roughly 7% of all TKAs [1, 11]. Furthermore, the increased costs of revision operations compared with primary procedures contribute to annual associated economic costs estimated at approximately USD 2.7 billion in the United States alone [8].
Studies have argued that many revision procedures (approximately 70% [1, 11, 48]) are related to mechanical aspects of the procedure that are under the surgeon’s control, such as implant alignment. To reduce outliers in making bone cuts and placing implants, robotic, navigated and patient-specific instrumentation (PSI) systems have been introduced with the goal of improving the precision of bone cuts and implant alignment [13, 15, 18, 26-28, 31, 32, 39, 41, 62].
Robotic TKA systems generally use optical tracking and/or haptic feedback to aid surgeons in making bone cuts according to a preoperative surgical plan. These systems frequently have high capital costs (for example, USD 1.2 million [17]). Navigated TKA systems can be based on any of a number of different sensors for localizing surgical tools (for example, optical, electromagnetic, accelerometer-based) and providing surgeons with feedback on a computer monitor as to the spatial location of surgical cutting tools. These systems generally have a lower capital cost relative to robotic TKA (for example, USD 183,000 [52]). PSI uses CT or MRI imaging for the fabrication of patient-specific cutting jigs to be used intraoperatively. PSI generally has a negligible capital cost but per-case costs comparable to robotic systems (for example, USD 1520 versus USD 1390 [14]) and higher than navigated systems (450 USD [14]).
The use of technology-assisted TKA (TA-TKA) remains controversial, however, because the best available evidence has shown that these technologies generally have higher costs than conventional TKA surgeries (as high as USD 6000 per procedure from the payer perspective [3]) and increased operating times (up to approximately 25 minutes per procedure [50]), and a number of randomized controlled trials have found no significant advantages in terms of implant survivorship or patient function in general populations of patients undergoing TKA [13, 15, 18, 26-28, 31, 32, 39, 41, 62]. Nonetheless, because there is some evidence that improved control over implant alignment could reduce revision risk [34], we believe it may be possible that TA-TKA could prove to be cost effective when applied more selectively to subpopulations of patients who are known to be at an elevated risk for premature revision because of patient-specific factors such as age at index surgery, BMI, and gender. Even in such a selective-use setting, clinical trials seeking to demonstrate lower revision rates would likely need to recruit several thousand patients [25], which would make such studies impractical to conduct. However, by simulating the predicted outcomes of such studies based on previously identified estimates of the influence of these patient-specific risk factors on revision risk, in combination with the influence of the increased precision offered by various TA-TKA systems, we can estimate whether selective use of these technologies could potentially prove to be cost effective in particular practice settings. To our knowledge, no such simulation has previously been performed. Rather, previous studies evaluating the cost-effectiveness of TA-TKA interventions have been limited to evaluating particular systems in particular settings and have assumed that all patients in the practice would be treated with the system [37, 43].
We therefore conducted a simulation-based analysis to answer the following questions: (1) Given key demographic parameters characterizing a patient population, together with estimates of the precision achievable with selected forms of technology assistance in TKA, can we estimate the expected distributions of anticipated reductions in lifetime risk of revision for that population and the associated improvements in quality-adjusted life years (QALYs) that would be expected to result? (2) Are there realistic practice characteristics (such as combinations of local patient demographics and capital and per-procedure costs) for which applying a per-patient risk-prioritized policy for using TA-TKA could potentially prove cost-effective based on projected cost savings from reductions in revision rates? If so, future studies aimed at demonstrating cost-effectiveness should preferably be conducted in such settings.
Materials and Methods
Overview
To address our study questions, we designed simulations of hypothetical practice-specific clinical scenarios, each characterized by its own patient volume, patient demographics, and TA-TKA surgical technique (Fig. 1). We used demographic information drawn from previously reported studies [45, 57] to characterize two primary contrasting clinical scenarios in which the distributions of factors describing patients undergoing TKA (in particular, age, gender, and BMI) place one population at a comparatively elevated risk of revision and the second at a comparatively reduced risk of revision. For the three main technologies that could be used in technology-assisted procedures (PSI, navigated, or robotic), we used results from previously reported studies [6, 10, 22, 25, 34] to estimate the implant precision in coronal plane alignment that each technology would produce.
Fig. 1.
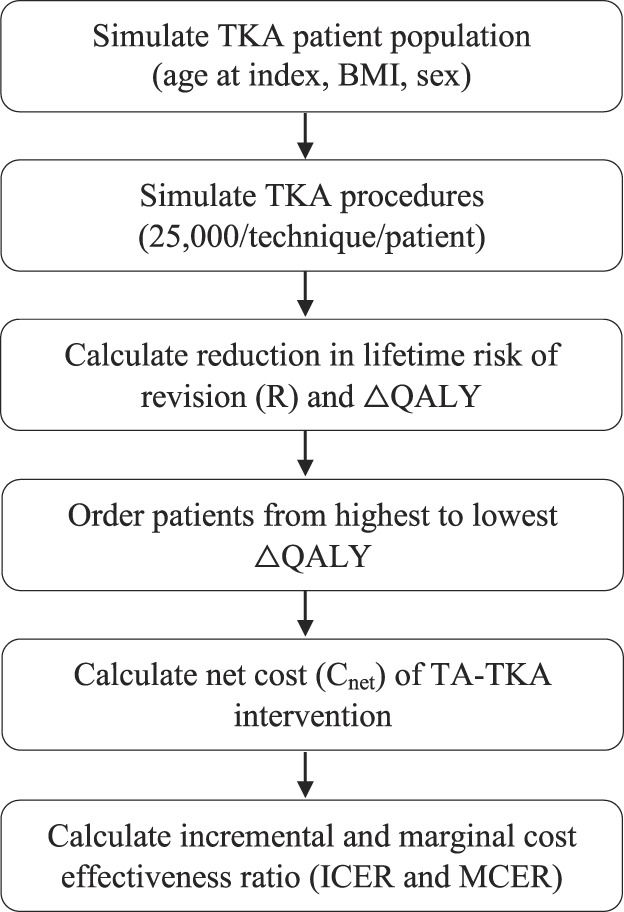
Overview of the study design. The 25,000 TKA procedures/patients/techniques are done to fully characterize the relationships between overall coronal alignment, QALYs, and lifetime risk of revision while also adding variations in the effect size of deviations from neutral overall coronal alignment and the precision of different TA techniques.
For each simulated clinical scenario, we generated 10,000 simulated TKA patient populations by randomly assigning demographic parameters (age at index surgery, BMI, gender) to each patient drawn from the distributions characterizing each population, using the method reported in a previous study [25]. We then calculated patient-specific reductions in revision risk and the change in QALYs (∆QALY) attributable to each form of TA-TKA that might be used in each of the two clinical scenarios by simulating the outcomes of 5000 operations per patient using the precisions associated with the conventional TKA technique and the three TA-TKA techniques studied (along with one hypothetical ideal-TKA technology that could deliver perfect overall coronal alignment); we repeated this three times to evaluate sensitivity to the estimated effect of surgical precision. We used health state utility and disutility values for the years postindex surgery, in the year of revision, and in the years after revision derived from previously reported studies identified through a structured review process.
To emulate applying a selective risk-prioritized treatment policy in which only a fraction of patients is treated with TA-TKA (those with the highest individual risk scores based on their demographic characteristics), we ordered the simulated patients in each patient population from the highest to lowest predicted change in QALYs based on patient-specific factors alone. Next, we conducted a structured review to estimate the fixed and variable costs associated with each of the three TA-TKA techniques and used these values to calculate the expected costs of treating each simulated patient with each TA-TKA technique, as well as the expected per-patient savings arising from reduced risks of a future revision surgery. Finally, we calculated the incremental cost-effectiveness ratio (ICER) and marginal cost-effectiveness ratio (MCER) for each TA-TKA technique as a function of the percentage of patients treated for each of the two simulated clinical scenarios (elevated and lower risk). We also performed analyses assessing the sensitivity of the estimated ICER and MCER values to variations in the estimated effects of deviations from neutral overall coronal alignment on risk of revision, health state utility and disutility values, and costs associated with the implementation of each TA-TKA system.
Simulating TKA Patients
In a previous study [25], we presented a method for creating large sets of simulated TKA patient populations with distributions of patient-specific factors including age at index surgery, gender, and BMI. In that study, we estimated the relative risks associated with age at index surgery and gender using data acquired from a large registry study on the risk of revision from the Clinical Practice Research Datalink [6]. Similarly, we estimated the relative risks of revision associated with BMI using survival data presented in a recent systematic review on the effect of BMI on implant survival in TKA [10].
In that study, we also simulated the revision risk associated with a key surgeon-controlled factor—the overall degree of coronal alignment of the knee—by modeling survival functions reported in a large RCT study (n = 982) where the survival data were separated by alignment category [34]. This allowed us to interpolate between and extrapolate beyond varus, valgus, and neutral category averages to calculate a relative revision risk for each value of overall coronal alignment. The baseline implant survival rate used to simulate TKA patients was selected to be 93% at 15 years as estimated from a review of national joint replacement registry reports from Australia and Finland [22].
Savings Associated With Reductions in Revision Rate
To quantify the effect TA-TKA intervention has on reduction in revision rates in an individual simulated patient (i), we calculated a measure called the reduction in the lifetime revision risk (Ri). This metric estimates the expected lifetime reduction in a specific patient’s revision risk (based on their set of demographic factors) because of the improved precision offered by a particular form of TA. To calculate Ri, we created a cohort of simulated patients with TKA with the desired demographics (age at index surgery, gender, and BMI) using the procedure described by Hickey et al. [25]. For each patient (i) in our simulation, we simulated 3 x 5 x 5000 TKA procedures, with each set of 5000 procedures characterized by a variation in the effect size of deviations from neutral overall coronal alignment on revision risk (-25%, +0%, and +25% from the baseline rate) and different TKA techniques (conventional, three TA-TKA systems, and a hypothetical TA intervention that could consistently deliver neutral overall coronal alignment) (a) and corresponding coronal alignment precision: ± 3° for a conventional approach (a = conventional TKA), ± 2.4° for a PSI approach (a = PSI-TKA [9]), ± 1.9° for a NAV-TA approach (a = NAV-TKA [9]), and ± 1.0° for an RA-TA approach (a = RA-TKA [44]), where these estimated precisions were either sourced directly from the cited literature or calculated using outlier percentages (Supplementary Digital Content 1; http://links.lww.com/CORR/A924). Because revision has a low occurrence, we chose to do 5000 simulated procedures per patient to generate acceptably low variability estimates of the expected patient-specific reductions in revision risk and changes in QALYs. For each patient and simulated procedure, we randomly generated revision events based on the implant survival probability curve associated with the simulated coronal alignment value for that specific procedure, as described by Hickey et al. [25]. By collating these simulated outcomes over the 5000 procedures with a given surgical technique, a (conventional or TA), we generated patient-specific implant survival curves for each surgical technique, Si,a (Fig. 2).
Fig. 2.

Si,a(t) (each of the solid lines) is the probability that an implant placed using surgical technique a will have survived at t years postoperatively, assuming that patient i is still alive. L is the probability a patient is still alive t years postoperatively, assumed to depend only on patient age and gender (patient survival also depends on BMI [55], but the actuarial tables available to us did not include this factor). A color image accompanies the online version of this article.
To incorporate the effect of some patients dying before their implants were revised (which we treated as uncorrelated events), we calculated a remaining life function, Li(t), representing the probability of patient i being alive at time t after their TKA, based on actuarial data obtained from the US Social Security database [58] for patients of the same gender as patient i and having the same age at the time of surgery. We then used the numeric inverse of Li(t), that is, t(Li), to estimate each simulated patient’s lifetime probability of not having their implant revised for a given TKA approach by integrating their implant survival probability over their remaining life function (first integral in Equation 1). Finally, to calculate R for a particular simulated patient, i, and TA technique, a, we subtracted the lifetime probability of survival associated with the conventional approach (cTKA) from the lifetime probability of survival associated with the TA technique a.
| 1 |
For example, if a patient has a 12.1% lifetime probability of having a revision if treated with the conventional surgical approach, which can be reduced to 8.8% if treated using a robotic system, this results in an absolute reduction in the lifetime risk of revision of 3.3% or a reduction of 27.3% off their baseline revision risk (Fig. 3). Although Equation 1 is a deterministic integral, the integrand Si,a is estimated using a Monte Carlo simulation of 5000 simulated surgeries characterized by effect sizes of overall coronal alignment on revision risk and TA-TKA system.
Fig. 3.

The probability that a specific patient (a 67-year-old woman with a BMI of 28 kg/m2) is either deceased (gray), alive with a functioning TKA (white), or a revision candidate for either conventional TKA (red), PSI (orange), navigated (dark green), robotic (light green), and a hypothetical TA-TKA device with perfect precision (black). As the coronal alignment precision of the surgical techniques increases, the estimated reduction in the revision risk decreases. The colored lines represent incremental reductions in the revision risk from adopting the next most-precise technology; for example, the red line shows the reduction in the revision risk possible from moving from conventional TKA to PSI. The black line represents the residual revision risk we estimate cannot be eliminated by future improvements in coronal alignment precision. A color image accompanies the online version of this article.
Net Per-procedure Cost of TA-TKA Implementation
To estimate the net per-procedure costs of TA-TKA implementation, we considered the fixed and variable costs associated with the procedure, as well as the costs associated with any future revisions. To estimate these costs, the first author (MDH) conducted a structured search of previously published studies evaluating the fixed and variables costs associated with robotic, navigated, and PSI systems compared with those of conventional TKA. The structured search of the University of British Columbia’s library database (which automatically searches medical publication databases such as PubMed, Embase, MEDLINE, and Web of Science) used the following keywords: “total knee replacement/arthroplasty,” “cost,” “cost effective,” “robot,” “robotic,” “navigated,” “navigation,” and “patient specific instrumentation” (Fig. 4). The keywords were used to search the titles, abstracts, and full text of publications. We then screened the abstracts of all results and excluded any items from further review if the main text was not written in English or was not available, was a duplicate, or if a robotic, navigated, or PSI approach to TKA was not mentioned. After screening abstracts, we analyzed the full text of each article. We excluded studies that did not present any original estimates of TA-TKA system cost and implementation or if the costs were cited from another study. Texts were also excluded if the presented cost data did not differentiate between fixed costs and variable per-case costs. Of the initial 213 search results, 15 were included and summarized (Table 1). The mean yearly capital cost of robotic and navigated TKA systems was calculated to be USD 139,000 ± 81,000 and USD 38,900 ± 16,100, respectively. The mean additional per-case cost associated with robotic, navigated, and PSI intervention was calculated to be USD 1490 ± 230, USD 350 ± 90, and USD 1070 ± 660, respectively.
Fig. 4.

Study selection process to estimate additional TA-TKA costs. For additional TA-TKA cost, we included 15 studies. The intervention tool was robotic in seven studies, navigated in seven studies, and PSI in six studies. Four studies provided cost details on multiple systems.
Table 1.
Summary of relevant system cost publications resulting from structured search
| Author | Yearly capital costs (2021 USD) | Per-case costs (2021 USD) |
| Robotic | ||
| Christen et al. [14] | 1390 | |
| Steffens et al. [52] | 312,000 | |
| Cotter et al. [17] | 146,000 | 1120a |
| Shah et al. [47] | 105,000b | |
| Kayani et al. [30] | 111,000b | |
| Liow et al. [35] | 89,000 | 1670 |
| Bellemans et al. [7] | 71,000 | 1780 |
| Mean ± SD | 139,000 ± 81,000 | 1490 ± 230 |
| Navigated | ||
| Christen et al. [14] | 450 | |
| Steffens et al. [52] | 55,200 | |
| Shah et al. [47] | 20,500 | |
| Goh et al. [23] | 33,000 | 230 |
| Gøthesen et al. [24] | 25,100 | |
| Watters et al. [60] | 360 | |
| Slover et al. [49] | 60,500 | |
| Mean ± SD | 38,900 ± 16,100 | 350 ± 90 |
| PSI | ||
| Christen et al. [14] | 1520 | |
| Attard et al. [4] | 400 | |
| Teeter et al. [53] | 1890 | |
| DeHaan et al. [19] | 250 | |
| Barrack et al. [5] | 1740 | |
| Watters et al. [60] | 630 | |
| Mean ± SD | 1070 ± 660 | |
We regarded the fixed costs as any capital costs for the surgical system that can be spread out over patients receiving a TKA on a per-procedure basis (system purchase costs, software, and annual service fees). We considered per-case costs to be any costs or savings associated with implementation of a TA-TKA system that are realized on a per-procedure basis (for example, disposables, medical imaging, instrument reprocessing, and operating room time). Yearly cost data may not be as reported in each of the source texts as each entry was adjusted for inflation and currency to 2021 USD. Yearly capital costs were rounded to the nearest USD 100, and per-case costs were rounded to the nearest USD 10. All capital costs are amortized over a 5-year period for navigated or a 10-year period for robotic.
Cost of a CT scan missing from source text. Added USD 420 [14].
Average of costs reported.
Fixed Costs
We regarded the fixed costs (CFixed) associated with TA-TKA as any capital costs for the surgical system that can be spread out over patients receiving a TKA on a per-procedure basis, including system purchase costs, software, and any procedure load–independent annual service fees [7, 14, 17, 23, 24, 30, 35, 37, 47, 49, 52]. In our analysis, we only considered fixed costs reported in studies that were related to the purchase and service of a TA-TKA system (payment to an external entity). The relatively large ranges in the reported fixed costs of TA-TKA implementations likely reflect either system- or clinic-specific differences in the capital investment required to purchase a TA-TKA system (for example, differential pricing offered to different institutions). All system costs were amortized over a 5-year period for navigated systems [37] or a 10-year period for robotic systems [17]. We assumed that the fixed costs for PSI-TKA were negligible.
Variable Costs
We considered per-procedure variable costs (CVariable) to be any costs or savings associated with implementation of a TA-TKA system that are realized on a per-procedure basis. In our analyses, we incorporated only line items that were directly attributable to use of TA-TKA or conventional TKA procedures. This was done to minimize the effects of different cost/charge structures between clinics on our estimate of additional TA-TKA per-case costs. If medical imaging costs were not included in a study reporting the costs of a robotic or PSI procedure, we assumed that a CT scan would need to be performed and added a fixed cost of USD 420, as reported [14], to account for this. For intraoperative per-case costs, we included line items related to elements such as TA-TKA disposables, medical imaging, instrument reprocessing, and operating room time [4, 5, 7, 14, 17, 19, 23, 35, 53, 60], if reported, but we opted not to include costs or savings associated with inpatient or outpatient care such as differences in the cost of laboratory tests, length of stay, physical therapy, readmission, or use of post–acute care facilities because causal mechanisms associated with such costs are not fully understood and costs or savings linked to these items have only been reported in a limited number of settings [16, 17, 41, 46]. If a specific practice wished to include such costs or savings in this model, it would be straightforward to do so.
Net Cost
We calculate the net cost, Cnet i,a(n), for treating a particular patient, i, using a particular technology, a, when patients are treated with that technology as the sum of the fixed costs divided by the number of patients, the per-procedure variable costs, and the reduction in the lifetime risk of revision for patient i (Ri,a) multiplied by the savings associated with an avoided revision surgery (CRev) (Equation 2). This framing of the net cost allows clinics to incorporate clinic-specific estimates of the reduction in revision rates (as a function of local patient demographics), variable costs associated with that clinic’s unique resources, and fixed costs dependent on the capital and servicing costs associated with a TA system (Table 1).
| 2 |
Net Marginal Cost
In addition to net cost, we calculated the net marginal cost of treating a particular patient, i (Cm i,a), given that a practice has already acquired a TA-TKA system. This cost metric reflects the per-procedure variable costs and cost savings attributable to reductions in revision risk and neglects the effect of fixed costs because these are effectively sunk costs (Equation 3).
| 3 |
Calculation of Change in Quality-adjusted Life Years
To estimate the per-patient and per-intervention improvement in QALYs (ΔQALYi,a), the first author (MDH) conducted a second structured search of previously published studies using utility and disutility health state values associated with primary TKA and revised TKA. The structured search of the University of British Columbia’s library database was completed using the following keywords: “total knee replacement/arthroplasty,” “revision,” “utility,” “quality adjusted life years,” “QALY,” and “disutility” (Fig. 5). We then screened the full texts and excluded any items from further review if the main text was not written in English or was not related to TKA. We then excluded studies that did not present any health state utility or disutility estimates. Of the initial 28 search results, nine were included and summarized [2, 12, 20, 33, 42, 49, 51, 59, 61] (Table 2). The mean calculated health state utilities for primary and revised TKA were calculated to be 0.78 ± 0.05 and 0.69 ± 0.07, respectively. The mean calculated 1-year disutility associated with a revision procedure was calculated to be - 0.12 ± 0.03.
Fig. 5.

Study selection process to estimate health state utility values, which resulted in nine studies being included.
Table 2.
Summary of relevant health state utility publications resulting from structured search
| Author | Utility after primary | Utility 1-year after revision | 1-year disutility after revision |
| Konopka et al. [33] | 0.840 | 0.740 | |
| Vermue et al. [59] | 0.725 | 0.707 | -0.15 |
| Chawla et al. [12] | 0.835 | 0.772 | |
| Antonios et al. [2] | -0.13 | ||
| Ponnusamy et al. [42] | 0.770 | 0.670 | |
| Srivastava et al. [51] | 0.800 | 0.720 | -0.08 |
| Slover et al. [49] | 0.680 | 0.532 | -0 .10 |
| van der Woude et al. [61] | 0.790 | 0.750 | |
| Dong et al. [20] | 0.780 | 0.660 | |
| Mean ± SD | 0.78 ± 0.05 | 0.69 ± 0.07 | -0.12 ± 0.03 |
For each of the 75,000 (3 x 5 x 5000) total simulated procedures per simulated patient described previously, we randomly selected a time of death based on the simulated patient’s remaining life curve and computed the average sum of QALYs for the period in which they were alive using the mean health state utilities estimated through the structured search (Table 2). The QALYs associated with a particular intervention were calculated as the estimated time a patient spends in a particular health state (primary or revised) multiplied by the estimated utility associated with that health state. For patients who transitioned between primary and revised health states, a 1-year disutility was also applied to account for the invasive revision surgery and associated recovery time. We then calculated the ΔQALYi,a for a particular TA-TKA technique, a, by subtracting the sum of QALYs associated with conventional TKA from the sum of QALYs associated with TA-TKA technique a (Supplementary Digital Content 2; http://links.lww.com/CORR/A925).
Risk-prioritized Health Policy Simulation and Marginal and Incremental Cost-effectiveness Ratio
In our simulations, we emulated implementing a selective-use, risk-prioritized policy in which TA-TKA is used only in those patients who are most likely to benefit (namely, those with the highest expected change in quality-adjusted life years [ΔQALY] and largest reduction in lifetime revision risk) from TA-TKA intervention. We parameterized the implementation of this policy as a percent utilization, calculated as PU = n/N x 100%, or the proportion of patients in a practice who receive a TA-TKA, selected based on patient-specific risk priority.
The cost-effectiveness of implementing a new technology in a clinical context is often defined as the ratio of the added costs (or savings) of implementation to the estimated change in patient outcomes. The ratio of the total costs of applying a proposed policy to a defined group of patients to the total change in QALYs expected to be experienced by that cohort is known as the incremental cost-effectiveness ratio (ICER) [37, 43]. In the context of this study, the ICER is a function of the number of patients, n, we opt to treat by TA-TKA in a given practice (Equation 4):
| 4 |
According to the World Health Organization, a “high value intervention” may be considered one where the ICER is less than a nation’s per capita gross domestic product (approximately USD 63,000 in the United States) per QALY [21], although individual practices are free to set their own values for what they consider to be a cost-effective intervention in their own context.
Although the ICER value is the one that a policymaker should use to decide if the capital costs associated with acquiring a system are justified, once a system has been acquired, the decision of whether to use it on a particular patient should be based on the marginal cost-effectiveness ratio, MCER, calculated as (Equation 5):
| 5 |
Sensitivity Analysis
To estimate the impacts of variations in fixed and variable costs associated with TA-TKA implementation and variations in the cost of revision surgery across different locations, we used a Monte Carlo approach to simulate variations in key patient risk, health state, and economic factors. For each simulated scenario in our model, we varied the effect size of deviations from neutral overall coronal alignment on risk of revision by ± 25%. Additionally, we varied the difference between the average utility for primary and revision health states by ± 25% from the averages identified through the structured review (Table 2). For economic parameters, we created normal distributions of fixed and variable costs, centered at the mean estimated cost (Table 1). We chose the SD for fixed and variable costs as ± 25% of the average identified through the structured review (Table 1). However, we choose an SD of ± 60% of the mean for PSI because of the large range in reported per-case costs and lack of associated capital costs. Finally, we estimated the cost of revision surgery using data reported in a study of the National Inpatient Sample database in the United States, which includes more than 300,000 revision TKAs [29, 38]. We included costs associated with aseptic revisions including procedures for mechanical loosening, periprosthetic fracture, and dislocation. We weighted each reported cost by procedure occurrence to calculate a weighted mean and SD of the cost associated with revision surgery. Reported costs were adjusted for inflation to 2021 USD, resulting in a distribution of revision costs of USD 29,600 ± 5550 [29, 38].
Realistic Clinical Scenarios
To illustrate how this model would work on a practice level, we applied it to two sets of simulated realistic clinical scenarios with variations in patient demographics, the parameters of which were derived from two recent TKA studies [45, 57] (Table 3). The first scenario consisted of simulated patients with a lower average age at index surgery, elevated BMIs, and a gender distribution with equal numbers of men and women, resulting in comparatively elevated local revision rates and larger-than-typical expected benefits from TA-TKA. In contrast, the second scenario consisted of simulated patients with a higher average age at index surgery, reduced BMIs, and a gender distribution dominated by women, resulting in comparatively lower local revision rates and diminished expected benefits from TA-TKA.
Table 3.
Clinical simulation scenario patient demographics
For each scenario, we calculated the distribution in estimated reductions in risk of revision (Rd) over the entire simulated population. In each scenario, we simulated a single year of TKA procedures for various practice sizes (100 to 600 patients yearly). For each scenario combination, practice size, and TA-TKA intervention, we ran each cost-effectiveness simulation 10,000 times, randomly sampling from the normal distributions of variable, fixed, and revision costs and uniform distributions of reductions in revision rate and gains in QALYs and calculating the distribution of ICERs and MCERs for each TA-TKA as a function of the percent utilization.
Results
Revision Rate Changes and QALYs Attributable to Technology-assisted TKA
For the lower-risk population (relatively older age at index surgery, lower BMI, and high proportion of patients who are women), the median reduction in lifetime revision risk, R, was 0.9% (0.4% to 2.2%, extrema from the sensitivity analysis) and 1.8% (0.9% to 4.4%) for PSI and robotic TKA, respectively, and 1.9% (1.0 % to 4.6%) for ideal TKA (a hypothetical TA intervention that could deliver perfectly neutral overall coronal alignment, which is obviously unobtainable in practice but which establishes an outer limit for the potential impact of improved surgical precision) (Fig. 6A). In contrast, the median R value in the elevated-risk population (relatively younger age at index surgery, higher BMI, and nearly equal proportion of patients who are women) was notably higher at 2.0% (1.2% to 3.4%) and 4.6% (2.7% to 8.5%) for PSI and robotic TKA, respectively, and 5.1% (3.0% to 9.4%) for ideal TKA (Fig. 6B).
Fig. 6.

A-B Cumulative distribution of reductions in the lifetime risk of revision (R) for the (A) lower-risk scenario and (B) elevated-risk scenario. Horizontal error bars show the range in the estimated median reduction in lifetime risk of revision. These have been visually offset from the 50th percentile for clarity. A color image accompanies the online version of this article.
These reductions in revision risk resulted in differences in the cumulative ∆QALYs attributable to TA-TKA between the elevated-risk TKA populations (Fig. 7). For the lower-risk population, the change in QALYs, assuming all patients were treated with TA-TKA, ranged from 0.6 (0.2 to 1.8) to 1.1 (0.4 to 3.4) QALYs per 100 patients for PSI and robotic TKA, respectively, and 1.2 (0.5 to 3.6) QALYs per 100 patients for ideal TKA. In contrast, the change in QALYs in the elevated-risk population was 3 to 4 times higher at 1.9 (0.8 to 4.5) and 4.0 (1.8 to 10.0) QALYs per 100 patients for PSI and robotic TKA, respectively, and 4.4 (2.0 to 11.0) QALYs per 100 patients for ideal TKA.
Fig. 7.

Cumulative distribution of ∆QALYs per 100 patients for the lower-risk and elevated-risk scenarios as a function of the percentage of patients treated with TA-TKA. The vertical error bars and numbers reported in the legend represent the QALYs gained per 100 patients compared with conventional TKA using a particular TA-TKA system at 100% utilization. A color image accompanies the online version of this article.
Specific Practice Settings for Specific Kinds of Technology-assisted TKA Approaches
PSI
For TKA using PSI, we found that approximately 15% of patients in the lower-risk and 77% in the elevated-risk populations satisfied the criterion for being a high-value intervention (MCER < 63,000 USD/QALY) (Fig. 8A-B). However, the range of cost-effective estimates was large, especially in the lower-risk population, with estimates ranging from 5% of patients to 100% of patients satisfying the criterion for being a high-value intervention.
Fig. 8.

A-F ICER and MCER for various practice sizes, technology-assisted interventions, and clinic population demographics. This figure shows the following: PSI: (A) lower-risk and (B) elevated-risk. Navigated: (C) lower-risk and (D) elevated-risk. Robotic: (E) lower-risk and (F) elevated-risk. A color image accompanies the online version of this article.
Navigated
For navigated TKA, which involves a substantial capital expenditure, it is necessary to treat a large number of patients with a technology to drive down the per-patient fixed costs (Fig 8C-D). In the lower-risk patient population, we found that navigated TKA could nominally satisfy the criterion for being considered a high-value intervention (ICER < 63,000 USD/QALY) for practice sizes of at least 300 patients per year and a percent utilization of at least 27% if a risk-prioritized treatment protocol were used. In the elevated-risk population, navigated TKA could nominally satisfy this criterion in practice volumes as small as 100 patients per year and a percent utilization of at least 6% and could even be nominally cost saving at percent utilizations of at least 45%. If the practice volume were higher, navigated TKA could be considered cost saving at markedly lower percent utilizations (22% for a 300-patient practice, for example). Once a practice has decided to purchase a navigated system, the MCER curves showed that a practice could find it marginally cost saving to use on nearly all patients, regardless of the patient demographics (lower or elevated risk).
Robotic
For robotic TKA, the comparatively high capital costs result in high per-procedure costs for low percent utilization (Fig. 8E-F). In the lower-risk patient population, we found that robotic TKA could nominally achieve the criterion for being considered a high-value intervention only in practice sizes of at least 600 patients per year and a percent utilization ranging between 27% to 32% if a risk-prioritized treatment protocol were used. Robotic TKA was not estimated to be cost effective outside of this utilization range (below this range, per-procedure capital costs are too high, and above this range, per-procedure variable costs are too high). In contrast, in the elevated-risk patient population, our analysis showed that robotic TKA could nominally achieve the criterion for being considered a high-value intervention for practice sizes as small as 100 patients per year and a percent utilization of at least 20% if a risk-prioritized treatment protocol were used. Once a practice has decided to purchase a robotic TKA system, the MCER curves showed that the system would be marginally cost effective if used on up to 90% and 94% of lower-risk and elevated-risk patients, respectively, and would find it marginally cost saving to use it on up to 40% of patients in the elevated-risk patient population if a risk-prioritized treatment protocol were used.
Discussion
The cost-effectiveness of TA-TKA systems has been a controversial topic in orthopaedic surgery. Previous studies aiming to evaluate the net benefit or cost of implementing TA-TKA systems have not demonstrated improvements in implant survivorship in the general population of patients undergoing TKA [13, 15, 18, 26-28, 31, 32, 39, 40, 62]. The simulation results presented above suggest that technology assistance cannot generally be considered to be cost effective for application across the board in a general clinical population. However, it may be possible, in some selected circumstances (particularly in larger practices in which the patient population is at an intrinsically elevated revision risk), that adopting a risk-prioritized treatment policy in which technology assistance is directed at those patients who are at highest revision risk due to their demographic characteristics (for example, being relatively younger, having a higher BMI, and being a man) could meet the criterion for being considered a high-value (that is, cost effective) intervention, and may even prove to be cost saving in more specific practice settings. We therefore recommend that researchers hoping to demonstrate the cost-effectiveness of these surgical technologies focus their attention on those situations we have identified as most likely to meet this criterion.
Limitations
As this is a simulation-based analysis, the effects of patient-specific and surgeon-controlled factors on revision risk were estimated based on other studies and were not directly measured or verified. However, our risk models are based on risk data acquired from large clinical studies, systematic reviews, and registry studies, and capture what we believe are reasonable estimates of the effect size of TA-TKA, patient-specific factors, and surgeon-controlled factors on revision rates. This was further explained in our previous study [25]. The costs associated with TA-TKA were limited to those associated with the capital purchase of a TA-TKA system and direct intraoperative variable costs; we neglected sporadic reports of TA-TKA-related reductions in other inpatient and outpatient costs because of limited reporting on and consensus about these values. Furthermore, not all TA-TKA cost-related studies report fixed and per-case costs in a consistent manner. For example, it was not clear whether the capital investment reported in some studies included costs associated with software or yearly maintenance contracts [47], and some studies did not include per-case costs associated with medical imaging [17]. Recognizing this limitation, the capital and direct variable costs we used were based on a structured review of published research, and the range of costs considered in the sensitivity analysis covers the cost estimates identified in this literature [16, 17, 56, 59]. Clearly, a smaller institution facing higher capital costs should expect that the ICER they would realize would be larger than that realized by a larger institution that is offered a lower purchase price for the same system.
In estimating the potential precision improvements produced by different TA-TKA systems, we selected some of the most precise values reported (for example, ± 1.9° for a navigation system and ± 1.0° for a robotic system, as calculated from Bouché et al. [9] and Ren et al. [44], respectively), even though there are numerous reports of similar systems producing worse precision in practice (for example, ± 2.5° to 2.7° for navigation systems [40, 63] and ± 1.5° to 2.4° for robotic systems [28, 62]). If a particular institution were unable to realize the most precise performance reported for a given TA-TKA system, they would experience reduced or even negative effectiveness gains relative to the conventional procedure. Therefore, our estimates are optimistic and represent cost-effectiveness values that may ultimately be reached by users of the various TA-TKA systems rather than values that could reasonably be expected by typical users at this point.
Our statements about the situations in which use of technology assistance might meet the criterion to be considered a high-value intervention (USD 63,000 per QALY in the United States) are based on the threshold recommended by the World Health Organization. There is, however, no broad consensus on what this value should be, and individual practices could well opt to use different values. Higher thresholds will obviously make all TA-TKA systems appear to be more cost effective than we have reported, and vice versa.
Our analyses proved to be sensitive to the QALY values ascribed to the various patient states. The utility and disutility values we used were derived from studies identified through a structured review process and are assumed to apply equally to all patients who undergo arthroplasty. Patients will experience different levels of personal utility depending on a range of other considerations not included in our analyses, but, in the absence of more detailed and reliable models linking these values to surgeon-controlled variables, we believe that our current analyses (including the associated sensitivity analyses) capture the form and range of expected outcomes. Should it be determined in the future that particular forms of TA-TKA can reliably produce measurable differences in quality of life (perhaps through improvements in patient-reported outcome measures [54]) compared with conventional TKA, these differences could be incorporated into this analysis by modeling the impact on QALYs [43].
We also assumed that the remaining life function only depended on patient age and gender, as these dependencies were directly derivable from the National Inpatient Survey. However, there is evidence that patients with an elevated BMI face a reduced life expectancy (∼50% increased 10-year risk of death for morbidly obese patients [BMI > 45 kg/m2] [55]). We might therefore have slightly overestimated the lifetime reduction in the revision risk for patients with a high BMI, thus modestly overestimating the cost-effectiveness ratios associated with using TA-TKA. In addition, we assumed that death rates after arthroplasty do not differ from those in the general population, but if arthroplasty did reduce life expectancy substantially, we might have somewhat over-estimated the associated cost-effectiveness ratios.
Discussion of Key Findings
Our model showed the median reductions in the lifetime risk of revision and gains in QALYs per 100 patients attributable to TA-TKA would range from approximately 0.9% to 5.1% and 0.6 to 4.0 respectively, depending on the TA system and revision risk level of the patient population. We identified several simulated clinical scenarios where TA-TKA could potentially either meet the criterion for being considered a high-value intervention or even be cost saving if clinicians use a risk-prioritized treatment protocol. Not surprisingly, all these technologies demonstrated stronger effects in patient populations with higher intrinsic revision risk based on demographic characteristics, so we recommend that future studies aimed at demonstrating potential economic benefits of technology assistance focus on these high-risk settings. Nonetheless, despite the predictions of cost-effectiveness or even cost savings in these settings, the overall effect of improved surgical precision on revision risk is relatively low, and our previous study demonstrated that it would likely require large numbers of patients (>1000 in each arm of a randomized control trial) to clearly demonstrate improvements in revision rates, which would be required to demonstrate cost-effectiveness.
These findings are not disconsonant with those of several related studies, although there are numerous differences in approach. Several retrospective clinical studies have reported negative marginal costs for using robotic TKA due in part to claimed reductions in episode-of-care costs, although in our study any negative marginal costs we incorporated were primarily attributable to reductions in revision rate predicted by decreases in outliers resulting from improved surgical precision [16, 36, 46]. Recently, Rajan et al. [43] used a Markov decision model to simulate the outcomes of patients who underwent TKA using conventional or robotic approaches and concluded that robotic surgery might prove to be cost effective for a practice volume of 200 TKAs per year; however, they used a revision rate for conventional procedures that was derived from a different source than the revision rate they used for robotic procedures, even though the robotic revision rate was derived from a review of 11 studies that collectively showed no differences in revision rates between conventional and robotic procedures. Consequently, their conclusion is questionable.
Regarding navigated TKA, two studies have estimated that the reduction in revision rate needed to make navigated TKA cost effective compared with conventional TKA would need to be 0.8% at 10 years [24] or 2% at 20 years [49] for practice volumes of 250 patients per year. These values are similar in magnitude to the differences in the predicted risk of revision we found for navigation systems compared with conventional TKA (median values of approximately 1.4% to 3.3% in reductions in lifetime risk of revision for lower-risk and elevated-risk patients, respectively). Finally, we found six studies [4, 5, 14, 19, 53, 60] that estimated the net cost of implementing PSI compared with conventional TKA and used these values to calculate the variable cost parameters in our model. However, we found no studies that estimated the ICER for PSI technology, so we cannot directly compare the predictions of our simulations to other studies.
The selective-use, risk-prioritized policy we introduced in this paper imagines focusing use of TA-TKA techniques on patients with higher intrinsic revision risks. However, given that a key patient factor is gender and that men are at an increased revision risk compared with women [6], this could have the unintended consequence of prioritizing men over women for receiving TA-TKA, which could be seen as discriminatory. Similarly, a second key factor is age at index surgery; given that younger patients are at an increased lifetime risk of revision compared with older patients because of longer expected life [6], this could have the unintended consequence of prioritizing younger patients over older patients for receiving TA-TKA, which again could be seen as discriminatory.
Conclusion
The simulations presented in this study suggest that technology assistance of any kind is generally not cost effective when applied to all patients in a general clinical population, particularly not populations in which the patients are intrinsically at a low revision risk. However, in selected circumstances, a selective-use policy for TA-TKA that prioritizes TA for patients at a higher revision risk because of intrinsic characteristics such as age at index surgery, BMI, or gender could potentially satisfy the criterion for being considered a high-value intervention, depending on the demographic characteristics of a particular practice, its annual surgical volume, the percentage of patients treated with technology assistance, and the precision and costs of the technology assistance used. Overall, navigation is predicted to prove cost effective in the widest range of circumstances, PSI may prove to be cost effective (and even cost saving) in a moderate range of circumstances, and robotic surgery is only likely to prove cost effective in large practices in lower-risk populations or perhaps more broadly in practices with a high proportion of patients at an elevated revision risk. We therefore recommend that any future randomized trials seeking to demonstrate that a TA-TKA system can cost-effectively reduce revision risk be conducted in practice settings where our simulations suggest such results are most likely to be found.
Acknowledgments
We thank the Centre for Hip Health and Mobility for facilities and technical support and the Natural Sciences and Engineering Research Council for providing Mr. Hickey’s postgraduate scholarship.
Footnotes
The institution of one or more of the authors (MDH, AJH) has received funding from the Natural Sciences and Engineering Research Council of Canada. One of the authors (BAM) certifies receipt of personal payments or benefits, during the study period, in an amount of less than USD 10,000 from Stryker, as well as research support from Zimmer, Smith and Nephew, DePuy, and Stryker. One of the authors (AJH) certifies holding shares in Traumis Surgical Systems and holding several patents (US9554812, US8548559, US10010381, and US9037295) that are broadly relevant to the work.
All ICMJE Conflict of Interest Forms for authors and Clinical Orthopaedics and Related Research® editors and board members are on file with the publication and can be viewed on request.
Ethical approval was not sought for the present study.
Contributor Information
Bassam A. Masri, Email: bas.masri@ubc.ca.
Antony J. Hodgson, Email: ahodgson@mech.ubc.ca.
References
- 1.American Academy of Orthopaedic Surgeons. American Joint Replacement Registry 2021 Annual Report. Available at: https://connect.registryapps.net/2021-ajrr-annual-report. Accessed January 10, 2022.
- 2.Antonios JK, Bozic KJ, Clarke HD, Spangehl MJ, Bingham JS, Schwartz AJ. Cost-effectiveness of single vs double debridement and implant retention for acute periprosthetic joint infections in total knee arthroplasty: a Markov model. Arthroplast Today. 2021;11:187-195. [DOI] [PMC free article] [PubMed] [Google Scholar]
- 3.Antonios JK, Korber S, Sivasundaram L, et al. Trends in computer navigation and robotic assistance for total knee arthroplasty in the United States: an analysis of patient and hospital factors. Arthroplast Today. 2019;5:88-95. [DOI] [PMC free article] [PubMed] [Google Scholar]
- 4.Attard A, Tawy GF, Simons M, Riches P, Rowe P, Biant LC. Health costs and efficiencies of patient-specific and single-use instrumentation in total knee arthroplasty: a randomised controlled trial. BMJ Open Qual. 2019;8:e000493. [DOI] [PMC free article] [PubMed] [Google Scholar]
- 5.Barrack RL, Ruh EL, Williams BM, Ford AD, Foreman K, Nunley RM. Patient specific cutting blocks are currently of no proven value. J Bone Joint Surg Br. 2012;94:95-99. [DOI] [PubMed] [Google Scholar]
- 6.Bayliss LE, Culliford D, Monk, et al. The effect of patient age at intervention on risk of implant revision after total replacement of the hip or knee: a population-based cohort study. Lancet. 2017;389:1424-1430. [DOI] [PMC free article] [PubMed] [Google Scholar]
- 7.Bellemans J, Vandenneucker H, Vanlauwe J. Robot-assisted total knee arthroplasty. Clin Orthop Relat Res. 2007;464:111-116. [DOI] [PubMed] [Google Scholar]
- 8.Bhandari M, Smith J, Miller LE, Block JE. Clinical and economic burden of revision knee arthroplasty. Clin Med Insights Arthritis Musculoskelet Disord. 2012;5:89-94. [DOI] [PMC free article] [PubMed] [Google Scholar]
- 9.Bouché PA, Corsia S, Dechartres A, Resche-Rigon M, Nizard R. Are there differences in accuracy or outcomes scores among navigated, robotic, patient-specific instruments or standard cutting guides in TKA? A network meta-analysis. Clin Orthop Relat Res. 2020;478:2105-2116. [DOI] [PMC free article] [PubMed] [Google Scholar]
- 10.Boyce L, Prasad A, Barrett M, et al. The outcomes of total knee arthroplasty in morbidly obese patients: a systematic review of the literature. Arch Orthop Trauma Surg. 2019;139:553-560. [DOI] [PMC free article] [PubMed] [Google Scholar]
- 11.Canadian Institute for Health Information. Hip and Knee Replacements in Canada: CJRR Quick Stats, 2018–2019. Available at: https://www.cihi.ca/sites/default/files/document/cjrr-hip-knee-qs-2018-en.xlsx. Accessed August 28, 2021.
- 12.Chawla H, Nwachukwu BU, van der List JP, et al. Cost effectiveness of patellofemoral versus total knee arthroplasty in younger patients. Bone Joint J. 2017;99:1028-1036. [DOI] [PubMed] [Google Scholar]
- 13.Cho KJ, Seon JK, Jang WY, Park CG, Song EK. Robotic versus conventional primary total knee arthroplasty: clinical and radiological long-term results with a minimum follow-up of ten years. Int Orthop. 2019;43:1345-1354. [DOI] [PubMed] [Google Scholar]
- 14.Christen B, Tanner L, Ettinger M, Bonnin MP, Koch PP, Calliess T. Comparative cost analysis of four different computer-assisted technologies to implant a total knee arthroplasty over conventional instrumentation. J Pers Med. 2022;12:184. [DOI] [PMC free article] [PubMed] [Google Scholar]
- 15.Cip J, Obwegeser F, Benesch T, Bach C, Ruckenstuhl P, Martin A. Twelve-year follow-up of navigated computer-assisted versus conventional total knee arthroplasty: a prospective randomized comparative trial. J Arthroplasty. 2018;33:1404-1411. [DOI] [PubMed] [Google Scholar]
- 16.Cool CL, Jacofsky DJ, Seeger KA, Sodhi N, Mont MA. A 90-day episode-of-care cost analysis of robotic-arm assisted total knee arthroplasty. J Comp Eff Res. 2019;8:327-336. [DOI] [PubMed] [Google Scholar]
- 17.Cotter EJ, Wang J, Illgen RL. Comparative cost analysis of robotic-assisted and jig-based manual primary total knee arthroplasty. J Knee Surg. 2022;35:176-184. [DOI] [PubMed] [Google Scholar]
- 18.D’Amato M, Ensini A, Leardini A, Barbadoro P, Illuminati A, Belvedere C. Conventional versus computer-assisted surgery in total knee arthroplasty: comparison at ten years follow-up. Int Orthop. 2019;43:1355-1363. [DOI] [PubMed] [Google Scholar]
- 19.DeHaan AM, Adams JR, DeHart ML, Huff TW. Patient-specific versus conventional instrumentation for total knee arthroplasty: peri-operative and cost differences. J Arthroplasty. 2014;29:2065-2069. [DOI] [PubMed] [Google Scholar]
- 20.Dong H, Buxton M. Early assessment of the likely cost-effectiveness of a new technology: a Markov model with probabilistic sensitivity analysis of computer-assisted total knee replacement. Int J Technol Assess Health Care. 2006;22:191-202 [DOI] [PubMed] [Google Scholar]
- 21.Dubois RW. Cost-effectiveness thresholds in the USA: are they coming? Are they already here? J Comp Eff Res. 2016;5:9-11. [DOI] [PubMed] [Google Scholar]
- 22.Evans JT, Walker RW, Evans JP, Blom AW, Sayers A, Whitehouse MR. How long does a knee replacement last? A systematic review and meta-analysis of case series and national registry reports with more than 15 years of follow-up. Lancet. 2019;393:655-663. [DOI] [PMC free article] [PubMed] [Google Scholar]
- 23.Goh GSH, Liow MHL, Lim WSR, Tay DKJ, Yeo SJ, Tan MH. Accelerometer-based navigation is as accurate as optical computer navigation in restoring the joint line and mechanical axis after total knee arthroplasty. A prospective matched study. J Arthroplasty. 2016;31:92-97. [DOI] [PubMed] [Google Scholar]
- 24.Gøthesen Ø, Slover J, Havelin L, Askildsen JE, Malchau H, Furnes O. An economic model to evaluate cost-effectiveness of computer assisted knee replacement surgery in Norway. BMC Musculoskelet Disord. 2013;14:202. [DOI] [PMC free article] [PubMed] [Google Scholar]
- 25.Hickey MD, Anglin C, Masri B, Hodgson AJ. How large a study is needed to detect TKA revision rate reductions attributable to robotic or navigated technologies? A simulation-based power analysis. Clin Orthop Relat Res. 2021;479:2350-2361. [DOI] [PMC free article] [PubMed] [Google Scholar]
- 26.Hsu RWW, Hsu WH, Shen WJ, Hsu WB, Chang SH. Comparison of computer-assisted navigation and conventional instrumentation for bilateral total knee arthroplasty: the outcomes at mid-term follow-up. Medicine (Baltimore). 2019;98:e18083. [DOI] [PMC free article] [PubMed] [Google Scholar]
- 27.Jenny J-Y, Saragaglia D, Bercovy M, et al. Navigation improves the survival rate of mobile-bearing total knee arthroplasty by severe preoperative coronal deformity: a propensity matched case–control comparative study. J Knee Surg. 2020;34:1080-1084. [DOI] [PubMed] [Google Scholar]
- 28.Jeon SW, Kim K il, Song SJ. Robot-assisted total knee arthroplasty does not improve long-term clinical and radiologic outcomes. J Arthroplasty. 2019;34:1656-1661. [DOI] [PubMed] [Google Scholar]
- 29.Kamath AF, Ong KL, Lau E, et al. Quantifying the burden of revision total joint arthroplasty for periprosthetic infection. J Arthroplasty. 2015;30:1492-1497. [DOI] [PubMed] [Google Scholar]
- 30.Kayani B, Konan S, Ayuob A, Onochie E, Al-Jabri T, Haddad FS. Robotic technology in total knee arthroplasty: a systematic review. EFORT Open Rev. 2019;4:611-617. [DOI] [PMC free article] [PubMed] [Google Scholar]
- 31.Kim YH, Park JW, Kim JS. 2017. Chitranjan S. Ranawat Award: Does computer navigation in knee arthroplasty improve functional outcomes in young patients? A randomized study. Clin Orthop Relat Res. 2018;476:6-15. [DOI] [PMC free article] [PubMed] [Google Scholar]
- 32.Kim YH, Yoon SH, Park JW. Does robotic-assisted TKA result in better outcome scores or long-term survivorship than conventional TKA? A randomized, controlled trial. Clin Orthop Relat Res. 2020;478:266-275. [DOI] [PMC free article] [PubMed] [Google Scholar]
- 33.Konopka JF, Lee Y, Su EP, McLawhorn AS. Quality-adjusted life years after hip and knee arthroplasty. JBJS Open Access. 2018;3:e0007. [DOI] [PMC free article] [PubMed] [Google Scholar]
- 34.Lee BS, Cho HI, Bin S il, Kim JM, Jo BK. Femoral component varus malposition is associated with tibial aseptic loosening after TKA. Clin Orthop Relat Res. 2018;476:400-407. [DOI] [PMC free article] [PubMed] [Google Scholar]
- 35.Liow MHL, Chin PL, Pang HN, Tay DKJ, Yeo SJ. THINK surgical TSolution-One®(Robodoc) total knee arthroplasty. SICOT J. 2017;3:63. [DOI] [PMC free article] [PubMed] [Google Scholar]
- 36.Mont MA, Cool C, Gregory D, Coppolecchia A, Sodhi N, Jacofsky DJ. Health care utilization and payer cost analysis of robotic arm assisted total knee arthroplasty at 30, 60, and 90 days. J Knee Surg. 2021;34:328-337. [DOI] [PubMed] [Google Scholar]
- 37.Novak EJ, Silverstein MD, Bozic KJ. The cost-effectiveness of computer-assisted navigation in total knee arthroplasty. J Bone Joint Surg Am. 2007;89:2389-2397. [DOI] [PubMed] [Google Scholar]
- 38.Okafor C, Hodgkinson B, Nghiem S, Vertullo C, Byrnes J. Cost of septic and aseptic revision total knee arthroplasty: a systematic review. BMC Musculoskelet Disord. 2021;22:706. [DOI] [PMC free article] [PubMed] [Google Scholar]
- 39.Ollivier M, Parratte S, Lino L, Flecher X, Pesenti S, Argenson JN. No benefit of computer-assisted TKA: 10-year results of a prospective randomized study. Clin Orthop Relat Res. 2018;476:126-134. [DOI] [PMC free article] [PubMed] [Google Scholar]
- 40.Ouanezar H, Franck F, Jacquel A, Pibarot V, Wegrzyn J. Does computer-assisted surgery influence survivorship of cementless total knee arthroplasty in patients with primary osteoarthritis? A 10-year follow-up study. Knee Surg Sports Traumatol Arthrosc. 2016;24:3448-3456. [DOI] [PubMed] [Google Scholar]
- 41.Pierce J, Needham K, Adams C, Coppolecchia A, Lavernia C. Robotic arm-assisted knee surgery: an economic analysis. Am J Manag Care. 2020;26:E205-E210. [DOI] [PubMed] [Google Scholar]
- 42.Ponnusamy KE, Vasarhelyi EM, Somerville L, McCalden RW, Marsh JD. Cost-effectiveness of total knee arthroplasty vs nonoperative management in normal, overweight, obese, severely obese, morbidly obese, and super-obese patients: a Markov model. J Arthroplasty. 2018;33:S32-S38. [DOI] [PubMed] [Google Scholar]
- 43.Rajan PV, Khlopas A, Klika A, Molloy R, Krebs V, Piuzzi NS. The cost-effectiveness of robotic-assisted versus manual total knee arthroplasty: a Markov model-based evaluation. J Am Acad Orthop Surg. 2022;30:168-176. [DOI] [PubMed] [Google Scholar]
- 44.Ren Y, Cao S, Wu J, Weng X, Feng B. Efficacy and reliability of active robotic-assisted total knee arthroplasty compared with conventional total knee arthroplasty: a systematic review and meta-analysis. Postgrad Med J. 2019;95:125-133. [DOI] [PMC free article] [PubMed] [Google Scholar]
- 45.Samuel LT, Karnuta JM, Banerjee A, et al. Robotic arm-assisted versus manual total knee arthroplasty: a propensity score-matched analysis. J Knee Surg. Published online June 29, 2021. DOI: 10.1055/s-0041-1731323. [DOI] [PubMed] [Google Scholar]
- 46.Shah R, Diaz A, Phieffer L, et al. Robotic total knee arthroplasty: a missed opportunity for cost savings in bundled payment for care improvement initiatives? Surgery. 2021;170:134-139. [DOI] [PubMed] [Google Scholar]
- 47.Shah SM. After 25 years of computer-navigated total knee arthroplasty, where do we stand today? Arthroplasty. 2021;3:41. [DOI] [PMC free article] [PubMed] [Google Scholar]
- 48.Sharkey PF, Lichstein PM, Shen C, Tokarski AT, Parvizi J. Why are total knee arthroplasties failing today-has anything changed after 10 years? J Arthroplasty. 2013;29:1774-1778. [DOI] [PubMed] [Google Scholar]
- 49.Slover JD, Tosteson ANA, Bozic KJ, Rubash HE, Malchau H. Impact of hospital volume on the economic value of computer navigation for total knee replacement. J Bone Joint Surg Am. 2008;90:1492-1500. [DOI] [PMC free article] [PubMed] [Google Scholar]
- 50.Song EK, Seon JK, Yim JH, Netravali NA, Bargar WL. Robotic-assisted TKA reduces postoperative alignment outliers and improves gap balance compared to conventional TKA knee. Clin Orthop Relat Res. 2013;471:118-126. [DOI] [PMC free article] [PubMed] [Google Scholar]
- 51.Srivastava K, Bozic KJ, Silverton C, Nelson AJ, Makhni EC, Davis JJ. Reconsidering strategies for managing chronic periprosthetic joint infection in total knee arthroplasty: using decision analytics to find the optimal strategy between one-stage and two-stage total knee revision. J Bone Joint Surg Am. 2019;101:14-24. [DOI] [PubMed] [Google Scholar]
- 52.Steffens D, Karunaratne S, McBride K, Gupta S, Horsley M, Fritsch B. Implementation of robotic-assisted total knee arthroplasty in the public health system: a comparative cost analysis. Int Orthop. 2022;46:481-488. [DOI] [PubMed] [Google Scholar]
- 53.Teeter M, Marsh J, Howard J. A randomized controlled trial investigating the value of patient-specific instrumentation for total knee arthroplasty in the Canadian healthcare system. Bone Joint J. 2019;101:565-572. [DOI] [PubMed] [Google Scholar]
- 54.Tew M, Dalziel K, Clarke P, Smith A, Choong PF, Dowsey M. Patient-reported outcome measures (PROMs): can they be used to guide patient-centered care and optimize outcomes in total knee replacement? Qual Life Res. 2020;29:3273-3283. [DOI] [PubMed] [Google Scholar]
- 55.Tohidi M, Brogly SB, Lajkosz K, Grant HJ, Vandenkerkhof EG, Campbell AR. Ten-year mortality and revision after total knee arthroplasty in morbidly obese patients. J Arthroplasty. 2018;33:2518-2523. [DOI] [PubMed] [Google Scholar]
- 56.Trieu J, Schilling C, Dowsey MM, Choong PF. The cost-effectiveness of computer navigation in primary total knee replacement: a scoping review. EFORT Open Rev. 2021;6:173-180. [DOI] [PMC free article] [PubMed] [Google Scholar]
- 57.Ueyama H, Kanemoto N, Minoda Y, Yamamoto N, Taniguchi Y, Nakamura H. Long-term clinical outcomes of medial pivot total knee arthroplasty for Asian patients: a mean 10-year follow-up study. Knee. 2020;27:1778-1786. [DOI] [PubMed] [Google Scholar]
- 58.Social Security Administration. Actuarial life table. Available at: https://www.ssa.gov/oact/STATS/table4c6_2016.html. Accessed August 4, 2020.
- 59.Vermue H, Tack P, Gryson T, Victor J. Can robot-assisted total knee arthroplasty be a cost-effective procedure? A Markov decision analysis. Knee. 2021;29:345-352. [DOI] [PubMed] [Google Scholar]
- 60.Watters TS, Mather RC, 3rd, Browne JA, Berend KR, Lombardi AV, Jr, Bolognesi MP. Analysis of procedure-related costs and proposed benefits of using patient-specific approach in total knee arthroplasty. J Surg Orthop Adv. 2011;20:112. [PubMed] [Google Scholar]
- 61.van der Woude JAD, Nair SC, Custers RJH, et al. Knee joint distraction compared to total knee arthroplasty for treatment of end stage osteoarthritis: simulating long-term outcomes and cost-effectiveness. PLoS One. 2016;11:e0155524. [DOI] [PMC free article] [PubMed] [Google Scholar]
- 62.Yang HY, Seon JK, Shin YJ. Robotic total knee arthroplasty with a cruciate-retaining implant: a 10-year follow-up study. Clin Orthop Surg. 2017;9:169-176. [DOI] [PMC free article] [PubMed] [Google Scholar]
- 63.Zhu M, Ang CL, Yeo SJ, Lo NN, Chia SL, Chong HC. Minimally invasive computer-assisted total knee arthroplasty compared with conventional total knee arthroplasty: a prospective 9-year follow-up. J Arthroplasty. 2016;31:1000-1004. [DOI] [PubMed] [Google Scholar]