Abstract
Background:
There are few models to predict the survival of patients of different ethnicities initially diagnosed with metastatic gastric cancer (mGC). Therefore, the aim of this study was to construct a nomogram to predict the cancer-specific survival (CSS) of these patients.
Methods:
Data for 994 patients initially diagnosed with mGC between 2000 and 2013 were extracted from the Surveillance, Epidemiology, and End Results database. Patients were randomly classified into a training (n = 696) or internal validation (n = 298) cohort, and a cohort of 133 patients from Fudan cohort was used for external validation. A nomogram to predict the CSS of mGC patients was derived and validated using a concordance index (C-index), calibration curves, and decision-curve analysis (DCA).
Results:
Multivariate Cox regression indicated that five factors were independent predictors of CSS: differentiation grade, T stage, N stage, metastatic site at diagnosis, and with or without chemotherapy. Thus, these factors were integrated into the nomogram model. The C-index value of the nomogram model was 0.63 (95% CI: 0.60–0.65), and those of the internal and external validation cohorts were 0.60 (95%: CI 0.55–0.64) and 0.63 (95%: CI 0.57–0.69), respectively. The calibration curves showed good consistency between the actual and predicted survival rates in both the internal and external validation cohorts. The DCA also showed the clinical utility of the nomogram model.
Conclusions:
We established a practical nomogram to predict the CSS of patients initially diagnosed with mGC. The nomogram can be used for individualized prediction of survival and to guide clinicians in making treatment decisions.
Keywords: Metastatic gastric cancer, prognostic model, nomogram, cancer-specific survival, chemotherapy
Background
Despite a decline in the incidence of gastric cancer (GC) in recent decades, it remains the fourth leading cause of cancer-related death. Worldwide, more than 1 000 000 new cases are diagnosed annually, and about 769 000 patients die from GC each year; in China, there are about 478 000 new cases and 373 000 deaths each year.1 Treatment selection for GC is dependent mainly on the tumor stage; the only potentially curative treatment is surgery with extended lymphadenectomy or microscopically negative margins.2,3
Although great progress has been made in neoadjuvant chemoradiotherapy, lymph node dissection, and molecular targeted therapy,4-6 most patients are diagnosed at an advanced stage, especially in China, where nearly 90% of GC patients are diagnosed with advanced or metastatic disease.7 The prognosis of patients with metastatic GC (mGC) is poor; median survival is between 6 and 12 months,8 and the 5-year survival rate is only 3.1%.9 Mortality risk assessments for GC patients are typically based on the American Joint Committee on Cancer (AJCC) tumor-node-metastasis (TNM) staging system. Of note, there is substantial heterogeneity among patients with GC in terms of demographic and clinicopathological characteristics, such as age, sex, differentiation grade, tumor size, therapeutic regimen applied, and clinicopathological features, all of which can influence patient outcomes. In clinical practice, good decision-making, risk classification, and clinical trial design, as well as accurate prognoses, are needed to identify high-risk patient groups. A nomogram is a convenient model that uses an algorithm composed of several variables to predict the outcomes of patients with cancer.10 Multivariate nomogram models have been developed to predict outcomes in many types of cancer, and they perform better than the AJCC TNM staging system.11-13 Although many nomograms based on different databases have been constructed to predict the survival of individuals with GC,14-16 few studies were designed to predict survival in patients initially diagnosed with mGC.
Therefore, this study aimed to construct and validate a novel nomogram model to predict the cancer-specific survival (CSS) of patients with mGC, using cohorts from the Surveillance, Epidemiology, and End Results (SEER) database and our center.
Methods
Data source and inclusion criteria
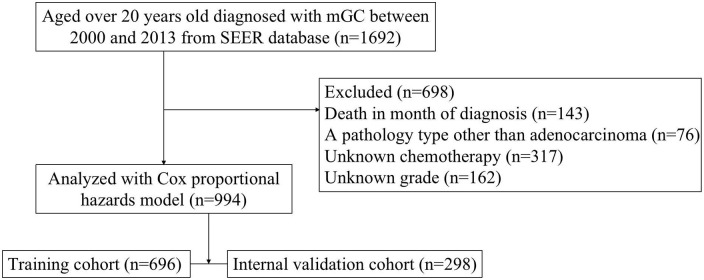
We identified GC cases in the SEER database of the National Cancer Institute (http://seer.cancer.gov/). The SEER program is an open-access population-based cancer registry that contains data from 18 registries in 14 states across the United States, covering approximately 28% of the U.S. population. The inclusion criteria for this study were: patients diagnosed with GC between 2000 and 2013, and aged over 20 years old; and confirmed distant metastasis to organs and/or lymph nodes at the time of initial diagnosis based on the eighth edition of the AJCC TNM staging system. The exclusion criteria were a pathology type other than adenocarcinoma; and missing data, such as T stage, N stage, primary site, tumor size, metastatic site, survival duration (months), or chemotherapy status (Figure 1). Ultimately, 994 mGC patients were enrolled and classified randomly into a training (n = 696) or internal validation (n = 298) cohort.
Figure 1.
Flowchart of patient inclusion.
mGC, metastatic gastric cancer; SEER, Surveillance, Epidemiology, and End Results.
An external validation cohort of 133 patients diagnosed with mGC at the Affiliated Shanghai Fifth People’s Hospital of Fudan University (FUSFPH) (or the Fudan University Shanghai Cancer Center, Minhang Branch (FUSCC) between 2016 and 2018 was used to examine the generalizability of the nomogram model. All patients had received multi-disciplinary treatment (MDT) and chemotherapy regimens including Xelox, epirubicin, cisplatin and fluorouracil, epirubicin, oxaliplatin and fluorouracil, docetaxel, cisplatin and fluorouracil. All GCs were initially diagnosed with at least one distant metastasis by Computed Tomography or positron emission tomography Computed Tomography scan, including peritoneal, hepatic, renal, pancreatic, and ovarian. The last follow-up was on June 16, 2019. This study was approved by the Ethics Committee and Institutional Review Board of FUSFPH and FUSCC.
Endpoint definition
GC-specific death was defined as death from GC as the underlying cause according to the SEER database. The endpoint of the current study was CSS, which was the interval between the initial diagnosis of GC and the occurrence of GC-specific death.
Statistical analysis
Nomogram construction
Eligible stage-Ⅳ patients drawn from the SEER database were randomly allocated to a training or internal validation cohort to establish and validate the nomogram. In the training set, CSS data were assessed using the Kaplan-Meier method and the log-rank test. Factors with a P-value < 0.05 in the univariate analyses were subjected to multivariate Cox proportional hazard regression; finally, based on the results of the multivariate analysis, a nomogram was built using R software 3.5.3 (R Development Core Team, Vienna, Austria) with the rms and survival packages.
Nomogram validation and calibration
The dataset of the SEER database was divided into training and internal validation cohorts at a ratio of 7:3. The external validation cohort comprised patient data from Fudan University; three-fold cross-validation was used for validation. The bootstrap validation used 1 000 samples with a sample size of 200. The nomogram model was subjected to bootstrap validation (training cohort), independent validation (internal validation cohort from the SEER database), and external validation (Fudan University cohort). The discriminatory ability of the nomogram was evaluated using a concordance index (C-index), calibration curves, and decision-curve analysis (DCA). Harrell’s C-index was used to assess the predictive accuracy and discriminative ability of the nomogram model.17 Calibration curves comparing the mean predicted and actual CSS survival rates were generated. DCA was also used to assess the clinical utility of the novel nomogram.
The statistical analyses were performed using SPSS (ver. 25.0; IBM Corp., Armonk, NY, USA) and R software (ver. 3.5.3). Data extraction was performed using SEER*Stat software version 8.3.5 (www.seer.cancer.gov/seerstat). Demographic variables, including age, sex, race, stage, primary site, and with/without chemotherapy, were compared using the Chi-square test. Variables that differed significantly between groups on log-rank tests at P < 0.05 were included in the multivariate Cox proportional hazard regression analysis. P-values < 0.05 were considered statistically significant in all tests.
Results
Baseline characteristics
In total, 994 patients from the SEER database and 133 patients initially diagnosed with mGC at FUSFPH or FUSCC met the inclusion criteria for this study. All cases were confirmed to have mGC at the initial diagnosis. All eligible cases from the SEER database were randomly assigned to the training (696, 70%) or internal validation (298, 30%) cohort to establish and validate the nomogram; the cohort drawn from Fudan University was used for external validation. The median (interquartile range [IQR]) follow-up times for CSS were 9 (4–19), 10 (5–17), and 14 (7–26) months for the training, internal validation, and external validation cohorts, respectively. Table 1 summarizes the baseline characteristics and treatment regimens of all patients.
Table 1.
Demographics and clinicopathological variables of the training, internal validation, and external validation set.
| Characteristics | Training cohort (n = 696) | Internal validation cohort (n = 298) | External validation cohort (n = 133) | |||
|---|---|---|---|---|---|---|
| N | % | N | % | N | % | |
| Age (years) | ||||||
| <65 | 353 | 50.7 | 159 | 53.4 | 110 | 82.7 |
| ⩾65 | 343 | 49.3 | 139 | 46.6 | 23 | 17.3 |
| Sex | ||||||
| Male | 421 | 60.5 | 182 | 61.1 | 66 | 49.6 |
| Female | 275 | 39.5 | 116 | 38.9 | 67 | 50.4 |
| Race | ||||||
| White | 450 | 64.7 | 192 | 64.4 | - | - |
| Other | 246 | 35.3 | 106 | 35.6 | - | - |
| Grade | ||||||
| Well/moderately differentiated | 149 | 21.4 | 67 | 22.5 | 19 | 14.3 |
| Poorly differentiated | 547 | 78.6 | 231 | 77.5 | 114 | 85.7 |
| T stage | ||||||
| 1 + 2 | 47 | 6.8 | 22 | 7.4 | 11 | 8.3 |
| 3 + 4 | 649 | 93.2 | 276 | 92.6 | 122 | 91.7 |
| N stage | ||||||
| 0 + 1 | 342 | 49.1 | 138 | 46.3 | 46 | 34.6 |
| 2 + 3 | 354 | 50.9 | 160 | 53.7 | 87 | 65.4 |
| Tumor site | ||||||
| Proximal third | 129 | 18.5 | 46 | 15.4 | 22 | 16.5 |
| Mid third | 170 | 24.4 | 77 | 25.8 | 39 | 29.3 |
| Distal third | 259 | 37.2 | 110 | 37 | 42 | 31.6 |
| Greater curvature | 48 | 7 | 16 | 5.4 | 22 | 16.5 |
| Overlapping | 90 | 12.9 | 49 | 16.4 | 8 | 6 |
| Metastatic sites | ||||||
| Distant lymph node(s) only | 105 | 15.1 | 40 | 13.4 | 17 | 12.8 |
| Organ | 538 | 77.3 | 230 | 77.2 | 94 | 70.7 |
| Overlapping | 53 | 7.6 | 28 | 9.4 | 22 | 16.5 |
| Chemotherapy | ||||||
| With | 375 | 53.9 | 161 | 54 | 122 | 91.7 |
| Without | 321 | 46.1 | 137 | 46 | 11 | 8.3 |
| Tumor size (cm) | ||||||
| ⩽60 | 364 | 52.3 | 163 | 54.7 | 67 | 50.4 |
| >60 | 332 | 47.7 | 135 | 45.3 | 66 | 49.6 |
Independent prognostic factors in the training cohort
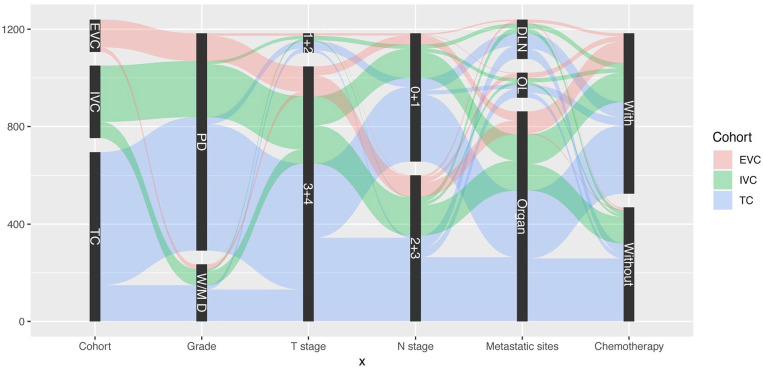
Univariate analysis indicated that age, differentiation grade, clinical T stage, N stage, metastatic site at diagnosis, and chemotherapy were associated with patients’ prognoses. Factors with a P-value < 0.05 in the univariate analyses were included in the multivariate Cox regression model. The multivariate analysis identified differentiation grade (P < 0.001), T stage (P < 0.05), N stage (P < 0.001), metastatic site at diagnosis (P < 0.001), and chemotherapy (P < 0.001) as independent predictors of CSS; these were all included in the predictive model (Table 2). Figure 2 provides a graphical summary of the distributions and associations of the five independent prognostic factors according to cohort.
Table 2.
Univariate and Cox proportional hazards regression analyses of each factor’s using the training cohort.
| Variable | Number of patients | CSS (%) | Univariate | Multivariate | |||
|---|---|---|---|---|---|---|---|
| Log-rank test | P | Hazard Ratio | 95% CI | P | |||
| Age (years) | 4.007 | 0.045 | |||||
| <65 | 353 | 20.4 | 1 | ||||
| ⩾65 | 343 | 15.7 | 1.107 | 0.928–1.322 | 0.259 | ||
| Sex | 0.960 | 0.327 | |||||
| Male | 421 | 20.0 | |||||
| Female | 275 | 15.3 | |||||
| Race | 2.554 | 0.11 | |||||
| White | 450 | 16.0 | |||||
| Other | 246 | 22.0 | |||||
| Grade | 14.943 | 0 | |||||
| Well/moderately differentiated | 149 | 26.2 | 1 | ||||
| Poorly differentiated | 547 | 15.9 | 1.473 | 1.188–1.827 | 0 | ||
| T stage | 16.975 | 0 | |||||
| 1 + 2 | 47 | 48.9 | 1 | ||||
| 3 + 4 | 649 | 15.9 | 1.94 | 1.278–2.945 | 0.002 | ||
| N stage | 7.418 | 0.006 | |||||
| 0 + 1 | 342 | 21.3 | 1 | ||||
| 2 + 3 | 354 | 15.0 | 1.226 | 1.034–1.455 | 0.019 | ||
| Tumor site | 7.013 | 0.135 | |||||
| Proximal third | 129 | 21.7 | |||||
| Mid third | 170 | 17.6 | |||||
| Distal third | 259 | 17.8 | |||||
| Greater curvature | 48 | 12.5 | |||||
| Overlapping | 90 | 17.8 | |||||
| Metastatic sites | 15.498 | 0 | |||||
| Distant lymph node(s) only | 105 | 28.6 | 1 | ||||
| Organ | 538 | 16.2 | 1.603 | 1.252–2.054 | 0 | ||
| Overlapping | 53 | 17.0 | 1.47 | 1.010–2.141 | 0.044 | ||
| Chemotherapy | 17.606 | 0 | |||||
| With | 375 | 18.7 | 1 | ||||
| Without/unknown | 321 | 17.4 | 1.495 | 1.254–1.783 | 0 | ||
| Tumor size (cm) | 1.510 | 0.219 | |||||
| ⩽60 | 364 | 16.8 | |||||
| >60 | 332 | 19.6 | |||||
CSS, cancer-specific survival.
Figure 2.
Graphical summary of differentiation grade, T stage, N stage, metastatic site at diagnosis, and chemotherapy status by cohort.
DLN, distant lymph node(s) only; EVC, external validation cohort; IVC, internal validation cohort; OL, overlapping; PD, poorly differentiated; TC, training cohort; W/MD, well/moderately differentiated.
Prognostic nomogram for CSS
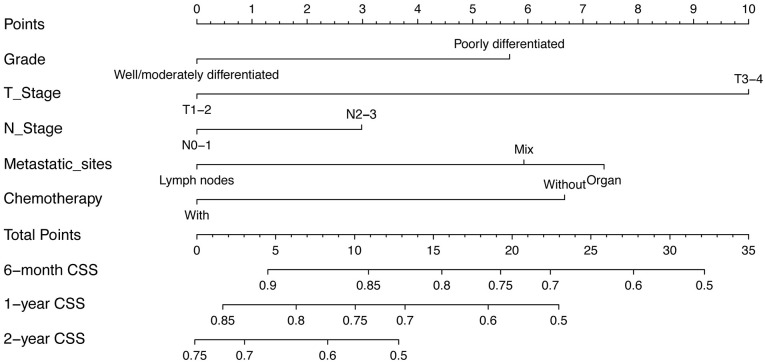
The predictive model was in the form of a nomogram. The significant independent factors of differentiation grade, T stage, N stage, metastatic site at diagnosis, and chemotherapy were used to establish the nomogram (Figure 3). T stage made the largest contribution to prognosis, followed by metastatic site at diagnosis and chemotherapy. Differentiation grade and N stage had moderate impacts on survival. Each variable was assigned a score ranging from 0 to 10, depicted at the top of the nomogram; after calculating the total score and locating it on the “Total Points” scale, a straight line was drawn down at different times relative to the date of diagnosis to determine the estimated survival.
Figure 3.
Nomogram predicting the 6-month, 1-year, and 2-year CSS of patients initially diagnosed with mGC. For every patient, the points assigned to the 0–10 scale at the top of the nomogram for each predictor are summed; the “Total Points” scale can then be referred to for prediction of the 6-month, 1-year, and 2-year CSS.
CSS, cancer-specific survival.
Calibration and validation of the nomogram
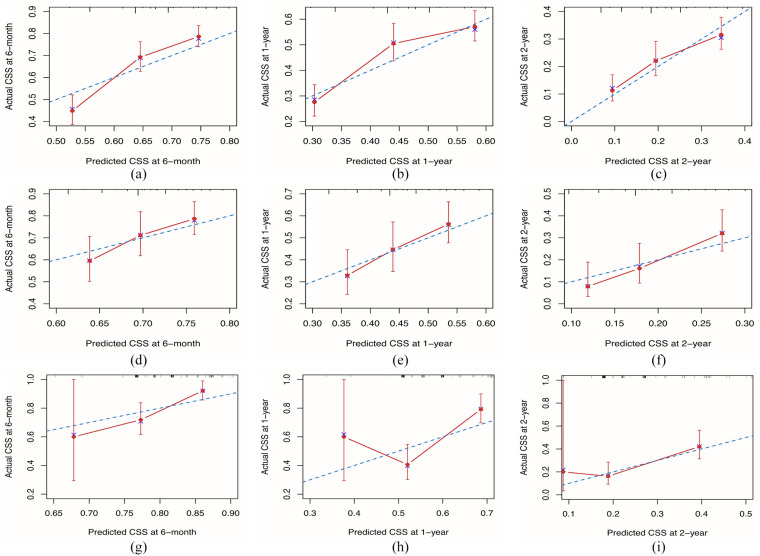
For the training cohort, Harrell’s C-index value was 0.63 (95% CI: 0.60–0.65), reflecting the good discriminative ability of the model. The calibration curves also showed good consistency at 6 months, 1 year, and 2 years in terms of the observations and nomogram predictions with respect to CSS (Figure 4A to C). For the internal validation cohort, the C-index value was 0.60 (95% CI 0.55–0.64), and the calibration plots showed acceptable agreement between the nomogram predictions and observations with respect to CSS at 6 months, 1 year, and 2 years CSS (Figure 4D to F). For the external validation cohort, the C-index value was 0.63 (95% CI 0.57–0.69) (Figure 4G to I].
Figure 4.
Calibration of the nomogram at 6 months, 1 year, and 2 years in the training, internal validation, and external validation cohorts. The nomogram-predicted CSS is plotted on the x-axis and the actual CSS is plotted on the y-axis. The 45° line indicates a perfect prediction model. The 6-month, 1-year, and 2-year CSS rates of the (A to C) training, (D to F) internal validation, and (G to I) external validation cohorts. CSS, cancer-specific survival.
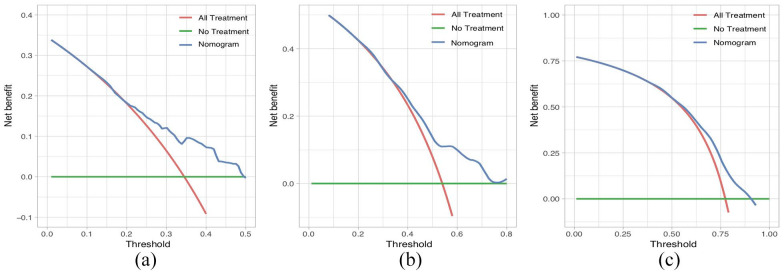
CSS based on the DCA, the nomogram model showed clinical utility at various time points (Figure 5A to C].
Figure 5.
Decision-curve analysis of the nomogram with respect to predicting CSS. Decision-curve analysis was used to determine the clinical utility of the nomogram with respect to prediction of CSS at the 6-month (A), 1-year (B), and 2-year (C) time points, based on the data of the primary cohort. The horizontal green line corresponds to no cancer-specific deaths, and the solid red line assumes that all patients died from cancer. The blue line represents the net benefit of using the nomogram.
CSS indicates cancer-specific survival.
Discussion
Despite clinicians’ greater knowledge of mGC and its treatment, the prognosis remains poor. Systemic chemotherapy with or without biologic agents is the current standard treatment for mGC.18 Several nomograms have been built to predict the prognosis of GC patients, but there are few predictive models for patients with stage-Ⅳ GC. Here, we established and validated a nomogram to predict the CSS of patients with mGC based on the patients’ clinicopathological characteristics and treatment regimens. We established and validated this nomogram using patient data drawn from the SEER database and from our center, and the calibration curves showed good consistency between the nomogram predictions and actual observations.
National Comprehensive Cancer Network guidelines recommend chemotherapy as the first-line treatment for patients with mGC, advanced GC, or recurrent GC. Palliative chemotherapy can prolong OS and improve quality of life.19 Notably, we found that chemotherapy was a strong predictor of CSS, consistent with previous studies. Unfortunately, details of the chemotherapy regimens could not be obtained from the SEER database. However, a recent retrospective study found that the type of chemotherapy regimen did not significantly affect the OS of patients with mGC, while an interval exceeding 6.1 months between the start of first- and second-line chemotherapy independently predicted improved (OS).20 However, the interval between first- and second-line chemotherapy is not specified in the SEER database, so subgroup analyses according to chemotherapy regimen could not be performed.
While not designed for patients initially diagnosed with metastatic GC, Ma et al built a nomogram model for mortality risk stratification in patients with advanced GC that included mucinous or non-mucinous histology, Eastern Cooperative Oncology Group score, bone metastasis, ascites, hemoglobin concentration, serum albumin level, lactate dehydrogenase level, carcinoembryonic antigen level, and chemotherapy treatment.21 Hannah et al reported that the Viennese risk prediction score for Advanced Gastroesophageal carcinoma based on Alarm Symptoms could be used at the time of initial diagnosis of patients with metastatic gastro-esophageal cancer. The score system comprises five factors: stenosis in endoscopy, weight loss, HER2 positivity, dyspepsia, and ulcer or active bleeding; the model was applied not only to GC but also to esophageal cancer.22 Lee et al developed and validated a newly constructed risk-scoring system that considered serum neutrophil-lymphocyte ratio, alkaline phosphatase level, albumin level, performance status, and histologic differentiation to predict the OS of patients with advanced GC undergoing first-line fluoropyrimidine and platinum-based combination chemotherapy. The model was intended for patients with advanced or mGC who had received first-line chemotherapy containing fluoro-pyrimidine and platinum agents,23 not for those initially diagnosed with mGC. A nomogram built by Kim et al incorporated 13 baseline clinicopathological variables to predict the survival of patients with unresectable or mGC who received combination cytotoxic chemotherapy as first-line treatment.24 A Canadian study of 1 433 patients with mGC included several variables that had not been analyzed previously and found that age, sex, tumor location, presence of carcinomatosis or ascites, number of metastatic organs, chemotherapy, and consultation with a high-volume specialist were independent predictors of OS.25 The significance of results regarding the number of metastatic organs and chemotherapy was consistent with our study, whereas age, sex, and tumor location were not independent predictors of survival in our nomogram. However, that study did not include data on differentiation grade, T stage, or N stage, which are also important for predicting survival. In addition, the weighting of the factors was not described, whereas our prediction model uses a graphical algorithm to predict outcomes based on the prognostic importance of the variables.
Although several studies have reported prognostic factors or models of mGC, few nomograms have been developed for the eighth edition of the AJCC TNM staging system, and the applicability of various biomarkers and inflammatory status in clinical practice remains unclear. In contrast, the clinical variables included in our nomogram can be measured relatively easily and cost-effectively; thus, our nomogram is a more economical and practical option for use worldwide.
This study had several limitations. First, a retrospective design was used based on analysis of the SEER database and a cohort from our center, rather than a prospective cohort study design; thus, selection bias was inevitable. Second, our nomogram included only five clinicopathological factors; additional pathological, biological, and molecular factors that may compromise the prognosis of mGC were not included in our model because the data were not available in the SEER database. Third, since the training and internal validation cohorts used data from the United States whereas the external validation cohort used Chinese data, racial characteristics may have affected the results. Fourth, the median follow-up times differed between cohorts, which could have led to inaccuracies in the CSS. Moreover, detailed chemotherapy regimens could not be obtained, which hindered more in-depth prognostic analyses. Finally, all patients enrolled in the external validation cohort were drawn from a single institution in China; larger, multicenter prospective randomized controlled trials are needed to verify the efficacy of the nomogram.
Conclusions
In conclusion, we established and validated a practical nomogram that predicts the prognosis of patients with mGC. Although future multicenter studies are needed, our nomogram should prove useful as a guide for physicians with respect to prognostic evaluation and tailored treatment of mGC patients.
Acknowledgments
The authors acknowledge the efforts of the SEER Program tumor registry in the creation of the SEER database. We also greatly appreciate the technological help from the State Key Laboratory of Oncogenes and Related Genes (Shanghai Cancer Institute, Renji Hospital, Shanghai Jiao Tong University School of Medicine, Shanghai, China) for the statistical analysis.
Footnotes
The author(s) declared no potential conflicts of interest with respect to the research, authorship, and/or publication of this article.
Funding: The author(s) disclosed receipt of the following financial support for the research, authorship, and/or publication of this article: This work was supported by Shanghai Fifth People’s Hospital (grant numbers 2016WYRC01, 2017WYRCSG01); the Medical System of Shanghai Minhang District (grant number 2017MWDXK01); the Shanghai Minhang District Health and Family Planning Commission (grant number 2016MW03); Shanghai Minhang District Science and Technology Commission (grant number 2019MHZ054); and the Shanghai Minhang District Science and Technology Commission (grant number 2017MHZ02); Yangzhou Key Laboratory of Basic and Clinical Translation of Digestive/Metabolic Diseases (grant number YZ2020159).
Author Contributions: All authors contributed to the study conception and design. Material preparation, data collection and analysis were performed by Jun Ren, Yuedi Dai, Fei Chao, Jiawei Gu. The first draft of the manuscript was written by Jun Ren and all authors commented on previous versions of the manuscript. All authors read and approved the final manuscript. Jun Ren, Yuedi Dai and Fei Chao contributed equally to this work.
Availability of Data and Materials: The data analyzed during the current study are available from the corresponding author on reasonable request.
Ethics Approval and Consent to Participate: The study was approved by the ethical committee of Shanghai Fifth People’s Hospital affiliated to Fudan University and Fudan University Shanghai Cancer Center, Minhang Branch (ID: 2019118, December 25, 2019). The study was performed in accordance with the Declaration of Helsinki.
ORCID iDs: Dong Tang  https://orcid.org/0000-0002-2057-2968
Chongwei Ke  https://orcid.org/0000-0003-2148-4027
References
- 1. Sung H, Ferlay J, Siegel RL, et al. Global cancer statistics 2020: GLOBOCAN estimates of incidence and mortality worldwide for 36 cancers in 185 countries. CA Cancer J Clin. 2021;71:209-249. [DOI] [PubMed] [Google Scholar]
- 2. Wang FH, Shen L, Li J, et al. The Chinese Society of Clinical Oncology (CSCO): clinical guidelines for the diagnosis and treatment of gastric cancer. Cancer Commun. 2019;39:10. [DOI] [PMC free article] [PubMed] [Google Scholar]
- 3. Smyth EC, Verheij M, Allum W, Cunningham D, Cervantes A, Arnold D. Gastric cancer: ESMO Clinical Practice Guidelines for diagnosis, treatment and follow-up. Ann Oncol. 2016;27:v38-v49. [DOI] [PubMed] [Google Scholar]
- 4. Cunningham D, Allum WH, Stenning SP, et al. Perioperative chemotherapy versus surgery alone for resectable gastroesophageal cancer. N Engl J Med. 2006;355:11-20. [DOI] [PubMed] [Google Scholar]
- 5. Bang YJ, Kim YW, Yang HK, et al. Adjuvant capecitabine and oxaliplatin for gastric cancer after D2 gastrectomy (CLASSIC): a phase 3 open-label, randomised controlled trial. Lancet. 2012;379:315-321. [DOI] [PubMed] [Google Scholar]
- 6. Degiuli M, Sasako M, Ponti A, et al. Randomized clinical trial comparing survival after D1 or D2 gastrectomy for gastric cancer. Br J Surg. 2014;101:23-31. [DOI] [PubMed] [Google Scholar]
- 7. Shiozaki H, Shimodaira Y, Elimova E, et al. Evolution of gastric surgery techniques and outcomes. Chin J Cancer. 2016;35:69. [DOI] [PMC free article] [PubMed] [Google Scholar]
- 8. Hamamoto Y. Complications in advanced or recurrent gastric cancer patients with peritoneal metastasis during and after palliative systemic chemotherapy. Mol Clin Oncol. 2015;3:539-542. [DOI] [PMC free article] [PubMed] [Google Scholar]
- 9. Chau I, Norman AR, Cunningham D, Waters JS, Oates J, Ross PJ. Multivariate prognostic factor analysis in locally advanced and metastatic esophago—gastric cancer—pooled analysis from three multicenter, randomized, controlled trials using individual patient data. J Clin Oncol. 2004;22:2395-2403. [DOI] [PubMed] [Google Scholar]
- 10. Wang Y, Li J, Xia Y, et al. Prognostic nomogram for intrahepatic cholangiocarcinoma after partial hepatectomy. J Clin Oncol. 2013;31:1188-1195. [DOI] [PubMed] [Google Scholar]
- 11. Zeng Y, Mayne N, Yang CJ, et al. A nomogram for predicting cancer-specific survival of TNM 8th edition stage I non-small-cell lung cancer. Ann Surg Oncol. 2019;26:2053-2062. [DOI] [PubMed] [Google Scholar]
- 12. Fang C, Wang W, Feng X, et al. Nomogram individually predicts the overall survival of patients with gastroenteropancreatic neuroendocrine neoplasms. Br J Cancer. 2017;117:1544-1550. [DOI] [PMC free article] [PubMed] [Google Scholar]
- 13. Liang W, Zhang L, Jiang G, et al. Development and validation of a nomogram for predicting survival in patients with resected non-small-cell lung cancer. J Clin Oncol. 2015;33:861-869. [DOI] [PubMed] [Google Scholar]
- 14. Han DS, Suh YS, Kong SH, et al. Nomogram predicting long-term survival after d2 gastrectomy for gastric cancer. J Clin Oncol. 2012;30:3834-3840. [DOI] [PubMed] [Google Scholar]
- 15. Chen QY, Zhong Q, Wang W, et al. Development and external validation of a nomogram for predicting the conditional probability of survival after D2 lymphadenectomy for gastric cancer: a multicentre study. Eur J Surg Oncol. 2019;45:1934-1942. [DOI] [PubMed] [Google Scholar]
- 16. Dong D, Tang L, Li ZY, et al. Development and validation of an individualized nomogram to identify occult peritoneal metastasis in patients with advanced gastric cancer. Ann Oncol. 2019;30:431-438. [DOI] [PMC free article] [PubMed] [Google Scholar]
- 17. Iasonos A, Schrag D, Raj GV, Panageas KS. How to build and interpret a nomogram for cancer prognosis. J Clin Oncol. 2008;26:1364-1370. [DOI] [PubMed] [Google Scholar]
- 18. Wagner AD, Syn NL, Moehler M, et al. Chemotherapy for advanced gastric cancer. Cochrane Database Syst Rev. 2017;8:CD004064. [DOI] [PMC free article] [PubMed] [Google Scholar]
- 19. Cats A, Jansen EPM, Van Grieken NCT, et al. Chemotherapy versus chemoradiotherapy after surgery and preoperative chemotherapy for resectable gastric cancer (CRITICS): an international, open-label, randomised phase 3 trial. Lancet Oncol. 2018;19:616-628. [DOI] [PubMed] [Google Scholar]
- 20. Choi IS, Kim JH, Lee JH, et al. A population-based outcomes study of patients with metastatic gastric cancer receiving second-line chemotherapy: a nationwide health insurance database study. PLoS One. 2018;13:e0205853. [DOI] [PMC free article] [PubMed] [Google Scholar]
- 21. Ma T, Wu Z, Zhang X, et al. Development and validation of a prognostic scoring model for mortality risk stratification in patients with recurrent or metastatic gastric carcinoma. BMC Cancer. 2021;21:1326. [DOI] [PMC free article] [PubMed] [Google Scholar]
- 22. Puhr HC, Pablik E, Berghoff AS, et al. Viennese risk prediction score for Advanced Gastroesophageal carcinoma based on Alarm Symptoms (VAGAS score): characterisation of alarm symptoms in advanced gastro-oesophageal cancer and its correlation with outcome. ESMO Open. 2020;5:e000623. [DOI] [PMC free article] [PubMed] [Google Scholar]
- 23. Kim J, Hong JY, Kim ST, et al. Clinical scoring system for the prediction of survival of patients with advanced gastric cancer. ESMO Open. 2020;5:e000670. [DOI] [PMC free article] [PubMed] [Google Scholar]
- 24. Kim SY, Yoon MJ, Park YI, Kim MJ, Nam BH, Park SR. Nomograms predicting survival of patients with unresectable or metastatic gastric cancer who receive combination cytotoxic chemotherapy as first-line treatment. Gastric Cancer. 2018;21:453-463. [DOI] [PubMed] [Google Scholar]
- 25. Dixon M, Mahar AL, Helyer LK, Vasilevska-Ristovska J, Law C, Coburn NG. Prognostic factors in metastatic gastric cancer: results of a population-based, retrospective cohort study in Ontario. Gastric Cancer. 2016;19:150-159. [DOI] [PubMed] [Google Scholar]


