

Abstract
Objective:
Compare psychometric properties of the Patient-Reported Outcomes Measurement Information System upper extremity measure (PROMIS-UE) 7-item short form with 6 and 13-item versions for persons with upper limb amputation (ULA).
Design:
Telephone survey of 681-persons with ULA. Versions were scored two ways: PROMIS health measure scoring (PROMIS-UE HMSS) and sample-specific calibration (PROMIS-UE AMP). Factor analyses and Rasch analyses evaluated unidimensionality, monotonicity, item fit, differential item functioning, and reliability. Known group validity was compared for all versions.
Results:
Model fit was acceptable for PROMIS-6 UE AMP and marginally acceptable for PROMIS-13 UE AMP and PROMIS-7 UE AMP. Item response categories were collapsed due to disordered categories. 91.4% of participants had PROMIS-13 UE AMP scores with reliability >0.8, compared to 70.4% for PROMIS-7 UE AMP, and 72.1% for PROMIS-6 UE AMP versions. No differences were observed by prosthesis use. Scores differed by amputation for all measures except the HMSS scored 13 and 7 item versions.
Conclusions:
The PROMIS-13 UE AMP short form (SF) was superior to the HMSS scored PROMIS-7 UE or PROMIS-6 UE, and to the PROMIS-7 UE AMP and PROMIS-6 UE AMP. Issues with known group validation suggest a need for a population-specific measure of UE function for persons with ULA.
Keywords: Upper limb amputation; upper limb prosthesis; physical function; patient reported outcome; factor analysis, Rasch analysis
Measuring physical function in persons with upper limb amputation (ULA) is extremely important for rehabilitation care1 and can be done using performance-based measures or patient-reported outcome measures (PROMs). Performance measures can be burdensome and often require specialized equipment and trained administrators. In contrast, PROMs overcome some of these barriers and represent the patient perspective.
The Patient-Reported Outcomes Measurement Information System (PROMIS), has developed a set of generic PROMs including physical functioning (PF).2 The original PROMIS Physical Functioning (PF) 124-item set was split into upper extremity3 and other (central and lower extremity) items. The Upper Extremity (UE) Item set was expanded to 46 items in the PROMIS v2.0 UE.4, 5 A 7-item UE short form was developed to decrease respondent burden. 5 PROMIS measures were developed using item response theory (IRT), an approach to measurement widely used in education and health outcomes assessment to calibrate and evaluate instruments and to score persons on their abilities, attitudes, or other latent trait.
Generic PROMs enable comparisons across patient populations, making them likely to be widely used.6 The PROMIS UE item bank was developed with a normative population without upper limb impairment. Although, it has been examined in patients with orthopedic upper limb conditions4 and traumatic injury7, the PROMIS UE item set, and PROMIS-7 UE short form (SF) have not been evaluated in ULA. Before using the measure in ULA, its measurement properties should be evaluated. One study used a custom 9-item SF PROMIS UE measure with individuals with ULA and reported acceptable structural validity and preliminary evidence of known group validity with differences in total scores observed for persons who used vs. did not use a prosthesis, and for persons with above vs. below elbow amputation.8 However, that study did not evaluate whether differential item functioning (DIF) existed for prosthesis users vs. non-users This is important because presence of DIF may indicate reduced validity for between group comparisons. Further, the study did not compare the performance of the 9-item SF to the original 7-item SF.
In the PROMIS-7 UE, 6 of the 7 items ask about activities typically completed with one hand. Persons with unilateral ULA become reliant on their non-amputated side and perform the majority of daily activities with their non-involved side.9 Because the majority of daily activities are not performed with the amputated limb, we hypothesized that the PROMIS 7-item SF scores would not differ for prosthesis users and nonusers and would not distinguish between persons with unilateral amputation at different amputation levels. We also hypothesized that a SF UE measure that contained additional items addressing activities typically performed with two hands (bilateral activities) or a measure containing only bilateral activities would have superior psychometric properties, specifically known group validity as compared to the original 7-item SF. Thus, the overall objective of this study was to evaluate the relative psychometric properties of the PROMIS-7 item and two custom SF versions that we developed from the PROMIS UE item set that address activities typically performed with two hands in order to evaluate their suitability for use in persons with ULA.
Methods
Recruitment
Separate pilot and field testing were conducted via telephone surveys administered by trained survey center staff. Participants were recruited from four sources: 1) an earlier Department of Veterans Affairs (VA) study,10 2) Veterans who had received VA care between January 1, 2016 – June 1, 2019, 3) emails sent from the Amputee Coalition of America, and 4) recruitment letters sent from a private prosthetics service company. Participants were included in this convenience sample if they had amputation at the level of the wrist or above and were able to understand study requirements and hear well enough to comprehend questions administered over the telephone. Pilot study participants were excluded from the field study sample. A convenience sample of 40 participants, stratified by amputation level participated in the re-test portion of this study. Participants provided oral informed consent. The study was approved by the Central Institutional Review Board of the Department of Veterans Affairs. This study conforms to all STROBE guidelines and reports the required information accordingly (See Supplementary Checklist).
Data Collection
We collected field study data on 13 items from the PROMIS UE item set including the 7 items from the PROMIS-7 UE and 6 additional items initially hypothesized to involve bilateral upper limb use (tie a knot/bow, cut food using utensils, button shirt, open milk carton, use a zipper, cut paper with scissors). We used the original wording of PROMIS items. However, the original instructions were adapted for telephone administration during the first pilot tests: Interviewers found that respondents had difficulty answering the questions because they weren’t sure whether they should be answering about their ability to do the task with or without using their prosthesis. The instructions were modified to read, “please tell me about your ability to do the following activities in whatever way you normally do them.” After this modification was made, interviewers found that respondents had less difficulty in responding.
Data Analysis
Overview
After data collection, team members reviewed the content of the 13 items and agreed that 6 items (pass 20 lb. turkey/ham, tie knot/bow, cut food with utensils, open milk carton, use zipper, and cut paper with scissors) were most likely to be performed with both hands. We questioned whether persons with amputation typically performed the item, ‘button shirt’ with both hands. Thus, we created three versions of the PROMIS SF measure, the original 7 item measure, a 6-item measure containing only those tasks that team members agreed were performed with both hands, and the 13-item measure, containing all items collected. We then derived 6 measure scores using two approaches. First, we obtained T-scores through the PROMIS Health Measures Scoring System (HMSS) 11 for three short form item sets (referred to as the HMSS PROMIS-7 UE, the HMSS PROMIS-6 UE and the HMSS PROMIS-13 UE). HMSS is a software application used for IRT based scoring of data from PROMIS and other measurement system. HMSS users upload respondent data and the software applies the calibration metrics established by PROMIS. 12 Second, we calculated our own scores using item response theory (IRT) analyses with amputation (AMP) specific calibration; we named the resulting 3 measures the PROMIS-7 UE AMP, the PROMIS-6 UE AMP, and the PROMIS-13 UE AMP. Our IRT analyses followed the evaluation framework for key psychometric properties of measures as defined by PROMIS.13 Figure 1 shows the sequencing of our analytic approach.
Figure 1. Overview of analytic approach.
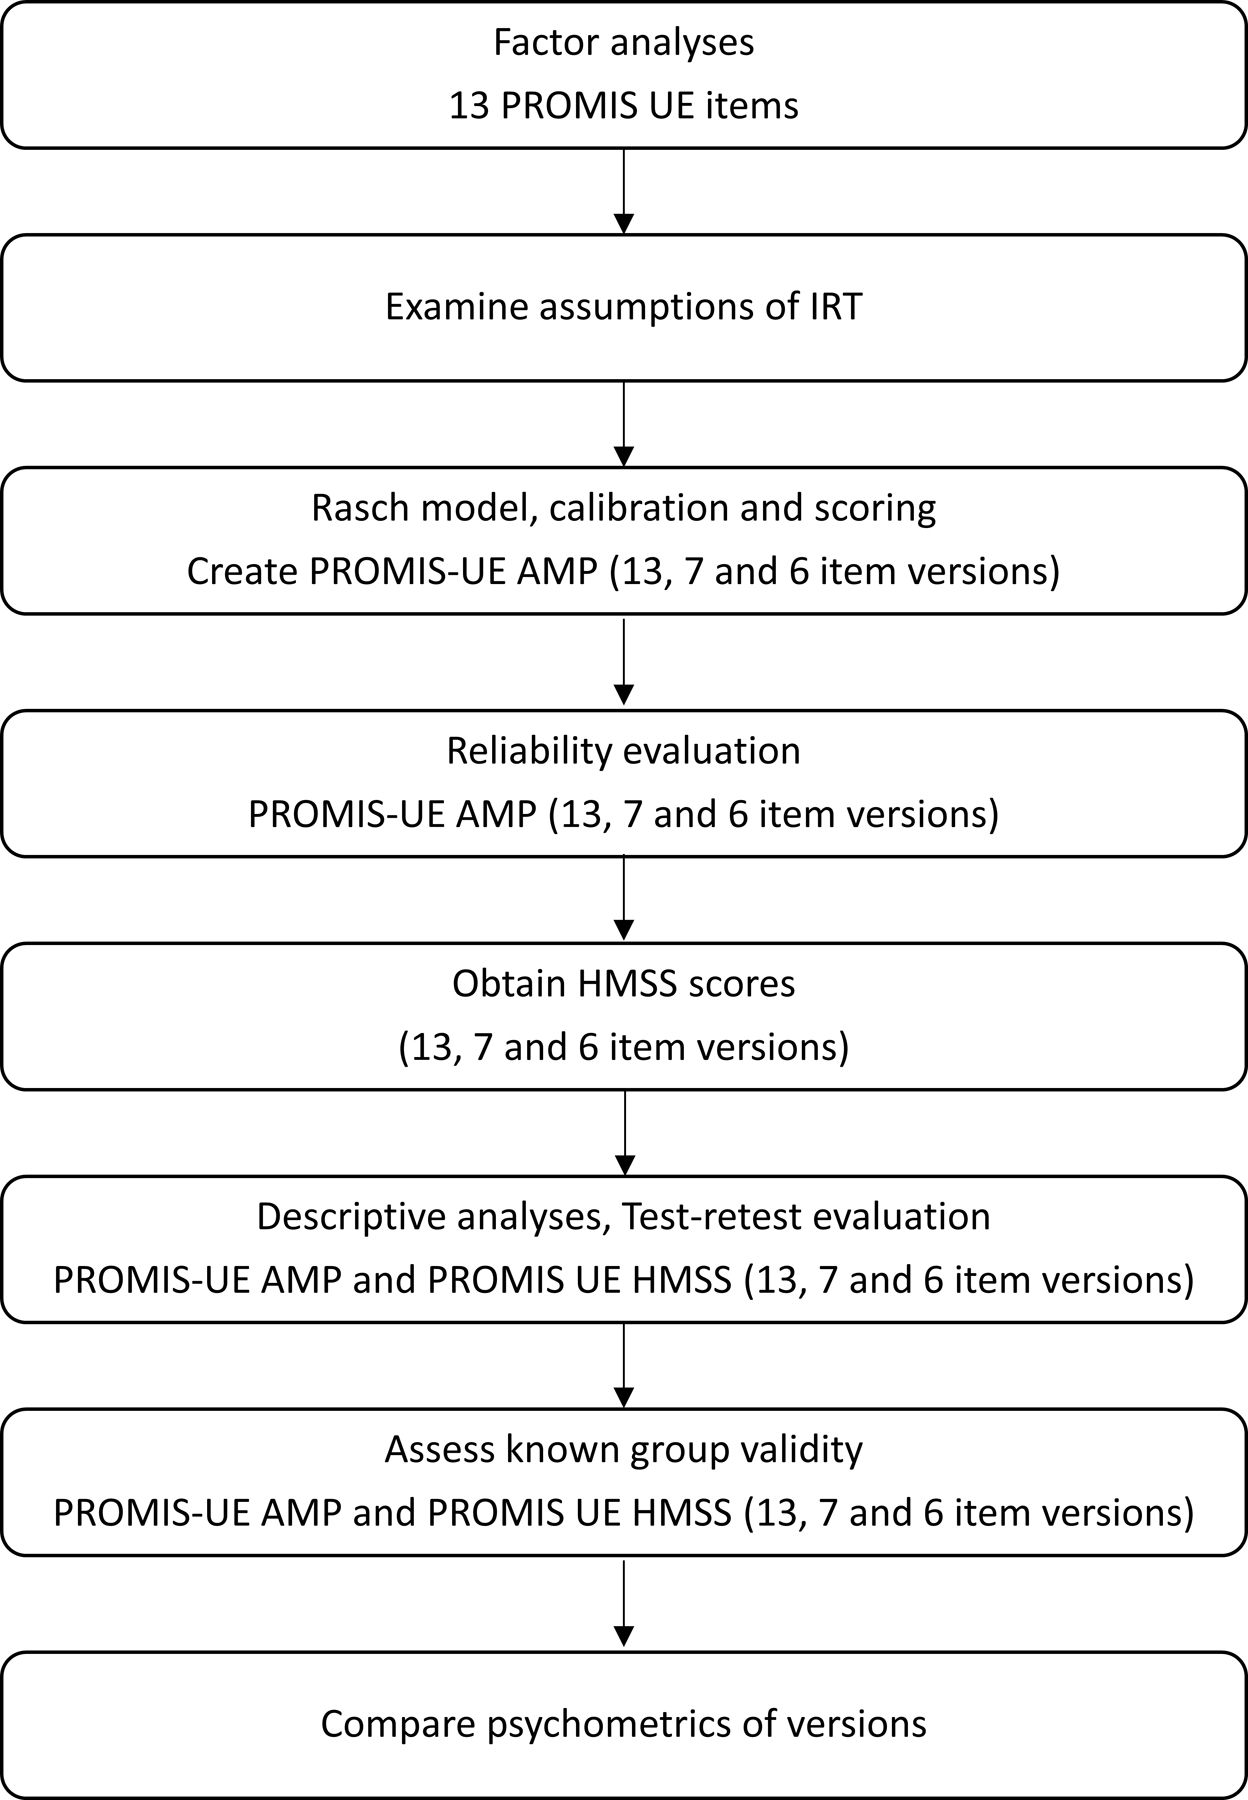
*Abbreviations: AMP: Amputation-specific, HMSS: Health Measure Scoring System, IRT: Item Response Theory. PROMIS: Patient-Reported Outcomes Measurement Information System, UE: Upper Extremity.
Factor Analyses
The first step in evaluation was an examination of structural validity. Structurally valid measures are sufficiently unidimensional to allow scaling of persons along a common latent trait. Our evaluation of unidimensionality began with exploratory factor analysis (EFA) to identify whether all 13 items we selected from the PROMIS UE item set belonged to the same or different constructs. We split the data from the full sample into two random groups and performed EFA in the first group (N=340). In the EFA, we determined the number of unidimensional factors by assessing the number of eigenvalues ˃1 and applying parallel analysis.14 A ratio>4 between the first and second eigenvalues was considered evidence of unidimensionality.
We then performed confirmatory analysis (CFA) to verify the factor structure of each of the 13, 7, and 6 item SF versions. CFA model fit was evaluated using the comparative fit index (CFI), Tucker–Lewis Index (TLI), root mean square error approximation (RMSEA), and residual correlations. Values of 0.90 or higher were considered acceptable for CFI and TLI, and values of <0.10 were acceptable for RMSEA. Items with residual correlations greater than 0.2 were considered for removal. MPlus software15 was used to conduct EFA and CFA.
Rasch Analysis
The next step in the examination of structural validity, involved Rasch partial credit modeling (PCM) of the measures. We elected to use PCM rather than Graded Response models following the example of Beckman16 and Fu.17 PCM for the 13 items was used to evaluate monotonicity of response categories, item fit statistics, and the magnitude of DIF by age, sex, and prosthesis use.
A basic requirement for IRT is that category responses are monotonic, which means that the item response categories are properly ordered.13 In our analyses, monotonicity means that the probability of endorsing an item response suggestive of better UE functioning (e.g., without any difficulty) increases when the underlying overall level of UE function increases. We assessed monotonicity using item category response curves.
We then collapsed disordered response categories and calibrated the scales with Rasch PCM. The fit statistics of the partial credit model were then evaluated to identify and remove any items with inlier-pattern-sensitive fit statistic (infit mnsq) values <0.6 or >1.4, which would suggest that the item did not fit well with the overall latent construct. We then conducted residual factor analysis to assess the amount of variance in observations explained by the scale and the unexplained variance in the first contrast of the principal component analysis. We considered the scale to be unidimensional if at least 40% of the variance was explained and the eigenvalue for the 1st contrast was < 2 18. Because local dependence of items could pose a problem for scale construction, we also examined the standardized residual correlation of item pairs with WINSTEPS 19 and considered any values >0.4 as a violation of local dependence, subject to removal.
In IRT models, it is important to identify whether any items have DIF for key groups. If an item has DIF, the probability of selecting different categories varies by subgroup, even given equivalent levels of person ability on the underlying construct. Measures that have items with DIF may have reduced validity for between group comparisons. We evaluated the presence of DIF by prosthesis use (yes or no) and amputation level (transradial [TR] or transhumeral/shoulder disarticulation/Interscapulothoracic amputation [TH/SH]) using two methods. The first approach, conducted using WINSTEPS, identified whether DIF contrasts were >0.64 and >2*SE+0.43.20 The second approach used the Lasso method in the R package GPCMLasso.21 Items with moderate to severe DIF were identified by the first method and confirmed by the Lasso method. The effect of DIF on measure scores was examined by calculating person scores with and without adjustment for DIF.
We then developed a Rasch item-person map to evaluate how the range and position of item difficulties corresponded to the range and position of the person scores generated from all items. For items with confirmed DIF, we created graphic displays of item characteristic curves across the person-score range by DIF group.
Person and item reliability was evaluated using Rasch models. High person reliability (≥0.8) indicates that those individuals with the highest scores truly have the best ability, and high item reliability (≥0.8) indicates that those items rated at the highest difficulty are truly the hardest items. We also examined the test information function to determine the score ranges of each of the 3 PROMIS UE AMP measures that had person reliability of ≥0.8. Cronbach’s alpha was calculated to assess internal consistency of the 3 PROMIS UE AMP measures.
Transformation and Scoring
The measure scores we obtained through the PROMIS HMSS website are based on a standardized theta metric so that the mean of the general US population is 0 and standard deviation is 1. The HMSS IRT z-score is converted to the PROMIS HMSS T-score distribution with mean of 50 and standard deviation of 10.22 This allows comparison of disease/disorder groups to the full calibration sample used by the PROMIS developers.
Rasch-calibrated summary scores for the 3 SF UE AMP measures were calculated on a logit scale and were then standardized into a T-score matrix for the sample. A conversion scoring table were also created to calculate T-scores for future respondents with no missing data.
Floor and Ceiling Effects
Score distributions for the 3 UE SF AMP and 3 UE HMSS measures were examined. Floor and ceiling effects were considered to exist if 15% or more of the sample had the lowest or highest (item or T-score) scores possible. 23
Test-retest Reliability and Minimal Detectable Change
Using data from participants who completed the survey twice within 2 weeks, test-retest reliability of the 3 SF UE AMP measures was assessed by calculating Shrout and Fleiss intraclass correlation coefficients (ICC) type 3,1 24The minimal detectable change at 90% (MDC90) and 95% (MDC95) confidence was calculated using ICC estimates and the pooled standard deviation of factor scores.
Known Groups Validation
Finally, to examine whether the PROMIS UE versions differed for subgroups as expected based on clinical observation and previous research,25 we compared scores of the 6 various configurations of the PROMIS measure for prosthesis users and non-users, and for persons of varying amputation level. Because of potential confounding of amputation level and prosthesis use (persons with more proximal amputation are less likely to be prosthesis users), we also stratified the data by prosthesis use and compared scores within amputation level.
Results
Sample Characteristics
Characteristics of pilot participants are shown in Appendix Table 1. Briefly, the mean age in the pilot sample was 61 years (sd 14), 50% were male, 71% white, and 63% had amputation at the transradial level. Eleven (69%) were prosthesis users; myoelectric devices (55%) were the most common primary prosthesis, followed by body-powered devices (27%).
Of the 699 persons with ULA surveyed in field testing, 18 did not respond to any PROMIS items and were excluded from analysis. Characteristics of the 681-person PROMIS field testing sample and the 40-person retest sample are shown in Table 1. Mean age was 61 (sd 15) years with mean years since amputation of 29 (sd 20). The sample included 135 women (20%) and was mostly of white race (80%). Transradial (56%) level amputation was most common, followed by transhumeral (33%), and shoulder (11%). There were 434 prosthesis users (64%), and most used body-powered (66%) devices, followed by myoelectric devices (25%).
Table 1.
Characteristics of the field study sample.
| Full Sample (N=681) |
Prosthesis Users (N=434) |
Nonusers (N=247) |
Test-retest Sample (N=40) | |
|---|---|---|---|---|
| Mn (sd) | Mn (sd) | Mn (sd) | Mn (sd) | |
| Age | 61.3 (14.8) | 61.4 (15.0) | 61.2 (14.4) | 61.9 (15.1) |
| Missing (n) | n=0 | n=0 | n=0 | n=0 |
| Years since amputation | 28.8 (19.6) | 301 (20.0) | 26.5 (18.7) | 33.3 (20.2) |
| Missing (n) | n=75 | n=55 | n=20 | n=0 |
| N (%) | N (%) | N (%) | N (%) | |
| Status | ||||
| Veteran | 525 (77.1) | 342 (78.8) | 183 (74.1) | 39 (97.5) |
| Military | 0 (0.0) | 0 (0.0) | 0 (0.0) | 0 (0.0) |
| Civilian | 155 (22.8) | 92 (21.2) | 63 (25.5) | 1 (2.5) |
| Unknown | 1 (0.2) | 0 (0.0) | 1 (0.4) | 0 (0.0) |
| Gender | ||||
| Female | 135 (19.8) | 81 (18.7) | 54 (21.9) | 2 (5.0) |
| Male | 546 (80.2) | 353 (81.3) | 193 (78.1) | 38 (95.0) |
| Race | ||||
| White | 557 (81.8) | 357 (82.2) | 200 (81.0) | 31 (77.5) |
| Black | 64 (9.4) | 41 (9.5) | 23 (9.3) | 2 (5.0) |
| Unknown | 35 (5.1) | 18 (4.3) | 17 (6.9) | 5 (12.5) |
| Mixed | 25 (3.7) | 18 (4.2) | 7 (2.8) | 2 (5.0) |
| Amputation level | ||||
| Transradial | 382 (56.1) | 305 (70.3) | 77 (31.2) | 15 (37.5) |
| Transhumeral | 225 (33.0) | 103 (23.7) | 122 (49.4) | 15 (37.5) |
| Shoulder | 74 (10.9) | 26 (6.0) | 48 (19.4) | 10 (25.0) |
| Amputation etiology (more than one may apply) | ||||
| Combat | 151 (24.1) | 117 (29.9) | 34 (14.4) | 14 (35.0) |
| Accident | 421 (67.0) | 252 (64.5) | 169 (71.3) | 26 (65.0) |
| Burn | 55 (8.8) | 40 (10.2) | 15 (6.3) | 3 (7.5) |
| Cancer | 43 (6.9) | 18 (4.6) | 25 (10.6) | 3 (7.5) |
| Diabetes | 4 (0.6) | 2 (0.5) | 2 (0.8) | 0 (0.0) |
| Infection/Other Health Problem | 83 (13.2) | 47 (12.0) | 36 (15.2) | 3 (7.5) |
| Congenital | 53 (7.8) | 43 (9.9) | 10 (4.1) | 0 (0.0) |
| Current prosthesis user | ||||
| Yes | 434 (63.7) | 434 (100.0) | 0 (0.0) | 40 (100.0) |
| Primary prosthesis type | ||||
| Body-powered | 286 (65.9) | 31 (77.5) | ||
| Myoelectric | 107 (24.7) | 6 (15.0) | ||
| Hybrid | 4 (0.9) | 0 (0.0) | ||
| Cosmetic | 26 (6.0) | 2 (5.0) | ||
| Sport | 10 (2.3) | 1 (2.5) | ||
| Unknown | 1 (0.2) | 0 (0.0) | ||
| Daily prosthesis use | ||||
| <2 hours | 83 (19.2) | 9 (22.5) | ||
| 2 to 4 hours | 52 (12.0) | 11 (27.5) | ||
| 4 to 8 hours | 71 (16.4) | 5 (12.5) | ||
| 8 to 12 hours | 99 (22.9) | 10 (25.0) | ||
| 12 hours or more | 128 (29.6) | 5 (12.5) | ||
| Missing (n) | n=1 | n=0 |
Factor Analyses
In EFA of the 13-item set, there were two eigenvalues>1, however the ratio of the first two eigenvalues was above 4, and parallel analysis supported a single factor solution (second eigenvalue was smaller in actual data compared to simulated reference samples). CFA of the single factor solutions (PROMIS-13 UE AMP, PROMIS-7 UE AMP and PROMIS-6 UE AMP) suggested unidimensionality of all versions (marginally acceptable for the 13 and 7-item versions). Fit indices are shown in Appendix Table 2. For the 13, 7 and 6 item PROMIS UE SF scales, all factor loadings were above 0.5 and residual correlations were <0.2, indicating that all items fit the underlying construct well and were not redundant.
Rasch Analysis
The PROMIS UE items have 5 response options: “Without any difficulty’, ‘With a little difficulty’, ‘With some difficulty’, ‘With much difficulty’, and ‘Unable to do’. Our evaluation of monotonicity revealed disordered threshold parameters in the middle three response categories for all 13 items. To address this, the middle three categories were merged resulting in three-category responses: ‘Without any difficulty’, ‘With difficulty’, and ‘Unable to do’. After collapsing response categories, the PCM found no misfit items (Table 2 - partial credit model). The most difficult item was ‘pass a 20-pound turkey or ham’ and the easiest item was ‘carrying a shopping bag or briefcase’.
Table 2.
Rasch partial credit model of PROMIS-13 UE AMP and DIF (differential item functioning) by prosthesis use and amputation level (N=681).
| Measure Content | Partial Credit Model | Differential Item Functioning | |||||||||||
|---|---|---|---|---|---|---|---|---|---|---|---|---|---|
| PROMIS Short Form | Logit Model | Infit | Outfit | Item difficulties by prosthesis use | Item difficulties by amputation level | ||||||||
| 13-item | 7-item | 6-item | Measure | SE | MNSQ | MNSQ | User | Non-user | DIF severity | SH/ TH | TR | DIF severity | |
| PROMIS-13 UE AMP | |||||||||||||
| Are you able to pass a 20-pound turkey or ham to other people at the table? | X | X | X | 1.31 | 0.07 | 1.02 | 0.98 | 1.03 | 1.81 | ** | 1.77 | 0.96 | ** |
| Are you able to wash your back? | X | X | 0.96 | 0.07 | 1.34 | 1.33 | 1.28 | 0.41 | ** | 0.54 | 1.30 | ** | |
| Are you able to tie a knot or a bow? | X | X | 0.84 | 0.07 | 1.06 | 1.03 | 0.41 | 1.6 | ** | ||||
| Are you able to cut your food using eating utensils? | X | X | 0.28 | 0.08 | 1.10 | 1.10 | −0.04 | 0.82 | ** | ||||
| Are you able to lift 10 pounds above your shoulder? | X | X | 0.22 | 0.07 | 0.89 | 0.91 | |||||||
| Are you able to change a light bulb overhead? | X | X | 0.18 | 0.07 | 0.88 | 0.93 | 0.37 | −0.16 | * | ||||
| Are you able to button your shirt? | X | 0.12 | 0.08 | 0.88 | 0.88 | 0.34 | −0.25 | * | −0.19 | 0.37 | |||
| Are you able to open a new milk carton? | X | X | −0.05 | 0.08 | 0.81 | 0.82 | |||||||
| Are you able to open and close a zipper? | X | X | −0.13 | 0.08 | 0.99 | 0.97 | |||||||
| Are you able to cut a piece of paper with scissors? | X | X | −0.32 | 0.08 | 0.99 | 0.96 | −0.10 | −0.72 | * | ||||
| Are you able to carry a heavy object of over 10 pounds? | X | X | −0.43 | 0.08 | 1.17 | 1.23 | −0.19 | −0.65 | |||||
| Are you able to put on and take off a coat or jacket? | X | X | −1.28 | 0.09 | 0.95 | 0.88 | |||||||
| Are you able to carry a shopping bag or briefcase? | X | X | −1.70 | 0.09 | 0.91 | 0.71 | |||||||
Slight to moderate: DIF contrast >0.43 and >2*SE (Standard Error)
Moderate to severe: DIF contrast>0.64 and >0.43+2*SE
Abbreviations: AMP: Amputation-specific, DIF: differential item functioning, Infit: inlier-pattern-sensitive fit statistic, MNSQ: Mean Square, Outfit: outlier-pattern-sensitive fit statistic, PROMIS: Patient-Reported Outcomes Measurement Information System, SH: Shoulder, TH: Transhumeral, TR: Transradial, UE: Upper Extremity.
In residual variance analysis of the PROMIS-13 UE AMP, PROMIS-7 UE AMP, and PROMIS-6 UE AMP scales, 67.7%, 57.1% and 72.7% of variance was explained by the models, respectively, and eigenvalues of the first contrast were 1.9, 1.4 and 1.6, respectively, indicating unidimensionality. There were no residual correlations greater than 0.4.
Items with slight to moderate or moderate to severe DIF (confirmed by Lasso) are shown in Table 2. Washing your back, changing a light bulb, buttoning a shirt, and cutting paper with scissors were more difficult for prosthesis users than nonusers. However, passing a 20-pound turkey or ham, tying a knot or bow, and cutting food using utensils were more difficult for nonusers than prosthesis users. Passing a turkey or ham and carrying a heavy object were more difficult for those with transhumeral (TH) or shoulder (SH) amputation as compared to transradial (TR) amputation, while washing back and buttoning a shirt were more difficult for those with TR as compared to TH or SH amputation. Figure 2 provides item characteristic curves and interpretation for each item with moderate to severe DIF. DIF had little impact on the estimation of scores for the 4 subgroups of “prosthesis user TH/SH ”, “prosthesis user TR”, “nonuser TH/SH” and “nonuser TR”. For the PROMIS-13 UE items scale, the maximum expected test score difference across the 4 subgroups was 0.49, 0.59, and 0.89 (out of 39, 21, and 18 maximum summary scores) for the 13 item, 7 item and 6 item scales, respectively.
Figure 2. Item characteristic curves for items with moderate to severe differential item functioning.

Item score (range: 1 to 3) is plotted across the 13-item measure T-score; mean (and 2*standard deviation from the mean) of subgroup scores shown; red, yellow, and blue areas correspond to expected item responses. For example, prosthesis users rated the ‘tie knot’ item as less difficult than did nonusers with equivalent overall T-scores. Specifically, among those with T-scores of 40, prosthesis users rated this item as ‘2: with difficulty’, while nonusers rated the item as ‘1: unable to do‘.
Item-person Map
The Rasch item-person map (Figure 3) showed that item difficulties (including the lowest and highest categories) sufficiently covered the range of person ability scores.
Figure 3. PROMIS-13 UE AMP Item-map.

Item difficulties (top) shown with points denoting levels of person ability with 50% probability of selecting lower category (vs higher category) for each item; bolded item names are those included in the PROMIS-7; the histogram (bottom) shows person scores. Dash and dotted lines indicate quartiles of sample scores.
*Abbreviations: TH: transhumeral, TR: transradial, SH: shoulder.
Rasch Reliability
Person reliability, Cronbach alpha, the percentage of respondents at the floor and ceiling as well as ICC(3,1), MDC90 and MDC95 values are shown in Table 3. Score ranges with >0.8 reliability (based on information function) are also shown in Table 3. In total, 91.4% of the sample had PROMIS-13 UE AMP scores with reliability >0.8, as compared to 70.4% for PROMIS-7 UE AMP scores, and 72.1% for PROMIS-6 UE AMP scores.
Table 3.
Person reliability, Information function reliability, Cronbach alphas, and floor and ceiling effects in full sample (N=681) and ICCs and MDCs in test-retest sample (N=40).
| PROMIS-13 UE AMP | PROMIS-7 UE AMP | PROMIS-6 UE AMP | HMSS PROMIS-13 UE | HMSS PROMIS-7 UE | HMSS PROMIS-6 UE | |
|---|---|---|---|---|---|---|
| Person Reliability (Rasch) | 0.87 | 0.78 | 0.75 | |||
| Score range with reliability>0.8 | 25.6, 64.1 | 34.9, 57.3 | 36.0, 58.4 | |||
| % with reliability>0.8 | 91.4% | 70.4% | 72.1% | |||
| Cronbach alpha | 0.90 | 0.84 | 0.82 | |||
| N (%) at Floor | 5 (0.7) | 7 (1.0) | 19 (2.8%) | 5 (0.7) | 7 (1.0) | 19 (2.8%) |
| N (%) at Ceiling | 13 (1.9) | 39 (5.7) | 37 (5.4) | 13 (1.9) | 39 (5.7) | 37 (5.4) |
| ICC (95%CI) | 0.79 (0.63–0.88) | 0.68 (0.47–0.82) | 0.83 (0.69–0.90) | 0.70 (0.47–0.84) | 0.70 (0.50–0.83) | 0.85 (0.73–0.92) |
| MDC90 | 11.9 | 15.7 | 11.1 | 10.4 | 12.1 | 9.0 |
| MDC95 | 14.2 | 18.7 | 13.2 | 12.4 | 14.4 | 10.7 |
Abbreviations: AMP: Amputation-specific, CI: confidence interval, HMSS: Health Measure Scoring System, ICC: intraclass correlation coefficient, MDC: minimal detectable change, PROMIS: Patient-Reported Outcomes Measurement Information System, UE: Upper Extremity.
Transformation and Scoring
Mean, median, and quartile scores for all 6 scales are presented in Figure 4 boxplots. Repeated measure analyses of variance (ANOVAs) comparing measure T-scores identified that there were statistically significant differences in HMSS score distributions between the 13, 7 and 6-item versions. Post-hoc paired t-test comparisons were also significant after Bonferroni corrections. On average, HMSS PROMIS-7 UE AMP scores were 4.9 points (sd 4.0) higher than HMSS PROMIS-13 UE AMP scores, and HMSS PROMIS-6 UE AMP scores were 2.6 points (sd 3.6) lower than PROMIS-13 UE AMP scores. However, there was no significant difference between the 3 PROMIS-UE AMP measures scored using our IRT approach. Appendix Table 3 provides a method to convert scale summary totals to T-scores based on our Rasch calibration sample.
Figure 4. Boxplots comparing scores of PROMIS UE measures.

*Abbreviations: AMP: Amputation-specific, HMSS: Health Measure Scoring System, PROMIS: Patient-Reported Outcomes Measurement Information System, UE: Upper Extremity
Known Groups Validity
There were no statistically significant differences between prosthesis users and nonusers in any PROMIS HMSS or AMP scored version, even after stratification by amputation level (data not shown). ANOVAs found statistically significant differences in the PROMIS-13 UE AMP, the PROMIS-7 UE AMP, the PROMIS-6 UE AMP and the HMSS PROMIS-6 UE by amputation level for the full sample, but did not find significant differences for the HMSS PROMIS-13 UE or the HMMS PROMIS-7 UE (Table 4). When the data were stratified by prosthesis use, there were statistically significant differences in all measures by amputation level for the prosthesis user group, but not for the non-user group (Table 4). These data are also displayed graphically in Appendix Figure 1.
Table 4.
Comparison of PROMIS SF scores by amputation level, stratified by prosthesis use(N=681).
| FULL SAMPLE (N=681) | Transradial (N=382) | Transhumeral (N=225) | Shoulder (N=74) | ANOVA p |
|---|---|---|---|---|
| PROMIS-13 UE AMP | 51.0 (9.9) | 48.8 (10.5) | 48.6 (8.7) | 0.0181 * |
| PROMIS-7 UE AMP | 50.9 (10.0) | 48.8 (11.0) | 49.0 (10.3) | 0.0382 * |
| PROMIS-6 UE AMP | 51.6 (10.9) | 48.2 (10.7) | 47.7 (9.0) | 0.0001 ** |
| HMSS PROMIS-13 UE | 35.1 (8.7) | 33.6 (8.6) | 33.3 (7.2) | 0.0502 |
| HMSS PROMIS-7 UE | 40.0 (9.0) | 38.5 (9.3) | 38.4 (9.0) | 0.0955 |
| HMSS PROMIS-6 UE | 33.0 (9.4) | 30.6 (8.7) | 29.6 (7.3) | 0.0008 ** |
| PROSTEHSIS USERS (N=434) | Transradial (N=305) | Transhumeral (N=103) | Shoulder (N=26) | ANOVA p |
| PROMIS-13 UE AMP | 51.0 (9.3) | 47.9 (11.6) | 47.3 (11.2) | 0.0096 * |
| PROMIS-7 UE AMP | 50.8 (9.5) | 47.8 (12.3) | 46.4 (11.7) | 0.0100 * |
| PROMIS-6 UE AMP | 52.1 (10.4) | 47.8 (12.0) | 48.4 (11.2) | 0.0015 * |
| HMSS PROMIS-13 UE | 35.1 (8.1) | 32.9 (9.2) | 32.3 (9.3) | 0.0320 |
| HMSS PROMIS-7 UE | 39.9 (8.5) | 37.7 (10.1) | 35.9 (10.4) | 0.0155 |
| HMSS PROMIS-6 UE | 33.2 (9.1) | 30.6 (9.4) | 30.9 (9.5) | 0.0334 * |
| NONUSERS (N=247) | Transradial (N=77) | Transhumeral (N=122) | Shoulder (N=48) | ANOVA p |
| PROMIS-13 UE AMP | 51.0 (12.1) | 49.6 (9.4) | 49.3 (7.0) | 0.5760 |
| PROMIS-7 UE AMP | 51.5 (11.9) | 49.7 (9.7) | 50.4 (9.3) | 0.4973 |
| PROMIS-6 UE AMP | 49.9 (12.5) | 48.6 (9.6) | 47.3 (7.6) | 0.3802 |
| HMSS PROMIS-13 UE | 35.4 (10.7) | 34.3 (8.0) | 33.8 (5.8) | 0.5444 |
| HMSS PROMIS-7 UE | 40.3 (11.1) | 39.1 (8.5) | 39.8 (7.9) | 0.6830 |
| HMSS PROMIS-6 UE | 32.0 (10.6) | 30.7 (8.0) | 29.0 (5.8) | 0.1643 |
post-hoc Tukey comparisons were significant between TR and TH groups only.
post-hoc Tukey comparisons were significant between TR and TH groups and TR and SH groups.
Abbreviations: AMP: Amputation-specific, ANOVA: analysis of variance, HMSS: Health Measure Scoring System, PROMIS: Patient-Reported Outcomes Measurement Information System, UE: Upper Extremity.
Discussion
This study aimed to evaluate the psychometric properties of the PROMIS-7 UE item SF as compared to two custom SF item sets (6 item and 13 item versions) that included items typically performed with two hands, and to assess their suitability in measuring physical function in persons with ULA. We scored these item sets in two ways: using the freely available HMSS scoring system and using a population-specific Rasch calibration (which we labeled PROMIS UE AMP). Our results suggest that the PROMIS-13 UE AMP SF is superior to the other options.
Although we found that the model fit (as indicated by CFA) of PROMIS-6 UE AMP was superior to the PROMIS-13 UE AMP and PROMIS-7 UE AMP, the PROMIS-13 UE AMP scores were more reliable across a wider range of scores, making it the better choice for measuring UE function in ULA. That said, we acknowledge concerns about the sensitivity and validity of the PROMIS-UE SF versions we tested because the measure was unable to detect differences in function for those who did and did not utilize a prosthesis, even after stratification by amputation level. Many persons with ULA perform activities without use of a prosthesis. However, the data obtained with the PROMIS UE SF versions suggest that there is little functional benefit of prosthesis use. This conclusion seems erroneous at face value, and inconsistent with prior literature.26 It is therefore possible that PROMIS measures may not be appropriate to compare function of prosthesis users and nonusers unless further refinements address this issue.
While there might be advantages in using the HMSS scores to compare function in persons with ULA to a normative sample, we identified issues with the structural validity of PROMIS HMSS scored measures. Scores estimated through HMSS for the PROMIS-13 UE AMP, PROMIS-7, and PROMIS-6 UE AMP were statistically different from each other, although drawn from the same, larger calibrated item bank. The HMSS PROMIS-7 UE scores appeared to over-estimate function in comparison to the HMSS PROMIS-13 and 6 (Figure 4). We believe that the HMSS PROMIS-7 UE over-estimated the function of persons with ULA for two reasons. First, the larger PROMIS UE item bank is calibrated for persons without upper limb impairment, and second, the items within the 7-item measure are primarily one-handed tasks, which in our sample were likely performed with the non-amputated limb. Whereas 6 items in the 6- and 13-item versions were intended to address two-handed task functions. These tasks were relatively more difficult for persons with amputation as compared to the normative sample. Because we used the calibration from our Rasch models to estimate person level scores, the scores of the PROMIS-13 UE AMP, PROMIS-7 UE AMP, and PROMIS-6 UE AMP were similar, suggesting that our item calibration differed from that derived from the normative sample in the HMSS.
Calibration estimates for UE item difficulties seem to vary within samples with ULA. Our study identified the item ‘pass 20-pound turkey or ham’ as the most difficult item, consistent with the item hierarchy identified in the PROMIS-9 UE.8 However, while England et al. reported the items ‘open and close a zipper’ and ‘button a shirt’ had a similar difficulty range, we found that the zipper item was easier than the button item. These differences may be attributable to differences in sample composition. Our sample excluded persons with bilateral amputation or partial hand amputation and included a larger proportion of persons who did not use a prosthesis relative to the England et al. sample.
We also identified disordered response categories in the 13 PROMIS UE AMP items we evaluated, suggesting that respondents were not able to meaningfully distinguish between certain response categories. Because measures are more valid when response categories are ordered and reflect level of ability, we collapsed the three middle response categories (“with much difficulty”, “with some difficulty”, “with a little difficulty”) for all items. In contrast, the HMSS PROMIS used 5 response categories, only collapsing categories (“without much difficulty” and “unable to do”) for one item we tested (cut papers with scissor).
Ours was the first study to evaluate DIF by prosthesis use and amputation level in items from the PROMIS UE item set. We identified moderate to severe DIF in 4 of the 13 items that we examined. We believe that this DIF by amputation level is non-problematic. The finding that certain tasks were rated easier for persons based on whether they had more distal (TR) as compared to more proximal (TH or SH) amputation level is not surprising and is consistent with clinical judgement. In contrast, the finding of DIF by prosthesis use may be problematic because it may be caused by the presence of a secondary trait related to prosthesis engagement in task performance. It is also possible that cognitive differences in item interpretation may have occurred by prosthesis use. Despite the instructions to rate activity difficulty in activity performance in “whatever way you normally do it”, it is possible that persons who utilized a prosthesis were more apt to respond by reporting on difficulty level when utilizing the prosthesis, even when they typically performed the activity without engaging their prosthesis. However, the DIF we observed had little effect on estimation of the scale scores.
The presence of DIF by prosthesis use suggests the opportunity to improve items to reduce DIF. Such strategies might include developing a new instruction set for prosthesis users, or alternatively the creation of a secondary measure that assesses prosthesis use separate from upper extremity function. Previous studies on the OPUS UEFS measure resulted in the development a separate UEFS Use measure that is a count of the number of activities where prostheses are engaged.27 The UEFS Use measure was able to differentiate between persons by amputation level, but the UEFS measure was not.
Limitations
Although we added 6 additional items that we believed would be performed in a two-handed manner, we cannot say with certainty whether or not respondents actually performed these tasks using both upper extremities, or whether they engaged their prostheses while performing tasks. Some persons with ULA may perform these tasks with only one extremity, or perform them by engaging their knees, teeth or other body parts or using assistive devices.
We administered the PROMIS item set by telephone as part of a larger study.. Further research is needed to identify whether there is a mode of administration effect. That said, prior studies suggest that there are few mode of administration effects for PROMIS instruments in persons with traumatic injury and in pediatric populations. 28, 29 There is little reason to believe that a mode effect would be observed in persons with upper limb amputation.
Conclusion
The PROMIS-13 UE AMP SF developed in this study was superior to the HMSS scored PROMIS-7 UE or PROMIS-6 UE, and to our Rasch scored custom 7 and 6 item SFs. Issues with known group validation suggest a need for refinements to the measure or a new population-specific measure of UE function for persons with ULA.
Supplementary Material
Appendix Figure 1. PROMIS-13 UE AMP score distributions by amputation level
*Abbreviations: AMP: Amputation-specific, PROMIS: Patient-Reported Outcomes Measurement Information System, TH: transhumeral, TR: transradial, SH: shoulder, UE: Upper Extremity.
Appendix Table 1. Pilot study demographics.
Appendix Table 2. Confirmatory factor analysis fit indices.
*Abbreviations: AMP: Amputation-specific, CFI: comparative fit index, PROMIS: Patient-Reported Outcomes Measurement Information System, RMSEA: root mean square error approximation, TLI: Tucker–Lewis Index, UE: Upper Extremity.
Appendix Table 3. Scoring conversion tables.
*After recoding response categories, the raw scores for each version should be summed and then can be converted to a T-score with T-score standard error. Response categories should be recoded as follows: without difficulty=3, with a little difficulty, with some difficulty, and with much difficulty=2, unable to do=1.
**Abbreviations: AMP: Amputation-specific, PROMIS: Patient-Reported Outcomes Measurement Information System, UE: Upper Extremity.
What is Known / What is New.
What is Known: The PROMIS-7 UE is a generic 7-item measure of upper extremity function that has never been evaluated in upper limb amputation.
What is New: This study compared measurement properties of the PROMIS-7 UE with 13- and 6-item versions. Measures were scored two ways: 1) using the PROMIS HMSS scoring system, and 2) using sample specific Rasch calibration. The 13-item measure scored with sample specific calibration was more reliable than the other versions. However, no version detected differences in function for persons who did or did not use a prosthesis, limiting their usefulness in prosthetic rehabilitation.
Financial support/Grant number:
Department of Veterans Affairs Rehabilitation Research and Development Service A2936-R and A9264-S
Footnotes
Author Disclosures:
Competing Interests:
The authors have no competing interests
References
- 1.VA/DoD Clinical Practice Guideline for the Management of Upper Extremity Amputation Rehabilitation (Department of Veterans Affairs, Department of Defense.) (2014). [Google Scholar]
- 2.Gershon RC, Rothrock N, Hanrahan R, Bass M, Cella D. The use of PROMIS and assessment center to deliver patient-reported outcome measures in clinical research. J Appl Meas 2010;11(3):304–14. [PMC free article] [PubMed] [Google Scholar]
- 3.Hays RD, Spritzer KL, Amtmann D, et al. Upper-extremity and mobility subdomains from the Patient-Reported Outcomes Measurement Information System (PROMIS) adult physical functioning item bank. Arch Phys Med Rehabil Nov 2013;94(11):2291–6. doi: 10.1016/j.apmr.2013.05.014 [DOI] [PMC free article] [PubMed] [Google Scholar]
- 4.Hung M, Voss MW, Bounsanga J, Crum AB, Tyser AR. Examination of the PROMIS upper extremity item bank. J Hand Ther Oct - Dec 2017;30(4):485–490. doi: 10.1016/j.jht.2016.10.008 [DOI] [PMC free article] [PubMed] [Google Scholar]
- 5.Kaat AJ, Buckenmaier CT 3rd, Cook KF, et al. The expansion and validation of a new upper extremity item bank for the Patient-Reported Outcomes Measurement Information System(R) (PROMIS). J Patient Rep Outcomes Nov 26 2019;3(1):69. doi: 10.1186/s41687-019-0158-6 [DOI] [PMC free article] [PubMed] [Google Scholar]
- 6.Makhni EC, Meadows M, Hamamoto JT, Higgins JD, Romeo AA, Verma NN. Patient Reported Outcomes Measurement Information System (PROMIS) in the upper extremity: the future of outcomes reporting? J Shoulder Elbow Surg Feb 2017;26(2):352–357. doi: 10.1016/j.jse.2016.09.054 [DOI] [PubMed] [Google Scholar]
- 7.Kaat AJ, Rothrock NE, Vrahas MS, et al. Longitudinal Validation of the PROMIS Physical Function Item Bank in Upper Extremity Trauma. J Orthop Trauma Oct 2017;31(10):e321–e326. doi: 10.1097/BOT.0000000000000924 [DOI] [PubMed] [Google Scholar]
- 8.England DL, Miller TA, Stevens PM, Campbell JH, Wurdeman SR. Assessment of a Nine-Item Patient-Reported Outcomes Measurement Information System Upper Extremity Instrument Among Individuals With Upper Limb Amputation. Am J Phys Med Rehabil Feb 1 2021;100(2):130–137. doi: 10.1097/PHM.0000000000001531 [DOI] [PubMed] [Google Scholar]
- 9.McFarland LV, Winkler SLH, Heinemann AW, Jones M, Esquenazi A. Unilateral upper-limb loss: Satisfaction and prosthetic-device use in veterans and servicemembers from Vietnam and OIF/OEF conflicts. Journal of Rehabilitation Research & Development 2010;47(3):299–316. [DOI] [PubMed] [Google Scholar]
- 10.Resnik L, Borgia M, Biester S, Clark MA. Longitudinal study of prosthesis use in veterans with upper limb amputation. Prosthet Orthot Int Oct 6 2020:309364620957920. doi: 10.1177/0309364620957920 [DOI] [PubMed]
- 11.Measures H HealthMeasures Scoring Service powered by Assessment Center: An application to score PROMIS®, NIH Toolbox®, and Neuro-QoL™ instruments January 31, 2022. https://www.assessmentcenter.net/ac_scoringservice
- 12.Cella D, Gershon R, Bass M, Rothrock N. Assessment Center Scoring Services User Manual Version 1.8 Accessed January 31, 2022. https://www.assessmentcenter.net/ac_scoringservice/templates/UserManual.pdf
- 13.Reeve BB, Hays RD, Bjorner JB, et al. Psychometric evaluation and calibration of health-related quality of life item banks: plans for the Patient-Reported Outcomes Measurement Information System (PROMIS). Med Care May 2007;45(5 Suppl 1):S22–31. doi: 10.1097/01.mlr.0000250483.85507.0400005650-200705001-00004 [pii] [DOI] [PubMed] [Google Scholar]
- 14.Lubbe D Parallel analysis with categorical variables: Impact of category probability proportions on dimensionality assessment accuracy. Psychol Methods Jun 2019;24(3):339–351. doi: 10.1037/met0000171 [DOI] [PubMed] [Google Scholar]
- 15.Muthen L, Muthen B. MPlus Statistical Analysis with Latent Variables User’s Guide Muthen & Muthen; 2007. [Google Scholar]
- 16.Beckmann JT, Hung M, Bounsanga J, Wylie JD, Granger EK, Tashjian RZ. Psychometric evaluation of the PROMIS Physical Function Computerized Adaptive Test in comparison to the American Shoulder and Elbow Surgeons score and Simple Shoulder Test in patients with rotator cuff disease. J Shoulder Elbow Surg Dec 2015;24(12):1961–7. doi: 10.1016/j.jse.2015.06.025 [DOI] [PubMed] [Google Scholar]
- 17.Fu MC, Chang B, Wong AC, et al. PROMIS physical function underperforms psychometrically relative to American Shoulder and Elbow Surgeons score in patients undergoing anatomic total shoulder arthroplasty. J Shoulder Elbow Surg Sep 2019;28(9):1809–1815. doi: 10.1016/j.jse.2019.02.011 [DOI] [PubMed] [Google Scholar]
- 18.Smith EV Jr. Detecting and evaluating the impact of multidimensionality using item fit statistics and principal component analysis of residuals. J Appl Meas 2002;3(2):205–31. [PubMed] [Google Scholar]
- 19.Linacre J Winsteps® Rasch measurement computer program User’s Guide Winsteps.com; 2017.
- 20.Zwick R, Thayer DT, Lewis C. An Empirical Bayes Approach to Mantel-Haenszel DIF Analysis. Journal of Educational Measurement 1999;36(1):1–28. [Google Scholar]
- 21.Schauberger G, Mair P. A regularization approach for the detection of differential item functioning in generalized partial credit models. Behav Res Methods Feb 2020;52(1):279–294. doi: 10.3758/s13428-019-01224-2 [DOI] [PubMed] [Google Scholar]
- 22.Dewitt B, Jalal H, Hanmer J. Computing PROPr Utility Scores for PROMIS® Profile Instruments. Value in health : the journal of the International Society for Pharmacoeconomics and Outcomes Research 2020;23(3):370–378. doi: 10.1016/j.jval.2019.09.2752 [DOI] [PMC free article] [PubMed] [Google Scholar]
- 23.Terwee CB, Bot SD, de Boer MR, et al. Quality criteria were proposed for measurement properties of health status questionnaires. J Clin Epidemiol Jan 2007;60(1):34–42. [DOI] [PubMed] [Google Scholar]
- 24.Shrout PE, Fleiss JL. Intraclass correlations: uses in assessing rater reliability. Psychological bulletin Mar 1979;86(2):420–8. [DOI] [PubMed] [Google Scholar]
- 25.Resnik L, Borgia M, Cancio J, et al. Dexterity, activity performance, disability, quality of life, and independence in upper limb Veteran prosthesis users: a normative study. Disabil Rehabil Oct 18 2020:1–12. doi: 10.1080/09638288.2020.1829106 [DOI] [PubMed]
- 26.Resnik L, Borgia M, Clark M. Function and Quality of Life of Unilateral Major Upper Limb Amputees: Effect of Prosthesis Use and Type. Arch Phys Med Rehabil Aug 2020;101(8):1396–1406. doi: 10.1016/j.apmr.2020.04.003 [DOI] [PubMed] [Google Scholar]
- 27.Resnik L, Borgia M. Reliability and Validity of Outcome Measures for Upper Limb Amputation. JPO: Journal of Prosthetics and Orthotics 2012;24(4):192–212 [Google Scholar]
- 28.Kisala PA, Boulton AJ, Cohen ML, et al. Interviewer- versus self-administration of PROMIS(R) measures for adults with traumatic injury. Health Psychol May 2019;38(5):435–444. doi: 10.1037/hea0000685 [DOI] [PMC free article] [PubMed] [Google Scholar]
- 29.Magnus BE, Liu Y, He J, et al. Mode effects between computer self-administration and telephone interviewer-administration of the PROMIS((R)) pediatric measures, self- and proxy report. Qual Life Res Jul 2016;25(7):1655–65. doi: 10.1007/s11136-015-1221-2 [DOI] [PMC free article] [PubMed] [Google Scholar]
Associated Data
This section collects any data citations, data availability statements, or supplementary materials included in this article.
Supplementary Materials
Appendix Figure 1. PROMIS-13 UE AMP score distributions by amputation level
*Abbreviations: AMP: Amputation-specific, PROMIS: Patient-Reported Outcomes Measurement Information System, TH: transhumeral, TR: transradial, SH: shoulder, UE: Upper Extremity.
Appendix Table 1. Pilot study demographics.
Appendix Table 2. Confirmatory factor analysis fit indices.
*Abbreviations: AMP: Amputation-specific, CFI: comparative fit index, PROMIS: Patient-Reported Outcomes Measurement Information System, RMSEA: root mean square error approximation, TLI: Tucker–Lewis Index, UE: Upper Extremity.
Appendix Table 3. Scoring conversion tables.
*After recoding response categories, the raw scores for each version should be summed and then can be converted to a T-score with T-score standard error. Response categories should be recoded as follows: without difficulty=3, with a little difficulty, with some difficulty, and with much difficulty=2, unable to do=1.
**Abbreviations: AMP: Amputation-specific, PROMIS: Patient-Reported Outcomes Measurement Information System, UE: Upper Extremity.