

Abstract
Two dimeric smectic molecules, namely α-ω-bis (4-n-pentylanilinebenzylidene-4′-oxy) butane (PABO4) and α-ω-bis (4-n-pentylanilinebenzylidene-4′-oxy) pentane (PABO5), have been considered for sensing UV light. The compounds’ optimization process has been performed through B3LYP hybrid functional together with basis set 6-31+G (d) using the input parameters from the crystallographer. The absorption of UV analysis of these compounds has been estimated, and the configuration interaction single-level method has been used to analyse the electronic transition features coupled with the calculation of excited states using semi-empirical Hamiltonian ZINDO. The CNDO/S, INDO/S together with CI approaches, has been utilized for comparative evaluation. The spectral-associated parameters have been summarized. The molecules discussed in this manuscript present several features, viz. the absorption range of the molecules that is sensitive to different wavelengths, the usage in flexible devices, offering the prospect for UV sensors. Further, the switching applications have been explored based on the oscillator strength data in various regions of wavelengths.
Graphical abstract

Introduction
The orientational ordering basically characterizes the liquid crystalline (LC) state [1]. The transitions among various mesophases are associated with transformations in the molecular local order [2], which are noticeable by various anisotropic properties [3]. Structural design and practicality are crucial facets in the engineering of LC molecules for managing the physical properties and constancy of mesophases [4]. The preliminary awareness of LC dimers [5–7] arose from their prospective use as model molecules that help in the understanding of complex polymeric systems. However, these dimers attained noteworthy attention as they exhibit fairly dissimilar behaviour to usual small molar mass LCs.
The LC dimers consist of mesogenic blocks alienated by stretchy spacers, and end chains. It is composed of molecules containing two conformist mesogenic groups connected via a flexible spacer. Further, in a dimer system, the non-symmetry may be initiated by bonding two singular mesogenic units, altering the terminal chain length, using terminal groups, or by varying the spacer group length and parity [8]. Hence, the focus on this type of system is at a substantial level for their application potential. However, device applications based on these systems need special attention due to their rich phase structure, transition properties, and better viability. The extended aromatic structures favour intense optical absorption and related optical properties [9]. Such subtle and delicate sensitivity [10] is accountable for their operation as stimuli-responsive materials in various applications such as visualization, display, sensor, and switching technology [11]. Consequently, passionate research attempts are continuously initiated at implementing LCs [12, 13] as quick-response, sensitive, and minimum-cost materials for sensor applications. Further, now the liquid crystal biosensors are emerging [14, 15]. These light sensing based on LC devices act as unswerving platforms for identifying the chemical and bio-chemical processes [16, 17]. Recently, liquid crystal-based immunosensor [18] has been developed to detect anti-SARS-CoV-2 antibody for the diagnosis of past-COVID-19 infection. Therefore, sensing and switching applications based on LCs are high in demand.
The smectic compounds are 2D (two-dimensional) liquids that contain a monomolecular stack of layers. The molecular positions in each of these are translationally more or less disordered. The LC dimer systems possess opto-electronic functionality [19] along with the self-organizing ability [20] in various continual mesophases that favours free defect films due to their conjugation degree. Therefore, they are very much functional for building optoelectronic and sensing devices. In this framework, the studies on LC dimers with better chromophores [21] have to be reported for both elementary science and realistic applications. This manuscript has been aimed toward the exploration of dimeric smectic molecules PABO4 and PABO5 for sensing UV light applications. The DFT method has been used for this intention and for the optimal geometries calculation. The convolution of absorption spectra has been made based on the time-dependent DFT theory [22] along with the CIS method [23]. The Hamiltonian ZINDO [24, 25] has been implemented for the calculation of excited states. The results estimated have been summarized and matched to the CNDO/S + CI [26] and INDO/S + CI approaches [27]. The stability of the compounds in the UV wavelength region and sensing capability has been studied. The spectral data have been reported. Both dimer molecules exhibit smectic behaviour as evident from the literature [28].
Methods
The molecular UV spectra of PABO4 and PABO5 have been described by employing the DFT calculation method. These calculations are liable to estimate the ground-level properties with correctness [29, 30] closer to the post-HF approaches. The accuracy of excitation energies depends on the exchange–correlation function used. The hybrid functional execution suggests the consistent excitation of vertical energies together with analysis of charge transfer. Therefore, the structure-based aspects have been analysed via the ‘hybrid’ density B3LYP functionals [31–33] and ‘precise exchange’ in coupling with the gradient-suitable density functionals. Further, the structural optimization process has been performed via the DFT-B3LYP approach [34, 35], along with 6-31G+(d) basis set. The required structural, energy data and wave functions are studied by approximating the single-level configuration interaction (CI) of with π → π* excitations. This procedure has been widely accepted and sufficient to guesstimate the absorption spectra in UV-visible region. The SORCI (spectroscopy-oriented configuration interaction) method [31, 36] has been used for the DFT calculations. The DFT data has been matched up with the CNDO/S + CI and INDO/S + CI approaches. A modified version of QCPE 174 was executed for this. The crystallographic information files have been utilized for molecular construction [28].
Discussion of results
Figure 1 shows the structures of PABO4, PABO5 molecules. The description of the UV absorption spectra is as follows:
Fig. 1.

Geometry of a PABO4 and b PABO5 molecules
UV spectra
UV spectroscopy is one of the primary techniques used to characterize molecules and their complexes. The logical elucidation of absorption spectra can offer important and often distinctive data about the structure and electronic properties of molecular assemblies. Model molecules of varying complexity can be utilized to infer these spectra. The general and simple view typically entails the analysis of absorption bands. Widespread handling using various computational approaches offers an extensive depiction of the electronic states of the molecular complex and the transitions between them [37–39]. One main centre of attention of this perception is the distinctive absorption spectral aspect that occurs with respect to the inclusion of end chains. The interpretation of these spectral aspects can be repeatedly analysed within the outline of a suitable model to construct a molecular database.
The LC molecules consist of fixed aromatic conjugated blocks and absorption spectral analyses considered to be crucial that direct the necessary properties in the bulk phases of LC molecules. Absorption spectral profiles of PABO4 and PABO5 are shown in Fig. 2 and Fig. 3 using the above three methods, respectively. The comprehensive spectral feature data are given in Table 1. The data from the table indicated that PABO4 molecule reveals the highest absorption wavelength (corresponding to a large value of extinction coefficient) in the UV region at 220.51 nm, 296.09 nm, and 207.83 nm correspondingly using DFT, CNDO/S, and INDO/S data correspondingly. Similarly, in the UV region, the PABO5 reveals absorption highest wavelength at 205.86 nm, 306.05 nm, and 311.91 nm correspondingly with the DFT, CNDO/S, and INDO/S data correspondingly. All these electronic bands corresponding to the highest absorption wavelength are recognized as a consequence of the transition of HOMO → LUMO and are considered as π → π* molecular transitions.
Fig. 2.

UV absorption profile molecules PABO4 molecule using DFT, CNDO/S, and INDO/S methods
Fig. 3.
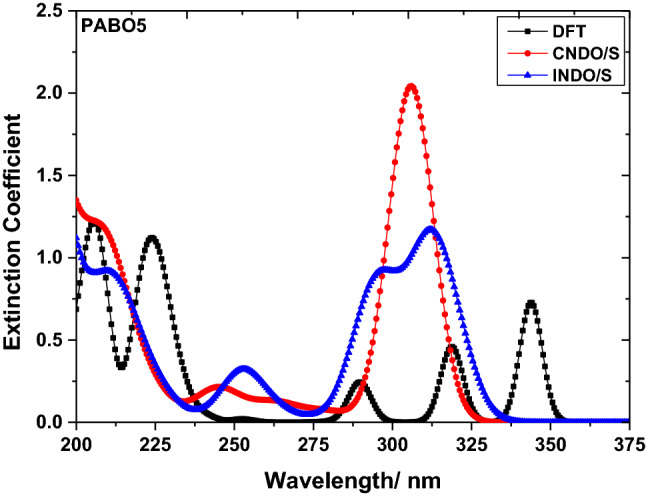
UV absorption profile molecules PABO5 molecule using DFT, CNDO/S, and INDO/S methods
Table 1.
The absorption bands (AB), extinction coefficients (EC), oscillator strength (f), vertical transition energy (EV), HOMO (H), LUMO (L) energies, and the band gap (Eg = ELUMO − EHOMO) of PABO4 and PABO5 molecules
| Molecule | Method | AB/nm | EC* | f | EV/eV |
|---|---|---|---|---|---|
| PABO4 | DFT | 201.17 | 1.02 | 0.39 | 6.15 |
| 220.51 | 1.70 | 0.43 | 5.60 | ||
| 301.95 | 0.96 | 0.92 | 4.11 | ||
| 330.08 | 0.19 | 0.18 | 3.75 | ||
| 350.00 | 0.29 | 0.29 | 3.54 | ||
| H = − 7.74 eV, | L = − 0.39 eV, | Eg = 7.35 eV | |||
| CNDO/S | 203.51 | 1.59 | 0.25 | 6.04 | |
| 296.09 | 1.66 | 1.30 | 4.15 | ||
| H = − 8.44 eV, | L = − 1.42 eV, | Eg = 7.02 eV | |||
| INDO/S | 207.03 | 1.31 | 0.34 | 6.00 | |
| 278.51 | 0.99 | 0.84 | 4.44 | ||
| 308.98 | 1.05 | 1.00 | 4.01 | ||
| H = − 7.28 eV, | L = − 0.34 eV, | Eg = 6.94 eV | |||
| PABO5 | DFT | 205.86 | 1.22 | 0.22 | 6.03 |
| 224.02 | 1.12 | 0.13 | 5.52 | ||
| 289.65 | 0.24 | 0.22 | 4.28 | ||
| 318.95 | 0.46 | 0.46 | 3.89 | ||
| 343.55 | 0.73 | 0.64 | 3.60 | ||
| H = − 7.68 eV, | L = − 0.55 eV, | Eg = 7.13 eV | |||
| CNDO/S | 245.12 | 0.21 | 0.20 | 5.07 | |
| 306.05 | 2.04 | 1.79 | 4.05 | ||
| H = − 7.22 eV, | L = − 0.48 eV, | Eg = 6.82 eV | |||
| INDO/S | 209.37 | 0.92 | 0.03 | 5.94 | |
| 252.73 | 0.32 | 0.31 | 4.91 | ||
| 311.91 | 1.17 | 0.88 | 3.99 | ||
| H = − 7.22 eV, | L = − 0.48 eV, | Eg = 6.74 eV |
Bold value represents λmax/nm. *EC unit: 104 dm3 mol−1 cm−1
Upon comparing these wavelengths, one may notice that when we move from PABO4 to PABO5, the DFT data show a hypochromic effect (blue-shift), whereas both semiempirical approaches show a red-side move of wavelength with a hyperchromic effect. In general, the hypsochromically moved bands are in general deemed to be a sign of the strong coupling of excitons. The electronic excitation is not restrained to one of the chromophores and gets delocalised over the array of chromophores when the many chromophores are positioned in closer spatial propinquity. This is known as exciton coupling which is of fundamental importance and determines the functional properties of molecules for various types of devices. Hence, distinct absorption trends are expected for the molecules under analysis. The shifts towards the red wavelength side in this analysis are noticed owing to the lowering in transition (Table 1), whenever electron excitation occurs. Therefore, this leads to much dominant electrostatic interaction of absorption bands and further variation in charge distribution. This, in turn, enhances the delocalization of electrons. One more noteworthy aspect of this study is the extent and strength of chromophores during the coupling of excitons that induces n → π* type of transitions. It may be understood that the prime influencing factor for these type of transitions is controlled by the rigidity of molecular ring structure that further alters the remaining spectral features.
UV light sensing applications
The research studies and understanding of the procedures happening upon molecular irradiation with ultraviolet (UV) light are imperative as these procedures may direct to the dreadful conditions of molecules that hamper the device's performance. The photophysics and chemistry of the molecular chromophores have been considered comprehensively. The photophysical properties of mono-molecules are fairly well understood; however, the nature of the photo-initiated processes in several molecular chromophores is still under debate. The largest wavelength in the UV absorption region for PABO4 has been noticed to be 350 nm (DFT), 296.09 nm (CNDO/S), and 308.98 nm (INDO/S). The PABO5 molecule demonstrates the largest absorption wavelength in the UV region at 343.55 nm (DFT), 306.05 nm (CNDO/S), and 311.91 nm (INDO/S) (data of Table 1). The extinction coefficient values corresponding to these wavelengths are found to be greater for PABO5 molecule. Therefore, from the majority of the above data from Table 1, we may observe that below 400 nm, PABO5 molecule absorbs UV larger wavelength that revealing the more UV light sensing capability for this molecule. Hence, this molecule has been deemed to be greatly flexible for UV region electronic transitions. The visible display features of both molecules have been considered to be of great level since no absorption visible region has been observed for both the molecules. The exciton theory from the perturbation view may be understood by the conserved nature of chromophores by their individuality; the coupling trend of excitons is illustrated as a relation amid the transition fluctuating transition dipole moments that are localized. This kind of couple leads towards the splitting of the excited energy state which modifies the discrepancy in the absorption spectral features.
The flexibility of transitions
Computational evolution helps in establishing an unyielding direction in analysing the molecular transitions and properties of a targeted chromophore. Detailed study of the spectra in the UV–Vis region helps in understanding the details of the structure and their probable applications, and the analysis of the transition that is liable for the requisite absorption of light. For the occurrence of a transition, the dipole that oscillates should be excited through the electric field interaction along with the electromagnetic waves externally. The oscillator strength is estimated by depicting the coefficient of line absorption that helps to quantify the flexibility of transitions and their strength.
Figure 4 illustrates the flexibility of transitions for PABO4 molecule based on the three methods as mentioned. The chosen region of wavelength is the same approximately for the plotting of the oscillator strength offset values. The DFT data reveal that the initial point of wavelength for PABO4 is 201.7 nm, and the final point is 309.04 nm, which shows the transitions are in the 100.1-nm region. In the same way, a UV region of 97.84 nm and 109.67 nm for PABO4 has been observed based on CNDO/S and INDO/S approaches. A similar view of PABO5 molecule from Fig. 5 indicates a UV region of 143.9 nm (DFT), 104.83 (CNDO/S), and 110.81 nm (INDO/S). Therefore, a wider region in terms of UV wavelength has been observed for PABO5 compared to PABO4 based on any chosen method. It has been noticed that sudden rise in the oscillator strength data at a specific wavelength for both the molecules. This enhances and induces the extinction coefficient data and spectral characteristics. This implies that the molecules under investigation are appropriate for light modulator devices.
Fig. 4.

Offset oscillator strength value as a function of wavelength of PABO4 using three methods
Fig. 5.

Offset oscillator strength values as a function of wavelength of PABO5 using three methods
Switching applications
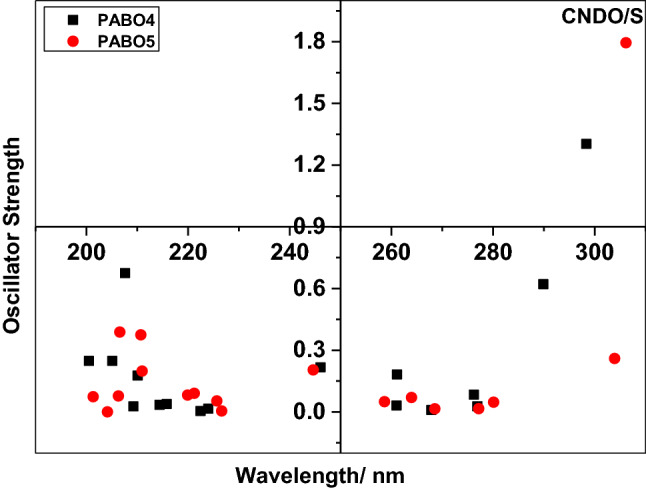
In order to understand the switching applications, the oscillator strength data based on the DFT approach are analysed in Fig. 6. From the figure, one may notice that the lower left quadrant contains maximum data points with an oscillator strength value between 0 and 0.4 within the wavelength region of 200 nm to 280 nm. The lower right side quadrant contains oscillator strength data points with oscillator strength values between 0 and 0.4 with a wavelength region between 280 and 360 nm. Further, the top left and right quadrants contain a minimum number of oscillator strength data points from 0.6 to 1. The top left quadrant within a wavelength region 200 nm to 280 nm contains three data points, and the top right quadrant with a wavelength region contains two data points. The quadrant-wise analysis clearly indicates the transition flexibility of the molecules.
Fig. 6.

Analysis of wavelength versus oscillator strength in quadrant system using DFT method
The DFT highest oscillator strength value for PABO4 molecule has been found to be 0.99 corresponding to 218.6 nm, and the minimum value has been found to be 0.001 corresponding to 279.5 nm. Therefore, the wavelength difference of 60.9 nm has been noticed for a relative oscillator strength value of 0.989. In the same way, PABO5 molecule exhibits the highest and lowest oscillator strength values of 0.64, 0.002 corresponding to 344 nm, 284.2 nm, respectively. Hence, the wavelength difference of 59.8 nm has been noticed for relative oscillator strength of 0.638. This analysis reveals that the minimum wavelength region has been found for PABO5 molecule confirming better switching applications. However, a better relative oscillator strength value has been noticed for the PABO4 molecule that revealing a better light modulation capability. The analysis of wavelength versus oscillator strength in quadrant system using CNDO/S and INDO/S methods is presented in Figs. 7 and 8, respectively. A similar analysis using INDO/S data is in clear agreement with the DFT data revealing PABO5 molecule to exhibit better switching and PABO4 molecule for better light modulation applications. However, CNDO/S method shows some discrepancy in agreeing on this result. The discrepancy in analysing the data of the electronic transitions of the compounds is in general implicit as a sign of the scope of charge estimation and distribution of molecules.
Fig. 7.
Analysis of wavelength versus oscillator strength in quadrant system using CNDO/S method
Fig. 8.

Analysis of wavelength versus oscillator strength in quadrant system using INDO/S method
Components of energy
The components of energy have been accounted for in Table 1. It is apparent from the data that all the energy components are moderately sensitive to the number of carbon atoms number in the linking group. The HOMO energies increment, the decrement in gaps of L–H and the transferred red side transition energies in general are featured in the enhanced interactions that are delocalized. The gap of L–H decrements from the table clarifies the features of red-shift of the compound. Moreover, the decreased gaps of L–H designate the many intermolecular prominent interactions, which are necessary to be promoted for spectral red-side shift. The relative end results disclose that the PABO5 molecule has a low value of band gap that causes greater conductivity compared to PABO4. Therefore, the lower gap confirms the eventual charge transport molecular interactions.
Conclusions
The current work on dimeric smectic compounds signifies that the PABO5 molecule shows a greater UV wavelength that confirms the UV higher stability. Further, lower than 400 nm, PABO5 absorbs a greater UV wavelength that signifies greater sensing capability in the UV region. The visible display features of both molecules have been considered to be of great level since no visible absorption region has been observed for both molecules. There is a sudden rise in the oscillator strength data at a specific wavelength for both the molecules. This enhances and induces the extinction values and spectral characteristics. This implies the molecules under investigation are appropriate for light modulator devices. This analysis reveals that the minimum wavelength region has been found for PABO5 molecule that confirms better switching applications. However, a better relative oscillator strength value has been noticed for PABO4 molecule revealing a better light modulation capability.
Author contribution
P.D., T.J.J., and A.G. did conceptualization, work design, and formulation of the problem; P.D., T.J.J., A.G., and P.L.P. performed formal analysis, investigation, and paper writing; P.L.P. done supervision and correcting the manuscript.
Funding
Nil.
Data availability statement
Not applicable.
Declarations
Conflict of interest
The authors declare no conflict of interest.
Footnotes
Novel Molecular Materials and Devices from Functional Soft Matter. Guest editors: Jean-Marc Di Meglio, Aritra Ghosh, Orlando Guzmán, P. Lakshmi Praveen.
References
- 1.Patari S, Chakraborty S, Nath A. Liq. Cryst. 2016;43:1017. doi: 10.1080/02678292.2016.1155767. [DOI] [Google Scholar]
- 2.Kumar BVNP, Mattea C, Stapf S, Dabrowski R. Liq. Cryst. 2017;44:1494. doi: 10.1080/02678292.2017.1290289. [DOI] [Google Scholar]
- 3.Kishor MH, Mohan MLNM. J. Electr. Mater. 2020;49:2311. doi: 10.1007/s11664-020-07944-y. [DOI] [Google Scholar]
- 4.Reddy MK, Reddy KS, Kumar BVNP, Narasimhaswamy T. Mol. Cryst. Liq. Cryst. 2014;593:1. doi: 10.1080/15421406.2013.858013. [DOI] [Google Scholar]
- 5.Ramakrishna DS, Jose TJ, Lakshmi Praveen P. J. Mol. Struct. 2021;1236:130336. doi: 10.1016/j.molstruc.2021.130336. [DOI] [Google Scholar]
- 6.Walker R, Pociecha D, Stroey JMD, Gorecka E, Imire CT. J. Mater. Chem. C. 2021;9:5167. doi: 10.1039/D1TC00904D. [DOI] [Google Scholar]
- 7.Perju E, Marin L. Molecules. 2021;26:2183. doi: 10.3390/molecules26082183. [DOI] [PMC free article] [PubMed] [Google Scholar]
- 8.Viswanath LCK, Senthil S. Mol. Cryst. Liq. Cryst. 2017;656:12. doi: 10.1080/15421406.2017.1386518. [DOI] [Google Scholar]
- 9.Lakshmi Praveen P, Ojha DP. Phase Trans. 2014;87:641. doi: 10.1080/01411594.2013.879478. [DOI] [Google Scholar]
- 10.Lakshmi Praveen P, Ojha DP. J. Phys. Chem. Solids. 2012;73:57. doi: 10.1016/j.jpcs.2011.09.017. [DOI] [Google Scholar]
- 11.Kataoka M, Okada H. Liq. Cryst. 2020;47:1735. doi: 10.1080/02678292.2020.1723034. [DOI] [Google Scholar]
- 12.Hemaida A, Ghosh A, Sundaram S, Mallick TK. Sol. Energy. 2020;195:185. doi: 10.1016/j.solener.2019.11.024. [DOI] [Google Scholar]
- 13.Ghosh A, Norton B, Mallick TK. Sol. Energy Mater. Sol. Cells. 2018;174:572. doi: 10.1016/j.solmat.2017.09.047. [DOI] [Google Scholar]
- 14.Qu R, Li G. Biosensors. 2022;12:205. doi: 10.3390/bios12040205. [DOI] [PMC free article] [PubMed] [Google Scholar]
- 15.Luan C, Luan H, Luo D. Micromachines. 2020;11:176. doi: 10.3390/mi11020176. [DOI] [PMC free article] [PubMed] [Google Scholar]
- 16.Kalita P, Singh RK, Bhattacharjee A. Liq. Cryst. 2022;49:297. doi: 10.1080/02678292.2021.1962423. [DOI] [Google Scholar]
- 17.Mishra K, Singh B. Liq. Cryst. 2021;48:980. doi: 10.1080/02678292.2020.1836275. [DOI] [Google Scholar]
- 18.Joon DY, Jang CH. Liq. Cryst. 2022;49:1285. doi: 10.1080/02678292.2022.2028315. [DOI] [Google Scholar]
- 19.Lakshmi Praveen P, Ojha DP. J. Mol. Model. 2012;18:1513. doi: 10.1007/s00894-011-1171-8. [DOI] [PubMed] [Google Scholar]
- 20.Goswami D, Mandal PK, Gutowski O, Sarma A. Liq. Cryst. 2019;46:2115. doi: 10.1080/02678292.2019.1613690. [DOI] [Google Scholar]
- 21.Lakshmi Praveen P, Ramakrishna DS, Ojha DP. Mol. Cryst. Liq. Cryst. 2017;643:76. doi: 10.1080/15421406.2016.1262702. [DOI] [Google Scholar]
- 22.Koch W, Holthausen MC. A Chemist’s Guide to Density Functional Theory. Weinheim, Germany: Wiley-VCH; 2000. [Google Scholar]
- 23.Ochi M, Tsuneyuki S. J. Chem. Theory Comput. 2014;10:4098. doi: 10.1021/ct500485b. [DOI] [PubMed] [Google Scholar]
- 24.Kirkpatrik J. Int. J. Quant. Chem. 2008;108:51. doi: 10.1002/qua.21378. [DOI] [Google Scholar]
- 25.Cinacchi G, Colle R, Parruccini P, Tani A. J. Chem. Phys. 2018;129:174708. doi: 10.1063/1.3003075. [DOI] [PubMed] [Google Scholar]
- 26.Adachi M, Nakamura S. Dyes Pigm. 1991;17:287. doi: 10.1016/0143-7208(91)80021-Z. [DOI] [Google Scholar]
- 27.Mustroph H. Phys. Sci. Rev. 2019;4:20190040. [Google Scholar]
- 28.Seddon JM, Williams DJ. Liq. Cryst. 1995;18:761. doi: 10.1080/02678299508036687. [DOI] [Google Scholar]
- 29.Rajkumar V, Ramakrishna DS, Rajesh BM, Jaya Shree A. J. Flour. Chem. 2022;257–258:109989. [Google Scholar]
- 30.Rajkumar V, Jaya Shree A, Rajesh BM, Ramakrishna DS. J. Flour. Chem. 2022;261–262:110019. [Google Scholar]
- 31.Wlodarska M, Leszczak BM. Int. J. Mol. Sci. 2021;22:3424. doi: 10.3390/ijms22073424. [DOI] [PMC free article] [PubMed] [Google Scholar]
- 32.Becke AD. J. Chem. Phys. 1993;98:5648. doi: 10.1063/1.464913. [DOI] [Google Scholar]
- 33.Lakshmi Praveen P. Mol. Cryst. Liq. Cryst. 2018;667:44. doi: 10.1080/15421406.2018.1553755. [DOI] [Google Scholar]
- 34.Schapiro I, Neese F. Comput. Theor. Chem. 2014;1040–1041:84–98. doi: 10.1016/j.comptc.2014.04.002. [DOI] [Google Scholar]
- 35.Lakshmi Praveen P, Ojha DP. J. Mol. Liq. 2014;194:8. doi: 10.1016/j.molliq.2014.01.002. [DOI] [Google Scholar]
- 36.Ojha DP, Lakshmi Praveen P. J. Phys. Chem. Solids. 2012;73:57. doi: 10.1016/j.jpcs.2011.09.017. [DOI] [Google Scholar]
- 37.Das P, Lakshmi Praveen P. IOP Conf. Ser. Mater. Sci. Eng. 2020;798:012041. doi: 10.1088/1757-899X/798/1/012041. [DOI] [Google Scholar]
- 38.LakshmiPraveen P. J. Mol. Liq. 2021;341:117424. doi: 10.1016/j.molliq.2021.117424. [DOI] [Google Scholar]
- 39.LakshmiPraveen P. J. Mol. Liq. 2021;343:117620. doi: 10.1016/j.molliq.2021.117620. [DOI] [Google Scholar]
Associated Data
This section collects any data citations, data availability statements, or supplementary materials included in this article.
Data Availability Statement
Not applicable.