Abstract
Aster tataricus (L.) is an important medicinal plant in China. Its roots are rich in flavonoids, the main medicinal components. However, the molecular basis of flavonoid biosynthesis in the roots of A. tataricus remains unclear. In this study, the content of total flavonoid of A. tataricus roots at different developmental stages was measured first, and the results showed that the content of total flavonoid gradually decreased from September to November, which may be caused by the stagnation of A. tataricus growth due to the decrease in temperature after September. Then, an integrated analysis of transcriptome and metabolome was conducted on five developing stages of A. tataricus roots to identify flavonoid compositions and potential genes involved in flavonoid biosynthesis. A total of 80 flavonoid metabolites, of which 75% were flavonols and flavonoids, were identified in metabolomic analyses, among which isorhamnetin, kaempferol, quercetin, and myricetin were the main skeletons of these flavonoids. Cluster analysis divided these 80 flavonoids into 3 clusters. The compounds in cluster I mainly accumulated in S1, S3, and S5. In cluster II, the relative content of the flavonoid metabolites showed an upward trend from S2 to S4. In cluster III, the flavonoids decreased from S1 to S5. A total of 129 structural genes, including 43 PAL, 23 4CL, 9 C4H, 4 CHS, 18 CHI, 3 F3H, 5 F3’H, 1 F3′5′H, 21 FLS, and 2 FSII, and 65 transcription factors, including 22 AP2/ERF, 7 bHLH, 5 bZIP, 8 MYB, 11 NAC, and 12 WRKY, showed significant correlation with total flavonoid content. Eighteen genes (7 4CL, 5 C4H, 2 CHI, 1 F3H, and 3 FLS) and 30 genes (5 PAL, 9 4CL, 1 C4H, 2 CHI, 1 F3H, 1 DFR, 7 3AT, 1 BZ1, and 3 UGT79B1) were identified as key structural genes for kaempferol and anthocyanins biosynthesis, respectively. Our study provides valuable information for understanding the mechanism of flavonoid biosynthesis in A. tataricus root.
Supplementary Information
The online version contains supplementary material available at 10.1007/s10265-022-01426-4.
Keywords: Aster tataricus, Differentially expressed genes, Flavonoids, Metabolite, Transcriptome
Introduction
Aster tataricus (L.) (known as ‘Ziwan' in Chinese) is an important medicinal plant in the Compositae family. In China, A. tataricus is mainly distributed in Anguo City, Hebei Provinces, the genuine producing area of aster, and Bozhou City, Anhui Province. In addition, it is also cultivated in Japan and North Korea. Its dried root and rhizome (Asteris Radix et Rhizoma, AR) have been widely used as a traditional medicine to treat cough, inflammation, and asthma for more than 2,000 years (Chen et al. 2020a; Yu et al. 2015). Also, AR can be used in the treatment of novel coronavirus pneumonia (COVID-19) because of the effect of moistening lung for arresting cough, resolving phlegm, and relieving asthma (Chen et al. 2020b; Ren et al. 2021).
The roots of A. tataricus are rich in chemical components, including phenolic acids, organic acids, flavonoids, terpenoids, and coumarin (Sun et al. 2018; Zhao et al. 2015). Flavonoids, such as quercetin and kaempferol, are important active ingredients in A. tataricus roots. Chen et al. identified 31 flavonoids from A. tataricus by UHPLC-Q-TOF-MS (Chen et al. 2019). Sun et al. extracted 31 flavonoids from rhizomes of A. tataricus by UHPLC-Q-TOF-MS and showed quercetin may have antidepressant effects (Sun et al. 2018). (2R,2′R)-7-O-methyl–2,3,2′′,3′′–tetrahydrorobustaflavone, a new flavonoid isolated from A. tataricus, can significantly inhibit A594 cancer cells proliferation (Chen et al. 2022). As the largest group of secondary metabolites in plants, flavonoids not only contribute to diverse human health benefits, but also provide plants with a variety of biological functions, such as diseases treatment for humans and stress resistance for plants (Ng et al. 2003; Treutter 2005; Wang et al. 2020; Wen et al. 2021). Flavonols may facilitate maize (Zea mays) seedling drought tolerance by scavenging H2O2 and stomatal closure (Li et al. 2021a). Quiroz et al. reported that flavonoids formononetin and genistein protect plants by eliciting an antifeedant effect on H. obscurus (Quiroz et al. 2017). In addition, anthocyanins are flavonoids that impart bright color to plant tissues (Olivas-Aguirre et al. 2016).
However, the current research on A. tataricus mainly concentrates on the pharmacological and chemical components, and very little research focuses on the molecular mechanism of accumulation of flavonoids (Cheng and Shao 1993; Su et al. 2019; Yu et al. 2015). Therefore, it is important to dissect the biosynthesis pathway of flavonoid in the roots of A. tataricus, which will be helpful for guiding the quality breeding and increasing the content of flavonoids. In recent years, with the development of UPLC-MS/MS and sequencing technology, the combination of metabolomics and transcriptomics has been widely used to investigate the metabolites and reveal the biosynthesis pathway of metabolites in plants (Li et al. 2019). In this study, we integrated the analysis of metabolomics and transcriptomics to investigate flavonoid biosynthesis in developing roots of A. tataricus at 5 different stages. The purpose of our study was to examine the species of flavonoids, and analyze the differentially expressed genes involved in flavonoid biosynthesis in the roots of A. tataricus during development. Our results revealed the accumulation pattern of flavonoids during root development of A. tataricus, identified the key genes involved in the flavonoid biosynthesis pathway, and provided valuable information for the further study of flavonoids in A. tataricus.
Materials and methods
Plant materials
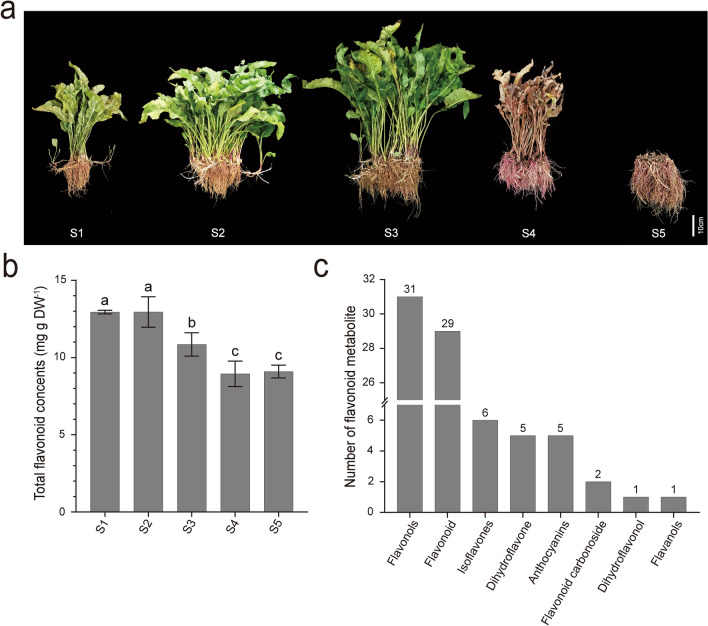
The A. tataricus ‘Qiziwan’, which is a landrace grown in Anguo, China, were grown at the germplasm resource center at Chinese Medicine Capital Expo Park, Anguo, China, in 2019 and subjected to normal field management during the growth periods. A. tataricus grow rapidly from August to September. The growth of A. tataricus became slow after September, and the aerial parts of A. tataricus gradually began to dry up. Only the underground part remains in December. We speculate that the content of flavonoids in A. tataricus roots is not constant from August to December. Therefore, roots were harvested on the 15th of August (S1), September (S2), October (S3), November (S4), and December (S5), respectively (Fig. 1a). For each sample, the mixed roots were collected from five independent plants and had three independent biological replicates. All materials were frozen in liquid nitrogen and stored at – 80 ℃ until further use.
Fig. 1.
Phenotypes, total content of flavonoid, and number of flavonoid metabolites of A. tataricus “Qiziwan” at different developmental stages. S1, S2, S3, S4, and S5 represent A. tataricus were harvested on the 15th of August, September, October, November and December, respectively. a Phenotypes of A. tataricus “Qiziwan” at different developmental stages. b Changes in total content of flavonoid during A. tataricus root development. Error bars represent ± standard deviation (n = 3). Statistical analyses were performed by Duncan’s multiple range tests, P < 0.05. (c) Number of flavonoid metabolites detected in A. tataricus roots in each categorie. The number above the column represents the number of the categories
Measurement of total flavonoid content
Total flavonoid measurement was carried out by the aluminum nitrate colorimetric method (Hossain and Rahman 2011). The freeze–dried roots were crushed using a mixer mill (MM 400, Retsch) with a zirconia bead for 1.5 min at a frequency of 30 Hz. Approximately 1.0 g root powder was weighed and extracted 15 min at 30 ℃ with 15 mL 80% methanol aqueous solution to obtain the crude extract. 300 μL crude extract was mixed with 90 μL of 5% NaNO2 solution and 1.5 mL deionized water. Then 180 μL 10% Al(NO3)3 solution was added after 6 min of incubation, and the mixture was incubated for another 5 min. Subsequently, 600 μL of 1 mol L−1 NaOH solution was added and the final volume of the mixture solution was 3 mL. Then the absorbance was measured at a wavelength of 510 nm by the microplate reader. Rutin was used as a standard solution to prepare a calibration curve, and the results were expressed as rutin equivalent on a dry weight basis.
Metabolite extraction and profiling analysis
Metabolite extraction and profiling analyses were performed by Metware Biotechnology Co., Ltd. (Wuhan, China). The experimental procedure was done following the company's standard instruction (Chen et al. 2013; Dong et al. 2014, 2019). In brief, 100 mg root powder was weighed and extracted overnight at 4 ℃ with 0.6 mL 70% methanol aqueous solution. After centrifugation at 10,000 g for 10 min, the supernatant was filtered through a 0.22 μm microporous membrane for UPLC-MS/MS analysis.
Chromatographic separation was carried out on a Waters ACQUITY UPLC HSS T3 system (Shim-pack UFLC SHIMADZU CBM30A), which was equipped with an Agilent SB-C18 column (1.8 µm, 2.1 mm × 100 mm), at 40 ℃. The injection volume was 4 μL at a flow rate of 0.35 mL min−1. The mobile phase was ultrapure water (with 0.1% formic acid): acetonitrile. The elution gradient was as follows: 0 min, 95:5 water/acetonitrile (v/v); 9.0 min, 5:95 water/acetonitrile; 10.0 min, 5:95 water/acetonitrile; 11.1 min, 95:5 water/acetonitrile; and 14.0 min, 95:5 water acetonitrile. The effluent was alternatively connected to an ESI–triple quadrupole–linear ion trap (QTRAP)-MS.
Metabolites were detected using an Applied Biosystems 4500 QTRAP LC/MS/MS system equipped with linear ion trap (LIT) and triple quadrupole (QQQ) scans. This system was controlled by Analyst 1.6.3 software. The ESI source operation parameters were as follows: ion source, turbo spray; source temperature, 550 °C; ion spray voltage (IS), 5,500 V; curtain gas (CUR) 25.0 psi; and collision–activated dissociation (CAD), high. Ten and 100 μmol L−1 polypropylene glycol solutions were used in the QQQ and LIT modes, respectively, for the instrument tuning and mass calibration. QQQ scans were acquired as multiple reaction monitoring (MRM) experiments with collision gas (nitrogen) set to medium. Declustering potential (DP) and collision energy (CE) measurements for individual MRM transitions were completed with further DP and CE optimization. A specific set of MRM transitions was monitored for each period according to the metabolites eluted within the period (Chen et al. 2013).
Mass spectral data analysis was conducted with the software Analyst 1.6.3. The flavonoids were qualitatively and quantitatively analyzed by blasting with the local database. Principal component analysis (PCA) and partial least-squares discriminant analysis (OPLS-DA) analysis were carried out for identifying differentially expressed flavonoids. Significantly different metabolites between groups were determined by the variable importance in projection (VIP) ≥ 1 and fold change ≥ 2 or ≤ 0.5.
RNA extraction, quantification and sequencing
Total RNA was extracted from frozen roots using the OminiPlant RNA Kit (Dnase) (cwbio, Jiangsu, China). RNA integrity and contamination was monitored by 2% agarose gel. RNA purity was detected using a NanoDrop one spectrophotometer (Thermo Scientific, Shanghai, China). The concentration of RNA was accurately measured using a Qubit 2.0 Fluorometer. The quality of RNA was detected using an Agilent 2100 Bioanalyzer (Agilent Technologies, Santa Clara, CA, USA). Poly(A) mRNA was enriched from total RNA by Oligo(dT) magnetic beads, followed by fragmentation of poly(A) mRNA into short fragments. The first-strand cDNA was generated by reverse transcription using the fragment RNA as a template and using random hexamers primers. Second-strand cDNA was synthesized using DNA polymerase I. Double-stranded cDNA was then purified using AMPure XP beads. End–repaired and addition of a poly(A) tail of the purified double-stranded cDNA, and a sequencing adapter was ligated. Fragments of suitable size were isolated. The cDNA library was obtained by PCR enrichment. The cDNA library was sequenced on an Illumina HiSeq™ 2500 platform.
RNA sequencing data analysis
High–quality reads are the basis for accurate subsequent analysis. To acquire high–quality reads, strict quality control of the data was carried out. Clean reads were obtained from raw data by removing reads with adapters, low-quality reads, and reads containing too many N (the N content exceeds 10% of the number of bases in the read). The transcriptome was obtained by assembling clean reads using Trinity software. The longest cluster sequence obtained after corset hierarchical clustering was used as unigenes for subsequent analysis. The unigenes sequence were aligned with the KEGG, NR, Swiss-Prot, GO, COG/KOG, and Trembl databases using BLAST software. After predicting the amino acid sequence of unigenes, the HMMER software was used to compare with the Pfam database to obtain the annotation information of unigenes.
Gene expression levels were estimated using bowtie 2 in RSEM software. Differentially expressed genes (DEGs) between different sample groups were analyzed using DESeq 2 (Love et al., 2014; Varet et al., 2016). The false discovery rate (FDR) was obtained by multiple hypothesis testing for hypothesis testing probability (P-value) using the Benjamini–Hochberg method. Significantly different genes between groups were determined by |log2 Fold Change|≥ 1 and FDR < 0.05.
The KEGG pathway and GO term of the DEGs were obtained from the Kyoto Encyclopedia of Genes and Genomes websites (KEGG, https://www.genome.jp/kegg) and the Gene Ontology websites (GO, http://www.geneontology.org/), respectively (Gene Ontology Consortium 2015; Kanehisa et al. 2016). We conducted a hypergeometric test to find the KEGG pathways or GO terms that are significantly enriched in DEGs compared to the whole genome background. The DEGs were aligned to the KOG database using Blast software to obtain the KOG annotation.
Joint analysis of transcriptome and metabolome
The DEGs and differentially accumulated metabolites (DAMs) of flavonoid biosynthesis–related pathways in each comparison group (S1 vs S2, S1 vs S3, S1 vs S4, S1 vs S5, S2 vs S3, S2 vs S4, S2 vs S5, S3 vs S4, S3 vs S5, and S4 vs S5) were screened according to the relative contents of flavonoid metabolites and gene expression values in the roots of A. tataricus at different developmental stages. First, the correlation of DEGs and DAMs was obtained by calculating their Pearson correlation coefficients. Pearson’s correlation coefficient ≥ 0.8 was considered to be significantly correlated. Then, DEGs and DAMs, which with significant correlations, were mapped to the KEGG pathway database to gather information about their shared pathways to better comprehend their interaction.
Weighed gene co-expression network analysis
In order to further examine the genes that are strongly connected to the traits (total flavonoid content, kaempferol content, 5 anthocyanins content, and the variation trends of 3 clusters of flavonoid metabolites) of A. tataricus, the R software WGCNA package was used to generate a weighted gene co-expression network (Ghazalpour et al. 2006). The co-expression modules were obtained by using the one–step network construction function with following parameters: maxBlockSize: 20,000, soft–threshold power: 13, TOMtype: unsigned, mergeCutHeight: 0.25, minModuleSize: 300, and other parameters: default. The correlation between the modules and the traits was further obtained by calculating the eigenvectors of each module.
qRT-PCR analysis
Twenty DEGs involved in flavonoid biosynthesis obtained in the RNA-seq data were selected for confirmation by qRT-PCR. The cDNA, which was used as a template to measure gene expression level, was obtained by reverse transcription of the total RNA of A. tataricus root according to the TRUEscript RT MaseterMix (OneStep gDNA Removal) (Aidlab, Beijing, China). The A. tataricus actin gene was taken as a reference in all experiments to normalize gene expression level. The comparative 2−ΔΔCT method was used to quantify the gene expression level as described previously (Schmittgen and Livak 2008). The primers, including the flavonoid biosynthesis related genes and the A. tataricus actin gene (internal control), used in qRT-PCR are listed in Table S1.
Statistical analysis
Statistical analysis was performed using Excel 2016 software (Microsoft Office, USA). Data are presented as means ± standard deviations (SD). Differences between samples were determined by one–way analysis of variance (ANOVA) and the levels of statistical significance were calculated by the least significant difference (P < 0.05).
Results
Dynamic changes of total flavonoid content during the root development in A. tataricus
To investigate the accumulating trends of flavonoids in the roots of A. tataricus, the total content of flavonoid was measured at five developmental stages. As shown in Fig. 1b, the total content of flavonoids in roots at S1 and S2 stages was about 12.95 mg g−1 of dry weight, while at S3 and S4, it was significantly reduced to 10.85 mg g−1 and 8.94 mg g−1, respectively, and it was 9.10 mg g−1 at S5, which had no significant difference from S4. These results showed that the total flavonoid content in roots of A. tataricus began to decrease at S2 until S4.
Flavonoids showing differential accumulated during the root development in A. tataricus
Furtherly, we analyzed the metabolome data obtained by UPLC/ESI–Q TRAP-MS/MS. A total of 80 flavonoid metabolites, including 31 flavonols, 29 flavonoids, 6 isoflavones, 5 dihydroflavones, 5 anthocyanins, 2 flavonoid carbonosides, 1 dihydroflavonol, and 1 flavanol, were identified at these five stages (Tables 1, S2, Fig. 1c). 70% of the flavonoids detected here are flavonoid glycosides, among which the most prevalent three glycosides were glucoside (37), galactoside (6), and hexoside (6) (Table S3).
Table 1.
Classification and relative content of the top flavonoids determined during A. tataricus roots development
| Compounds | Class | S1 | S2 | S3 | S4 | S5 |
|---|---|---|---|---|---|---|
| Quercetin-3-O-α-l-rhamnopyranoside | Flavonoid | 2.94 × 10⁷ | 1.17 × 10⁷ | 1.92 × 10⁷ | 3.06 × 10⁷ | 2.36 × 10⁷ |
| Luteolin 3'-O-β-d-glucoside | Flavonoid | 2.89 × 10⁷ | 1.16 × 10⁷ | 1.87 × 10⁷ | 3.03 × 10⁷ | 2.32 × 10⁷ |
| Kaempferol-3-O-glucoside (Astragalin) | Flavonols | 2.87 × 10⁷ | 1.12 × 10⁷ | 1.89 × 10⁷ | 3.03 × 10⁷ | 2.31 × 10⁷ |
| Luteolin-4'-O-β-d-glucoside | Flavonoid | 2.85 × 10⁷ | 1.15 × 10⁷ | 1.85 × 10⁷ | 3.02 × 10⁷ | 2.35 × 10⁷ |
| Kaempferol-3-O-(6´´-acetyl)-glucoside | Flavonols | 1.50 × 10⁷ | 7.95 × 10⁶ | 1.36 × 10⁷ | 2.06 × 10⁷ | 1.02 × 10⁷ |
| Quercetin-3-O-(6´´-O-malonyl)-galactoside | Flavonols | 1.45 × 10⁷ | 8.15 × 10⁶ | 2.10 × 10⁷ | 3.09 × 10⁷ | 2.53 × 10⁷ |
| Kaempferol-3-O-(6´´-malonyl)-glucoside | Flavonols | 1.07 × 10⁷ | 5.22 × 10⁶ | 9.50 × 10⁶ | 1.56 × 10⁷ | 8.80 × 10⁶ |
| Isorhamnetin O-malonylglucoside | Flavonoid | 8.85 × 10⁶ | 2.57 × 10⁶ | 6.40 × 10⁶ | 6.51 × 10⁶ | 6.95 × 10⁶ |
| Quercetin-3-O-(6´´-O-acetyl)-galactoside | Flavonols | 7.21 × 10⁶ | 4.18 × 10⁶ | 9.20 × 10⁶ | 1.59 × 10⁷ | 1.16 × 10⁷ |
| 6-Hydroxykaempferol-7-O-glucoside | Flavonols | 5.56 × 10⁶ | 1.87 × 10⁶ | 4.88 × 10⁶ | 1.27 × 10⁷ | 7.26 × 10⁶ |
| Myricetin-O-rhamnoside | Flavonoid | 5.52 × 10⁶ | 1.68 × 10⁶ | 4.66 × 10⁶ | 1.21 × 10⁷ | 7.01 × 10⁶ |
| isohyperoside | Flavonols | 5.50 × 10⁶ | 1.81 × 10⁶ | 4.49 × 10⁶ | 1.23 × 10⁷ | 6.99 × 10⁶ |
| mlyricetin 3-O-B-d-glucopyranoside | Flavonoid | 4.96 × 10⁶ | 1.66 × 10⁶ | 4.31 × 10⁶ | 1.11 × 10⁷ | 6.21 × 10⁶ |
| Cyanidin-3-O-(6´´-Malonylglucoside) | Anthocyanins | 4.11 × 10⁶ | 3.67 × 10⁶ | 5.09 × 10⁷ | 1.72 × 10⁸ | 5.73 × 10⁷ |
| Trifolin | Flavonols | 3.69 × 10⁶ | 1.25 × 10⁶ | 2.44 × 10⁶ | 4.71 × 10⁶ | 3.63 × 10⁶ |
| Kaempferol-7-O-glucoside | Flavonols | 3.57 × 10⁶ | 1.31 × 10⁶ | 2.35 × 10⁶ | 4.73 × 10⁶ | 3.65 × 10⁶ |
| Hyperin | Flavonols | 3.54 × 10⁶ | 1.23 × 10⁶ | 3.12 × 10⁶ | 8.38 × 10⁶ | 4.66 × 10⁶ |
| Isorhamnetin-acetyl hexoside | Flavonols | 2.84 × 10⁶ | 8.76 × 10⁵ | 2.40 × 10⁶ | 3.14 × 10⁶ | 3.21 × 10⁶ |
| Diosmetin-7-O-galactoside | Flavonoid | 2.38 × 10⁶ | 1.29 × 10⁶ | 3.56 × 10⁶ | 1.51 × 10⁶ | 2.22 × 10⁶ |
| Chrysoeriol-O-malonylhexoside | Flavonoid | 2.19 × 10⁶ | 1.04 × 10⁶ | 2.87 × 10⁶ | 9.78 × 10⁵ | 1.68 × 10⁶ |
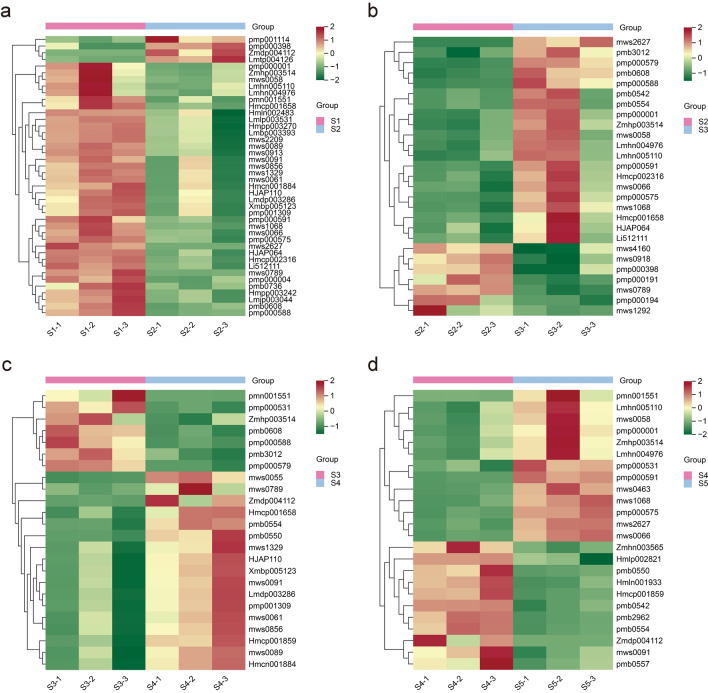
To gain insight into the variance of metabolites in different developmental stages of A. tataricus roots, DAMs were identified using the identification criterion of VIP ≥ 1 and fold change ≥ 2 or fold change ≤ 0.5 between pairwise comparisons (S1 vs S2, S2 vs S3, S3 vs S4, and S4 vs S5). Compared with S1, S2 had 4 flavonoids increased (1 flavonoid, 1 flavonol, 1 dihydroflavone, and 1 flavonoid carbonoside) and 38 flavonoids decreased (16 flavonoid, 19 flavonols, 2 isoflavones, and 1 dihydroflavone) (Fig. 2a). In the S2 and S3 comparison group, 27 differentially accumulated flavonoids were screened, with 20 upregulated (10 flavonoid, 6 flavonols, 2 isoflavones, and 2 anthocyanins) and 7 downregulated (1 flavonoid, 3 isoflavones, 2 dihydroflavone, and 1 flavonoid carbonoside) (Fig. 2b). The number of differentially accumulated flavonoids between S3 and S4 was 24, of which 17 (4 flavonoid, 10 flavonols, 1 dihydroflavone, and 2 anthocyanins) increased and 7 (5 flavonoid, 1 flavonol, and 1 dihydroflavonol) decreased (Fig. 2c). In the comparison group S4 and S5, 13 flavonoids increased and 11 decreased. The increased flavonoids include 5 flavonoid, 4 flavonols, 2 isoflavones, 1 dihydroflavone, and 1 dihydroflavonol, and the decreased flavonoids include 1 flavonoid, 5 flavonols, and 5 anthocyanins (Fig. 2d). It is interesting that although the total flavonoid content of S1 and S2 was not significantly different, in the comparison group S1 vs S2, the number of differential flavonoid compounds is the largest. It is worth noting that all the 80 detected flavonoids showed differentially accumulation during A. tataricus root development (Table S2).
Fig. 2.
Clustering heat map of differential accumulation of flavonoid metabolites in different comparison groups. a–d Represent the S1 vs S2, S2 vs S3, S3 vs S4, and S4 vs S5 comparison groups, respectively. The content of each metabolite is represented by a different color. Red indicates high content of metabolite, while low content metabolite is shown in green. S1, S2, S3, S4, and S5 represent aster harvested in August, September, October, November and December, respectively
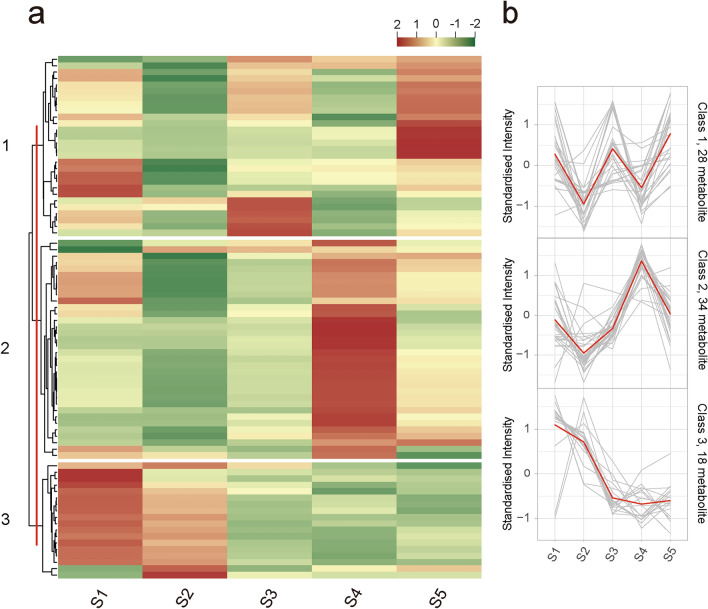
To understand the trends of metabolites in different developmental stages of A. tataricus roots, 80 flavonoids were clustered into 3 clusters based on the accumulation patterns of different metabolites using a K-means clustering algorithm (Fig. 3). The relative content of flavonoids in cluster I showed a trend of decline, rise, decline, and rise again during the five growth periods. In cluster II, the relative content of flavonoid metabolites showed an upward trend from S2 to S4, however, S1 to S2 and S4 to S5 showed a downward trend. In cluster III, the flavonoids kept decreasing from S1 to S5 (Fig. 3b). Notably, 5 anthocyanins, including 2 pelargonidin derivatives (Pelargonidin-3-O-(6′′-acetylglucoside) and Pelargonidin-3-O-(6′′-malonylglucoside)) and 3 cyanidin derivatives (Cyanidin-3-O-(3′′,6′′-dimalonylglucoside), Cyanidin-3-O-(6′′-Malonylglucoside), and Cyanidin-3-O-glucoside (Kuromanin)), were detected in our study, and they all belong to cluster II. The contents of these five anthocyanins were higher in the later stages of A. tataricus development (S4 and S5), especially in the S4 stage, when most of the A. tataricus roots were purple–red (Fig. 1a and Table S2). Pelargonidin derivatives have been reported to change the flower to vivid red, and cyanidin derivatives can turn fruit red (Nakatsuka et al. 2007; Olivas–Aguirre et al. 2016). Therefore, we speculate that the accumulation of these five anthocyanins is related to the reddening of A. tataricus roots.
Fig. 3.
Cluster analysis of all detected flavonoid metabolites in A. tataricus roots of five stages based on K-means clustering method. S1, S2, S3, S4, and S5 represent A. tataricus were harvested on the 15th of August, September, October, November and December, respectively. a Clustering heat map of all detected flavonoid metabolites in A. tataricus roots of five stages based on K-means clustering algorithm. Each column represents a sample and each row represents a metabolite. The content of each metabolite is represented by a different color. Red indicates high content of metabolite, while low content metabolite is shown in green. b Line chart of flavonoid accumulation patterns for three clusters
Analysis of differential expressed genes during root development in A. tataricus
To understand the potential molecular biosynthesis pathway of flavonoid in the developmental roots of A. tataricus. Fifteen cDNA libraries were constructed and subjected to high–throughput RNA-seq analysis. As a result, a total of 125.56 G clean reads and 837,144,592 base pairs were obtained from 15 independent samples of A. tataricus roots (Table S4). These clean reads were further assembled into 631,853 transcripts with a mean length of 798 bp and N50 length of 1,204 bp, and 505,334 unigenes with a mean length of 929 bp and N50 length of 1,307 bp using Trinity software (Table S5). To annotate the assembled unigenes, all unigenes were blasted with 7 publicly available nucleotide and protein databases, including KEGG, NR, Swiss-Prot, Trembl, KOG, Go, and Pfam. The results showed that 226,372 (44.8%), 286,755 (56.75%), 191,339 (37.86%), 283,896 (56.18%), 240,483 (47.59%), 163,286 (32.31%), and 197,740 (39.13%) of unigenes were annotated in KEGG, NR, Swiss-Prot, Trembl, KOG, Go, and Pfam database, respectively (Table 2).
Table 2.
Summary statistics of functional annotation of unigenes in developing roots of A. tataricus
| Database | Number of genes | Percentage (%) |
|---|---|---|
| KEGG | 226,372 | 44.8 |
| NR | 286,755 | 56.75 |
| SwissProt | 191,339 | 37.86 |
| Trembl | 283,896 | 56.18 |
| KOG | 174,830 | 34.6 |
| GO | 243,280 | 48.14 |
| Pfam | 197,740 | 39.13 |
| Annotated in at least one Database | 294,773 | 58.33 |
| Total Unigenes | 505,334 | 100 |
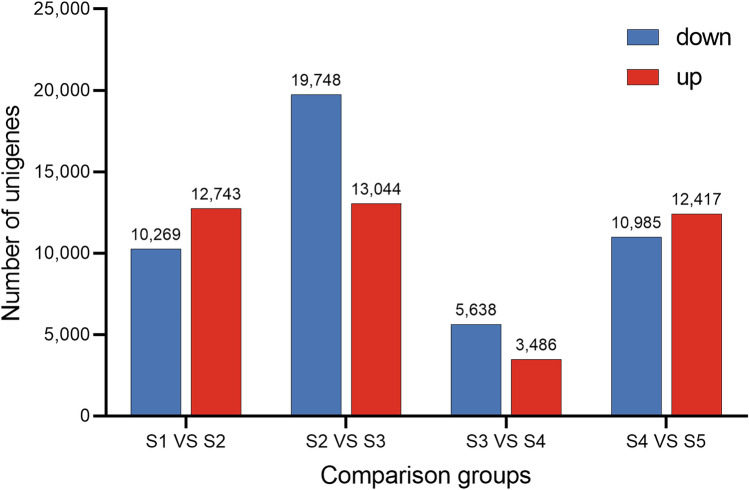
With the criteria of |Log2Fold Change |≥ 1 and FDR < 0.05 in the transcriptome of A. tataricus roots, 23,012 (12,743 up- and 10,269 down-regulation), 32,792 (13,044 up- and 19,748 down-regulated), 9,124 (3,486 up- and 5,638 down-regulated), and 23,402 (12,417 up- and 10,985 down-regulated) DEGs were identified in S1 vs S2, S2 vs S3, S3 vs S4, and S4 vs S5, respectively (Table S6 and Fig. 4).
Fig. 4.
Numbers of DEGs in different comparison groups. S1, S2, S3, S4, and S5 represent A. tataricus were harvested on the 15th of August, September, October, November and December, respectively
To understand the biological function of the DEGs, GO term enrichment was analyzed. 11,186 (S1 vs S2) and 16,452 (S2 vs S3) DEGs were divided into 58 functional groups, including 18 cellular component categories, 13 molecular function categories, and 27 biological process categories (Fig. 5a, b, Table S7). 4,669 DEGs in S3 vs S4 were divided into 56 functional groups, including 18 cellular component categories, 12 molecular function categories, and 26 biological process categories (Fig. 5c, Table S7). In S4 vs S5, 11,808 DEGs were divided into 18 cellular component categories, 11 molecular function categories, and 28 biological process categories, a total of 57 functional groups. (Fig. 5d, Table S7). In the category of cellular component, cell part, cell, and organelle were most prevalent. Within the molecular function category, the most common terms were catalytic activity, binding, and transporter activity. Among biological process category, metabolic processes, cellular processes, and response to stimulus were the greatest abundance terms.
Fig. 5.
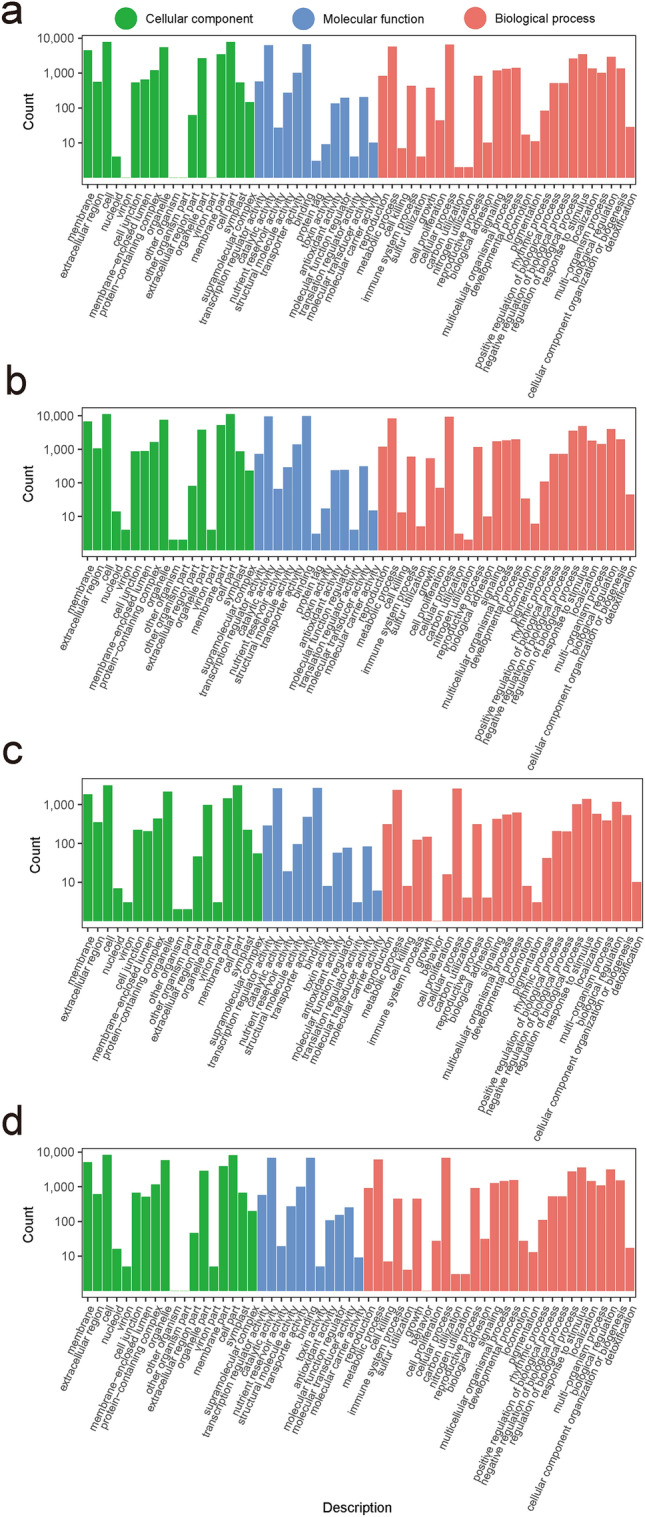
GO enrichment of DEGs identified in different comparison groups. a–d Represent the S1 vs S2, S2 vs S3, S3 vs S4, and S4 vs S5 comparison groups, respectively. S1, S2, S3, S4, and S5 represent A. tataricus were harvested on the 15th of August, September, October, November and December, respectively
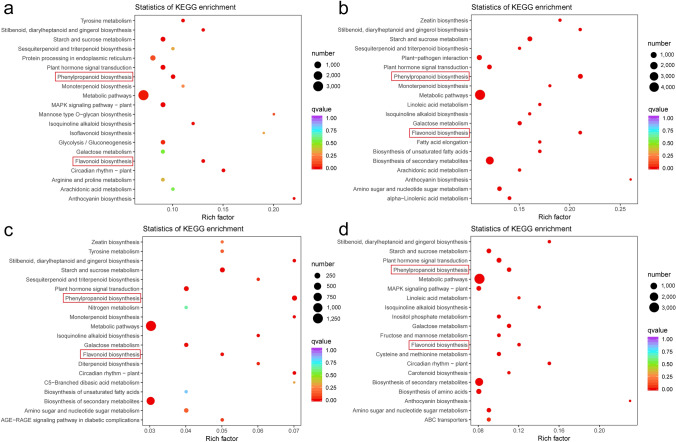
To further identify the metabolic pathways of the DEGs, they were annotated with KEGG. 7,187 (S1 vs S2), 9,930 (S2 vs S3), 2,278 (S3 vs S4), and 6,963 (S4 vs S5) DEGs were assigned to 143, 143, 141, and 141 KEGG pathways, respectively (Table S8). Among these, 32, 45, 27, and 39 pathways were significantly enriched with a p-value < 0.05, respectively (Table S9). Notably, phenylpropanoid biosynthesis (ko00940) and flavonoid biosynthesis (ko00941), which are involved in the flavonoid biosynthesis, were significantly enriched in both of the four comparison groups (Fig. 6, Table S9). In addition, the enrichment pathways of the four comparison groups (S1 vs S2, S2 vs S3, S3 vs S4, and S4 vs S5) could be further divided into six categories: metabolism, genetic information processing, cellular processes, environmental information processing, organismal systems, and human diseases. In the six categories, the metabolic category contained the most pathways in all four comparison groups.
Fig. 6.
Significantly enriched KEGG pathways (P < 0.05) from DEGs in different comparison groups. a–d Represent the S1 vs S2, S2 vs S3, S3 vs S4, and S4 vs S5 comparison groups, respectively. The enriched phenylpropanoid biosynthesis pathway and flavonoid biosynthesis pathway are labeled by the red frame. S1, S2, S3, S4, and S5 represent A. tataricus were harvested on the 15th of August, September, October, November and December, respectively
Combined transcriptome and metabolome analysis revealed the biosynthesis of flavonoid in the roots of A. tataricus
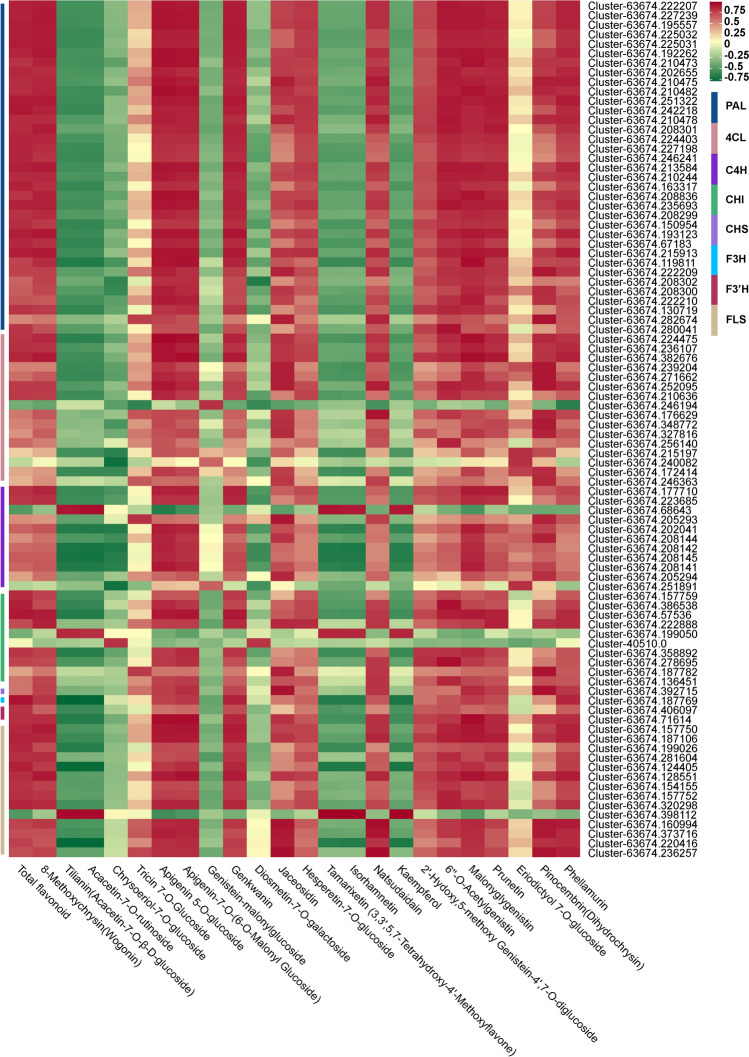
DEGs that encode enzymes related to flavonoid biosynthesis were screened out based on the richen KEGG pathways and gene functional annotation, among which 90 structural genes, including 35 PAL, 16 4CL, 11 C4H, 1 CHS, 10 CHI, 1 F3H, 2 F3′H, and 14 FLS, showed significant correlation either with total flavonoid content or 23 individual flavonoid (r > 0.8) (Fig. 7, Table S10). Kaempferol, a flavonoid, displays several pharmacological activities, such as anti-inflammatory, antioxidant, and antitumor (Imran et al. 2019). Ng et al. isolated kaempferol from A. tataricus, and studies have shown that it has outstanding antioxidant activity (Ng et al. 2003). Our correlation analysis showed that the expression levels of 1 C4H, 1 CHI, and 1 FLS gene were highly correlated with the kaempferol content, especially the FLS (Table S10). Therefore, we speculate that these three genes are the key genes regulating the synthesis of kaempferol in the roots of A. tataricus.
Fig. 7.
Correlation coefficient heatmap of flavonoid biosynthesis related pathway genes and flavonoids in A. tataricus roots. Each row represents a gene and each column represents a flavonoid. Red indicates positive correlation, while negative correlation is shown in green. PAL phenylalanine ammonia-lyase, 4CL 4 coumarate CoA ligase, C4H cinnamate-4-hydroxylase, CHI chalcone isomerase, CHS chalcone synthase, F3H flavanone 3-hydroxylase, F3´H flavonoid 3´-hydroxylase, FLS flavonol synthase
TFs, such as AP2/ERF, bHLH, bZIP, MYB, NAC, and WRKY, have been reported to be involved in flavonoid synthesis (Nabavi et al. 2020; Hichri et al. 2011). DEGs that belonged to the above six classes of TFs were identified in our transcriptome data, and the correlation between the changes of total flavonoid content and the 6 TFs in the five different developmental stages of A. tataricus roots was further analyzed. As a result, 65 TFs, including 22 AP2/ERF, 7 bHLH, 5 bZIP, 8 MYB, 11 NAC, and 12 WRKY, showed significant correlation with total flavonoid content (r > 0.8) (Table S11). These TFs might contribute to flavonoid metabolites in the roots of A. tataricus.
Weighted gene co-expression network analysis to identify differential genes related to flavonoid synthesis
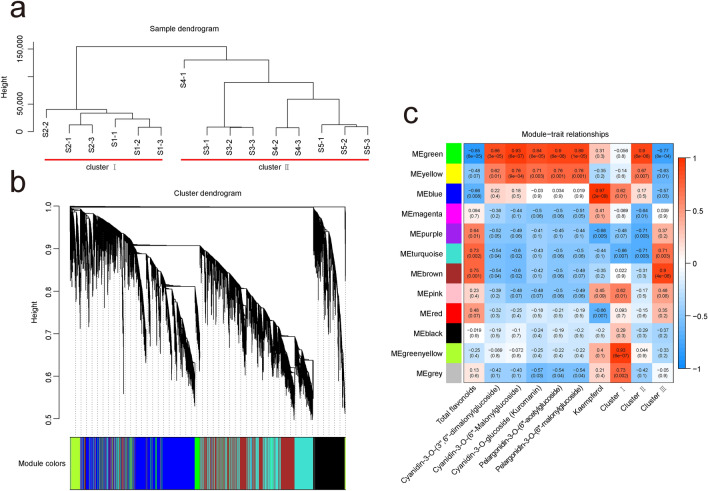
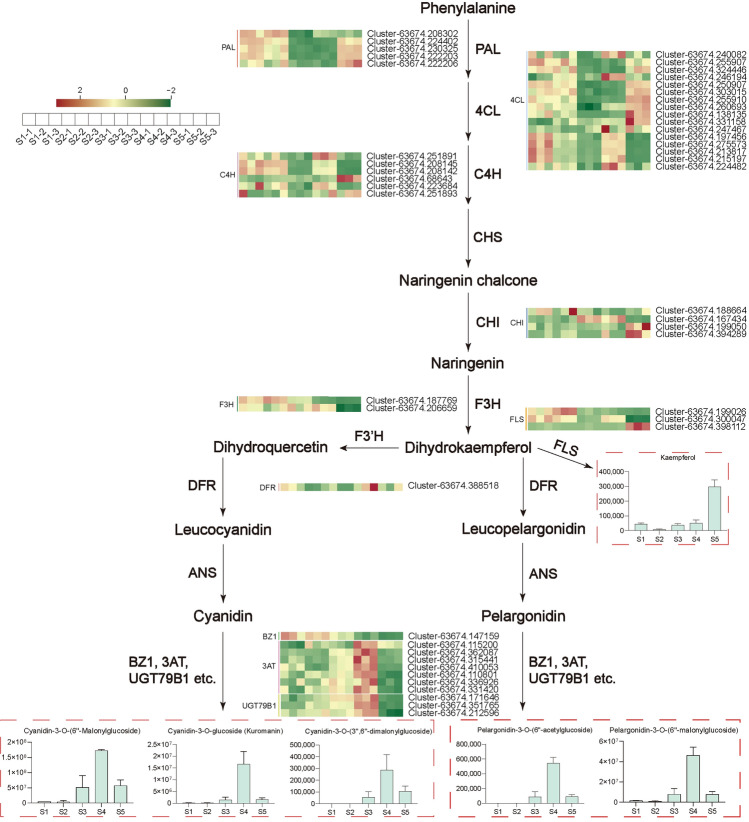
To get a comprehensive understanding of the relationship between A. tataricus root samples in 5 different developmental stages, samples were clustered based on fragments per kilobase of transcript per million fragments mapped (FPKM) of 83,398 DEGs. The cluster dendrogram showed that samples were divided into 2 main clusters with 3 subclusters (Fig. 8a). Cluster I included S1 and S2. S4 and S5 were grouped together and belong to cluster II along with S3. The results suggested that the gene expression levels during root development in A. tataricus changed greatly from S2 to S4, especially from S2 to S3. A weighted gene co-expression network analysis (WGCNA) was further performed to divide all EDGs into 12 distinct modules, labeled with different colors, in which genes in the same modules had high correlation coefficients (Fig. 8b). Furthermore, the total flavonoid content, kaempferol content, 5 anthocyanins contents, and the variation trends of 3 clusters (cluster I, cluster II, and cluster III) of flavonoid metabolites as traits data for the module–trait relationship analysis. Three modules, including brown, turquoise, and purple, had substantial positive link with total flavonoid content and cluster III. Green and yellow modules were significantly associated with 5 anthocyanins contents and cluster II. Blue, pink, and greenyellow modules were correlated with cluster I. Kaempferol content had highest correlation with blue module (Fig. 8c). As a result, these eight modules would be chosen as interesting modules for further investigation.
Fig. 8.
Identification of WGCNA modules. a Cluster dendrogram of 15 samples based on FPKM of 83,398 DEGs. b Hierarchical clustering tree. c Module–trait relationship analysis. The value inside each box represents Pearson’s correlation coefficient between the module with trait, and the number in each parentheses represents p-value. The color scale on the right represents the degree of correlation between modules and trait and the red represent high correlation
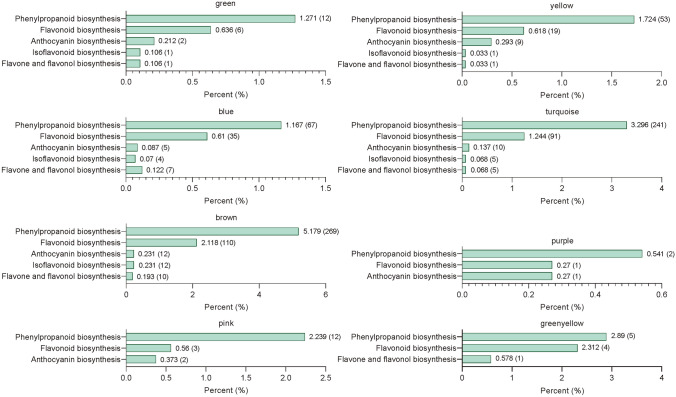
To further identify the metabolic pathways of the DEGs in these 8 modules, they were annotated with KEGG. The results showed that the DEGs in these 8 modules were all enriched in flavonoid biosynthesis–related pathways (Fig. 9). One hundred and twenty-seven genes, including 43 PAL, 23 4CL, 9 C4H, 4 CHS, 18 CHI, 2 F3H, 5 F3'H, 1 F3′5'H, 20 FLS, and 2 FSII, that related to flavonoid biosynthesis were selected from brown, turquoise, and purple modules (Table S12). They may be related to the biosynthesis of flavonoids in cluster III and the accumulation of total flavonoids. In green and yellow modules, 30 genes, including 5 PAL, 9 4CL, 1 C4H, 2 CHI, 1 F3H, 1 DFR, 7 3AT, 1 BZ1, and 3 UGT79B1, were screened (Table S12). These genes may be involved in the biosynthesis of flavonoids in cluster II (including 5 anthocyanins) (Fig. 10). There were 24 genes (10 4CL, 6 C4H, 2 CHI, 3 F3H, and 3 FLS) in blue, pink, and greenyellow modules that may promote the biosynthesis of flavonoids in cluster I (Table S12). The blue module contains 7 4CL, 5 C4H, 2 CHI, 1 F3H, and 3 FLS, which may be the key genes regulating the biosynthesis of kaempferol (Table S12, Fig. 10).
Fig. 9.
KEGG histograms of different gene modules enriched in flavonoid biosynthesis–related pathways. The number outside the right square brackets of the column represents the ratio of the number of genes annotated to the pathway to the number of annotated genes. The numbers in the right square brackets of the columns indicate the number of genes annotated to the pathway
Fig. 10.
Biosynthetic pathway of flavonoids during root development in A. tataricus. The histogram displays the levels of kaempferol and 5 anthocyanins (The histogram of flavonoids are expressed as relative content). Error bars represent ± standard deviation (n = 3). Heatmap showing the expression patterns of the candidate structural genes involved in the regulation of flavonoid compounds during the root development in A. tataricus. The expression of each gene is represented by a different color. Red indicates high content of metabolite, while low content metabolite is shown in green. PAL phenylalanine ammonia-lyase, C4H cinnamic acid 4-hydroxylase, 4CL 4 coumarate CoA ligase, CHI chalcone isomerase, F3H flavanone 3-hydroxylase, FLS flavonol synthase, DFR dihydroflavonol 4-reductase, BZ1 anthocyanidin 3-O-glucosyltransferase, 3AT anthocyanidin 3-O-glucoside 6´´-O-acyltransferase, UGT79B1 anthocyanidin 3-O-glucoside 2´´´-O-xylosyltransferase. S1, S2, S3, S4, and S5 represent A. tataricus were harvested on the 15th of August, September, October, November and December, respectively
Confirmation of DEGs relates to flavonoid biosynthesis using qRT-PCR
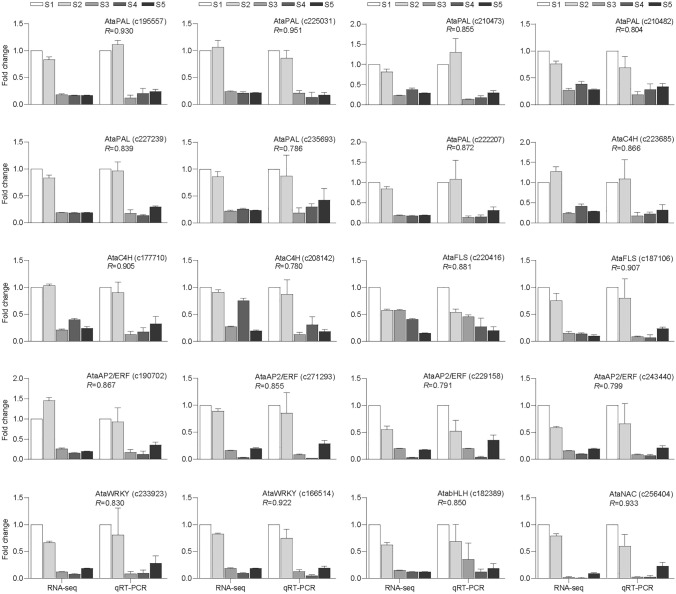
To confirm the credibility of the transcriptome information, we further selected 12 structural genes and 8 TFs to validate their expression by qRT-PCR. As shown in Fig. 11, expression level of all of the selected genes displayed high consistency with the RNA-seq data.
Fig. 11.
qRT-PCR verified the DEGs related to flavonoid biosynthesis DEGs during aster root development. Relative expression levels of qRT-PCR were calculated using actin as a standard. Pearson correlation coefficients were calculated by comparing qRT-PCR and RNA-seq data for each gene across all samples. Error bars represent ± standard deviation (n = 3). PAL phenylalanine ammonia-lyase, C4H cinnamate-4-hydroxylase, FLS flavonol synthase. S1, S2, S3, S4, and S5 represent A. tataricus were harvested on the 15th of August, September, October, November and December, respectively
Discussion
A. tataricus has been used as a traditional medicinal herb in China for more than 2,000 years due to its medicinal properties, such as anti-oxidation, anti-inflammatory, and anti-cancer, for humans (Du et al. 2017; Li et al. 2021b; Su et al. 2019; Wang et al. 2020). Li et al. reported that the anti-lung cancer function of A. tataricus is closely related to flavonoids such as quercetin, kaempferol, isorhamnetin, and luteolin (Li et al. 2021b). The (2R,2′′R)-7-O-methyl–2,3,2′′,3′′–tetrahydrorobustaflavone, a flavonoid isolated from A. tataricus, remarkably inhibited the proliferation of A549 cancer cells (Chen et al. 2022). However, research about the molecular mechanism of flavonoid biosynthesis in A. tataricus has not been reported. In our study, the total flavonoid content of five stages of A. tataricus roots was quantified, and an integrated transcriptomic and metabolite profile analysis was performed to understand the flavonoid biosynthesis in the developing roots of A. tataricus. Quantification of total flavonoids showed that it continued to decrease from S2 to S4. However, there was no significant difference in the total flavonoid content of S1–S2 and S4–S5 (Fig. 1b). It is obvious that the aerial parts of A. tataricus grow rapidly from S1 to S2. The growth of the aerial part of A. tataricus became slow after S2, and gradually began to dry up until S4 (Fig. 1a). These results indicated that the content of total flavonoid in the roots of A. tataricus changed with the growth period. As the plant grows and develops, the total content of flavonoid in the plants is not constant. Xie et al. reported that the content of total flavonoids in Dryopteris erythrosora varied in different seasons (Xie et al. 2015). Huang et al. reported that the content of total flavonoid in the roots of Abrus cantoniensis was the highest in October, and decreased after October (Huang et al. 2006). The content of total flavonoid in Tartary buckwheat seeds showed a pattern of first increasing and then decreasing (Li et al. 2019). In addition, the accumulation of secondary metabolites is also affected by temperature. Alhaithloul et al. reported that low temperature stress promoted the content of total flavonoid in tomato (Solanum lycopersicum) seedlings, while the content of total flavonoid decreased under high temperature stress (Alhaithloul et al. 2021). Under low temperature (4 ℃) or high temperature (40 ℃) stress, the content of total flavonoid in basil (Ocimum basilicum cv. 'Genovese') leaves was higher than that under normal temperature (25 ℃) (Jakovljević et al. 2021). In our study, the content of total flavonoid in A. tataricus roots of S4 (the average daily maximum temperature is about 11 °C) was lower than that of A. tataricus roots of S2 (the daily average maximum temperature is about 27 °C). We speculate that the decrease in total flavonoid content in A. tataricus roots may be caused by the stagnation of A. tataricus growth after S2 due to the decrease in temperature.
Through metabolite profiling analysis, a total of 80 flavonoids were identified in the roots of A. tataricus. All detected flavonoids had differential accumulation during A. tataricus root development (Table S2). Of these flavonoids, flavonols (31) and flavonoid (29) are the major flavonoid compounds (Fig. 1c, Table S2). Furthermore, 70% of these 80 flavonoids belong to glycosides (Table S3). The skeletons of most flavonoids in A. tataricus root were isorhamnetin, kaempferol, quecetin, and myricetin. It was reported that flavonoids such as isorhamnetin and kaempferol have the effects of cardiovascular and cerebrovascular protection, anti-tumor, anti-inflammatory, anti-oxidation, organ protection, and prevention of obesity (Gong et al. 2020; Imran et al. 2019). Liu et al. reported that isorhamnetin protected against liver fibrosis by reducing ECM formation and autophagy via inhibition of TGF–β1–mediated Smad3 and p38 MAPK signaling pathways (Liu et al. 2019). Liu et al. reported that kaempferol improves osteoporosis by downregulating miR-10a-3p and upregulating CXCL12 (Liu et al. 2021a). Quercetin might decrease the susceptibility of neutrophils to pro–inflammatory factors to achieve anti-inflammatory effects (Liu et al. 2005). So far, there are few studies on the types and accumulation patterns of flavonoids in A. tataricus roots. This study gives us a more comprehensive understanding of flavonoids in A. tataricus roots. Our study provides some guidance for future studies on the pharmacological effects of A. tataricus.
Anthocyanins are secondary metabolites in plants of the flavonoid family. They are responsible for the vigorous colors of various botanic organs and are also substantial dietary compounds (Qin et al. 2010; Rodriguez-Saona and Wrolstad 2001; Salamone et al. 2012). Pelargonidin and cyanidin derivatives are the important pigments in bright red fruits (Jaakola 2013). Shen et al. reported that glycosidic pelargonidin is absent in white F. nilgerrensis fruits compared to red fruits (Shen et al. 2020). Miyazawa et al. reported that cyanidin 3-O-glucoside confers a red hue to fruits (Miyazawa et al. 1999). In our data, two pelargonidin derivatives and three cyanidin derivatives were detected in the roots of A. tataricus. The contents of these five anthocyanins were highest and most of the A. tataricus roots were purple-red in the S4 stage, when the temperature was lower compared to previous developmental stages. It has been demonstrated that low temperature induces anthocyanin synthesis in various species (Chalker-Scott 1999; Choi et al. 2009). Therefore, we speculate that the accumulation of anthocyanins induced by low temperature caused the reddening of A. tataricus roots.
It is well known that the structural genes that encode enzymes are involved in the biosynthesis of flavonoids. In our study, based on KEGG enrichment analysis and gene functional annotation, 182 DEGs that encode enzymes associated with flavonoid biosynthesis, including PAL, 4CL, C4H, CHS, CHI, F3H, F3′H, F3′5′H, FLS, FSII, DFR, 3AT, BZ1, and UGT79B1, were identified by WGCNA and calculating Pearson correlation coefficients between genes and flavonoids. Of these DEGs, 129 DEGs (43 PAL, 23 4CL, 9 C4H, 4 CHS, 18 CHI, 3 F3H, 5 F3′H, 1 F3′5’H, 21 FLS, and 2 FSII) showed significant correlation with total flavonoid content. Gam et al. reported that the expression levels of CHI and FLS genes in Anoectochilus roxburghii are related to the total flavonoid content (Gam et al. 2020). Specific flavonoids biosynthesis is preceded by a general phenylalanine pathway involving PAL, C4H, and 4CL (Dong and Lin 2021). It is reported that PAL, C4H, and 4CL genes are related to the synthesis of flavonoids (Li et al 2015; Liu et al. 2006; Singh et al. 2009). Cheng et al. showed that PAL activity has linked to the concentration of anthocyanins in strawberry (Fragaria × ananassa) fruit (Cheng and Breen 1991). The p-coumaroyl–CoA produced in the general phenylalanine pathway is catalyzed by chalcone synthase (CHS) to generate chalcone. Through the catalysis of CHI, F3H, and FLS, chalcone generates dihydroflavone, dihydroflavonol, and flavonols sequentially (Liu et al. 2021b). CHI, the first reported enzyme involved in flavonoid biosynthetic pathway, is a key enzyme in flavonoid biosynthesis (McKhann et al. 1998). CHI over–expression could increase flavonol accumulation in Arabidopsis, and stimulate the accumulation of apigenin in Astragalus trigonus (Elatabi et al. 2021; Jiang et al. 2015). Flavonol synthase catalyzes the production of flavonols from dihydroflavonols, the flavonols is a subclass of the flavonoids. Overexpression of FLS gene in chrysanthemum morifolium can increase the content of flavanols in tobacco (Wang et al. 2021). The above studies showed that CHI and FLS genes can promote the accumulation of flavonols. Our study found 2 CHI and 10 FLS genes were highly associated with flavonols, such as kaempferol and isorhamnetin. These results indicated that these genes are the key genes involved in the regulation of flavonol synthesis in A. tataricus.
In addition to the structural genes, many classes of regulatory genes, such as AP2/ERF, MYB–bHLH–WD40 complexes, bZIP, MYB, NAC, and WRKY have been identified to play a role in flavonoid biosynthesis in higher plants (Morishita et al. 2009; Terrier et al. 2009; Wang et al. 2018; Xu et al. 2015; Zhang et al. 2022; Zhao et al. 2021). The AP2/ERF transcription factors modulate the accumulation of flavonoid by regulating CHI in citrus (Zhao et al. 2021). In apple (Malus pumila Mill.), bZIP44 promotes anthocyanin in response to ABA by enhancing the binding of MYB1 to the promoters of downstream target genes (An et al. 2018). Overexpression of the Arabidopsis NAC078 transcription factor results in a significant increase in the transcriptional levels of genes related to flavonoid biosynthesis and the levels of anthocyanins in Arabidopsis under high–light (Morishita et al. 2009). Potato (Solanum tuberosum) StWRKY13 can promote anthocyanin biosynthesis by activating the transcription of flavonoid biosynthesis–related genes such as StCHS, StF3H, and StDFR in potato tubers (Zhang et al. 2021). In our study, based on transcriptome data, we found that 65 important TFs including AP2/ERFs, bHLH, bZIP, MYB, NACs, and WRKY showed higher correlation values (r > 0.8) with total flavonoid content (Table S11). These differentially expressed TFs might be candidate regulators of flavonoid synthesis in A. tataricus roots.
In summary, the total flavonoid content was different in roots of A. tataricus at different developmental stages. Based on metabolome and transcriptome data, we revealed the flavonoid biosynthesis metabolic pathway in A. tataricus root. A total of 83,398 DEGs and 80 flavonoid metabolites were identified with differential accumulation during A. tataricus root development. The skeletons of most flavonoids in A. tataricus roots were isorhamnetin, kaempferol, quecetin, and myricetin. Classification of 80 flavonoids into three subgroups with different accumulation patterns base on a K-means clustering algorithm. The genes involved in flavonoid biosynthesis were identified by combined analysis of transcriptome and metabolome data of the roots of A. tataricus. Our results provide valuable information on understanding flavonoid compositions and accumulation patterns and the candidate genes involved in the flavonoid biosynthesis pathways in A. tataricus.
Supplementary Information
Below is the link to the electronic supplementary material.
Acknowledgements
We thank Metware company for transcriptome and metabolome detection.
Author contributions
KJ, XZ, LL and SG conceived and designed the research. YM and SL prepared the experimental materials. XL, TY, and CW performed some experiments. KJ and XZ analyzed the data and wrote the manuscript. SG provided intellectual input and revised the manuscript. All authors read and approved the final manuscript.
Funding
This work was supported by the Key Research and Development Project of Hebei Province: Scientific and Technological Innovation Team of Modern Seed Industry of Traditional Chinese Medicine (21326312D), Hebei Chinese medicine industry Technical system (HBCT2018060201), and China Agriculture Research System of MOF and MARA (CARS-21).
Availability of data and materials
The whole set of raw data can be found in the national center for biotechnology information (NCBI) SRA database (accession number PRJNA874188).
Declarations
Conflict of interest
The authors declare that they have no conflict of interest.
Ethics approval and consent to participate
Not applicable.
Consent for publication
Not applicable.
Footnotes
Publisher's Note
Springer Nature remains neutral with regard to jurisdictional claims in published maps and institutional affiliations.
Kaixuan Jia, Xiaoling Zhang have contributed equally to this work.
Contributor Information
Lingdi Liu, Email: nkyliulingdi@126.com.
Shujun Ge, Email: gshj@hebau.edu.cn.
References
- Alhaithloul HSA, Galal FH, Seufi AM. Effect of extreme temperature changes on phenolic, flavonoid contents and antioxidant activity of tomato seedlings (Solanum lycopersicum L.) PeerJ. 2021;9:e11193. doi: 10.7717/peerj.11193. [DOI] [PMC free article] [PubMed] [Google Scholar]
- An JP, Yao JF, Xu RR, You CX, Wang XF, Hao YJ. Apple bZIP transcription factor MdbZIP44 regulates abscisic acid-promoted anthocyanin accumulation. Plant Cell Environ. 2018;41:2678–2692. doi: 10.1111/pce.13393. [DOI] [PubMed] [Google Scholar]
- Chalker-Scott L. Environmental significance of anthocyanins in plant stress responses. Photochem Photobiol. 1999;70:1–9. doi: 10.1111/j.1751-1097.1999.tb01944.x. [DOI] [Google Scholar]
- Chen W, Gong L, Guo Z, Wang W, Zhang H, Liu X, et al. A novel integrated method for large-scale detection, identification, and quantification of widely targeted metabolites: application in the study of rice metabolomics. Mol Plant. 2013;6:1769–1780. doi: 10.1093/mp/sst080. [DOI] [PubMed] [Google Scholar]
- Chen YJ, Wu H, Wei ZY, Chen LM, Dong JJ, Liu J, et al. Identification of chemical constituents in Aster tataricus by UHPLC-Q-TOF-MS. Acta Pharm Sin. 2019;54:1645–1654. doi: 10.16438/j.0513-4870.2019-0214. [DOI] [Google Scholar]
- Chen Y, Wu H, Li Y, Liu J, Jia Z, Xu W, et al. Aster tataricus attenuates asthma efficiently by simultaneously inhibiting tracheal ring contraction and inflammation. Biomed Pharmacother. 2020;130:110616. doi: 10.1016/j.biopha.2020.110616. [DOI] [PubMed] [Google Scholar]
- Chen Z, Zhang H, Wang L, Cai Q, Li J, Cao H. Three cases of coronavirus disease 2019 (COVID-19) report. J Tradit Chin Med. 2020;61:745–748. doi: 10.13288/j.11-2166/r.2020.09.003. [DOI] [Google Scholar]
- Chen T, Yang P, Chen HJ, Huang B. A new biflavonoids from Aster tataricus induced non–apoptotic cell death in A549 cells. Nat Prod Res. 2022;36:1409–1415. doi: 10.1080/14786419.2021.1882456. [DOI] [PubMed] [Google Scholar]
- Cheng GW, Breen PJ. Activity of phenylalanine ammonia-lyase (PAL) and concentrations of anthocyanins and phenolics in developing strawberry fruit. J Am Soc Hortic Sci. 1991;116:865–869. doi: 10.21273/JASHS.116.5.865. [DOI] [Google Scholar]
- Cheng D, Shao Y. Terpenoid glycosides from the roots of Aster tataricus. Phytochemistry. 1993;35:173–176. doi: 10.1016/S0031-9422(00)90528-4. [DOI] [PubMed] [Google Scholar]
- Choi S, Kwon YR, Hossain MA, Hong SW, Lee B, Lee H. A mutation in ELA1, an age–dependent negative regulator of PAP1/MYB75, causes UV–and cold stress–tolerance in Arabidopsis thaliana seedlings. Plant Sci. 2009;176:678–686. doi: 10.1016/j.plantsci.2009.02.010. [DOI] [Google Scholar]
- Dong NQ, Lin HX. Contribution of phenylpropanoid metabolism to plant development and plant–environment interactions. J Integr Plant Biol. 2021;63:80–209. doi: 10.1111/jipb.13054. [DOI] [PubMed] [Google Scholar]
- Dong X, Chen W, Wang W, Zhang H, Liu X, Luo J. Comprehensive profiling and natural variation of flavonoids in rice. J Integr Plant Biol. 2014;56:76–886. doi: 10.1111/jipb.12204. [DOI] [PubMed] [Google Scholar]
- Dong T, Han R, Yu J, Zhu M, Zhang Y, Gong Y, et al. Anthocyanins accumulation and molecular analysis of correlated genes by metabolome and transcriptome in green and purple asparaguses (Asparagus officinalis, L.) Food Chem. 2019;271:8–28. doi: 10.1016/j.foodchem.2018.07.120. [DOI] [PubMed] [Google Scholar]
- Du H, hang M, Yao K, Hu Z, Protective effect of Aster tataricus extract on retinal damage on the virtue of its antioxidant and anti-inflammatory effect in diabetic rat. Biomed Pharmacother. 2017;89:617–622. doi: 10.1016/j.biopha.2017.01.179. [DOI] [PubMed] [Google Scholar]
- Elarabi NI, Abdelhadi AA, Sief-Eldein AG, Ismail IA, Abdallah NA. Overexpression of chalcone isomerase A gene in Astragalus trigonus for stimulating apigenin. Sci Rep. 2021;11:1–9. doi: 10.1038/s41598-021-03704-y. [DOI] [PMC free article] [PubMed] [Google Scholar]
- Gam DT, Khoi PH, Ngoc PB, Linh LK, Hung NK, Anh PTL, et al. LED lights promote growth and flavonoid accumulation of Anoectochilus roxburghii and are linked to the enhanced expression of several related genes. Plants. 2020;9:1344. doi: 10.3390/plants9101344. [DOI] [PMC free article] [PubMed] [Google Scholar]
- Gene Ontology Consortium Gene ontology consortium: going forward. Nucleic Acids Res. 2015;43:D1049–D1056. doi: 10.1093/nar/gku1179. [DOI] [PMC free article] [PubMed] [Google Scholar]
- Ghazalpour A, Doss S, Zhang B, Wang S, Plaisier C, Castellanos R, et al. Integrating genetic and network analysis to characterize genes related to mouse weight. PLoS Genet. 2006;8:e130. doi: 10.1371/journal.pgen.0020130. [DOI] [PMC free article] [PubMed] [Google Scholar]
- Gong G, Guan YY, Zhang ZL, Rahman K, Wang SJ, Zhou S, et al. Isorhamnetin: A review of pharmacological effects. Biomed Pharmacother. 2020;128:110301. doi: 10.1016/j.biopha.2020.110301. [DOI] [PubMed] [Google Scholar]
- Hichri I, Barrieu F, Bogs J, Kappel C, Delrot S, Lauvergeat V. Recent advances in the transcriptional regulation of the flavonoid biosynthetic pathway. J Exp Bot. 2011;62:2465–2483. doi: 10.1093/jxb/erq442. [DOI] [PubMed] [Google Scholar]
- Hossain MA, Rahman SM. Total phenolics, flavonoids and antioxidant activity of tropical fruit pineapple. Food Res Int. 2011;44:672–676. doi: 10.1016/j.foodres.2010.11.036. [DOI] [Google Scholar]
- Huang R, Yu Y, Hu Y, Sheng X. Determination of total flavonoids in Abrus cantoniensis and its dynamic changes. Zhongguo Zhongyao Zazhi. 2006;17:1428–1431. doi: 10.3321/j.issn:1001-5302.2006.17.009. [DOI] [PubMed] [Google Scholar]
- Imran M, Salehi B, Sharifi-Rad J, Aslam Gondal T, Saeed F, Imran A, et al. Kaempferol: A key emphasis to its anticancer potential. Molecules. 2019;24:2277. doi: 10.3390/molecules24122277. [DOI] [PMC free article] [PubMed] [Google Scholar]
- Jaakola L. New insights into the regulation of anthocyanin biosynthesis in fruits. Trends Plant Sci. 2013;18:477–483. doi: 10.1016/j.tplants.2013.06.003. [DOI] [PubMed] [Google Scholar]
- Jakovljević D, Momčilović J, Bojović B, Stanković M. The short–term metabolic modulation of basil (Ocimum basilicum L. cv. ‘Genovese’) after exposure to cold or heat. Plants (basel) 2021;10:590. doi: 10.3390/plants10030590. [DOI] [PMC free article] [PubMed] [Google Scholar]
- Jiang W, Yin Q, Wu R, Zheng G, Liu J, Dixon RA, et al. Role of a chalcone isomerase–like protein in flavonoid biosynthesis in Arabidopsis thaliana. J Exp Bot. 2015;66:7165–7179. doi: 10.1093/jxb/erv413. [DOI] [PMC free article] [PubMed] [Google Scholar]
- Kanehisa M, Sato Y, Kawashima M, Furumichi M, Tanabe M. KEGG as a reference resource for gene and protein annotation. Nucleic Acids Res. 2016;44:D457–D462. doi: 10.1093/nar/gkv1070. [DOI] [PMC free article] [PubMed] [Google Scholar]
- Li Y, Kim JI, Pysh L, Chapple C. Four isoforms of Arabidopsis 4-coumarate: CoA ligase have overlapping yet distinct roles in phenylpropanoid metabolism. Plant Physiol. 2015;169:2409–2421. doi: 10.1104/pp.15.00838. [DOI] [PMC free article] [PubMed] [Google Scholar]
- Li H, Lv Q, Ma C, Qu J, Cai F, Deng J, et al. Metabolite profiling and transcriptome analyses provide insights into the flavonoid biosynthesis in the developing seed of tartary buckwheat (Fagopyrum tataricum) J Agric Food Chem. 2019;67:11262–11276. doi: 10.1021/acs.jafc.9b03135. [DOI] [PubMed] [Google Scholar]
- Li BZ, Fan RN, Sun GL, Sun T, Fan YT, Bai SL, et al. Flavonoids improve drought tolerance of maize seedlings by regulating the homeostasis of reactive oxygen species. Plant Soil. 2021;461:389–405. doi: 10.1007/s11104-020-04814-8. [DOI] [Google Scholar]
- Li MZ, Yang Z, Wu Q, Sun DX, Chen G, Tang DX. Investigation of anti-lung cancer mechanism of herbal pair of semen Lepidii seu Descurainias and Radix Asteris base on network pharmacology. J Oncol Chin Med. 2021;3:13–20+7. doi: 10.19811/j.cnki.ISSN2096-6628.2021.01.003. [DOI] [Google Scholar]
- Liu JJ, Song CW, Yue Y, Duan CG, Yang J, He T, et al. Quercetin inhibits LPS–induced delay in spontaneous apoptosis and activation of neutrophils. Inflamm Res. 2005;54:500–507. doi: 10.1007/s00011-005-1385-2. [DOI] [PubMed] [Google Scholar]
- Liu R, Xu S, Li J, Hu Y, Lin Z. Expression profile of a PAL gene from Astragalus membranaceus var. Mongholicus and its crucial role in flux into flavonoid biosynthesis. Plant Cell Rep. 2006;25:705–710. doi: 10.1007/s00299-005-0072-7. [DOI] [PubMed] [Google Scholar]
- Liu N, Feng J, Lu X, Yao Z, Liu Q, Lv Y, et al. Isorhamnetin inhibits liver fibrosis by reducing autophagy and inhibiting extracellular matrix formation via the TGF–β1/Smad3 and TGF–β1/p38 MAPK pathways. Mediators Inflamm. 2019 doi: 10.1155/2019/6175091. [DOI] [PMC free article] [PubMed] [Google Scholar]
- Liu H, Yi X, Tu S, Cheng C, Luo J. Kaempferol promotes BMSC osteogenic differentiation and improves osteoporosis by downregulating miR-10a-3p and upregulating CXCL12. Mol Cell Endocrinol. 2021;520:111074. doi: 10.1016/j.mce.2020.111074. [DOI] [PubMed] [Google Scholar]
- Liu W, Feng Y, Yu S, Fan Z, Li X, Li J, et al. The flavonoid biosynthesis network in plants. Int J Mol Sci. 2021;22:12824. doi: 10.3390/ijms222312824. [DOI] [PMC free article] [PubMed] [Google Scholar]
- Love MI, Huber W, Anders S. Moderated estimation of fold change and dispersion for RNA-seq data with DESeq2. Genome Biol. 2014;15:1–21. doi: 10.1186/s13059-014-0550-8. [DOI] [PMC free article] [PubMed] [Google Scholar]
- McKhann HI, Paiva NL, Dixon RA, Hirsch AM. Expression of genes for enzymes of the flavonoid biosynthetic pathway in the early stages of the Rhizobium–legume symbiosis. Adv Exp Med Biol. 1998;439:45–54. doi: 10.1007/978-1-4615-5335-9_4. [DOI] [PubMed] [Google Scholar]
- Miyazawa T, Nakagawa K, Kudo M, Muraishi K, Someya K. Direct intestinal absorption of red fruit anthocyanins, cyanidin-3-glucoside and cyanidin–3,5–diglucoside, into rats and humans. J Agric Food Chem. 1999;47:1083–1091. doi: 10.1021/jf9809582. [DOI] [PubMed] [Google Scholar]
- Morishita T, Kojima Y, Maruta T, Nishizawa-Yokoi A, Yabuta Y, Shigeoka S. Arabidopsis NAC transcription factor, ANAC078, regulates flavonoid biosynthesis under high–light. Plant Cell Physiol. 2009;50:2210–2222. doi: 10.1093/pcp/pcp159. [DOI] [PubMed] [Google Scholar]
- Nabavi SM, Šamec D, Tomczyk M, Milella L, Russo D, Habtemariam S, et al. Flavonoid biosynthetic pathways in plants: Versatile targets for metabolic engineering. Biotechnol Adv. 2020;38:107316. doi: 10.1016/j.biotechadv.2018.11.005. [DOI] [PubMed] [Google Scholar]
- Nakatsuka T, Abe Y, Kakizaki Y, Yamamura S, Nishihara M. Production of red–flowered plants by genetic engineering of multiple flavonoid biosynthetic genes. Plant Cell Rep. 2007;26:1951–1959. doi: 10.1007/s00299-007-0401-0. [DOI] [PubMed] [Google Scholar]
- Ng TB, Liu F, Lu Y, Cheng CHK, Wang Z. Antioxidant activity of compounds from the medicinal herb Aster tataricus. Comp Biochem Physiol Part C Toxicol Pharmacol. 2003;136:109–115. doi: 10.1016/s1532-0456(03)00170-4. [DOI] [PubMed] [Google Scholar]
- Olivas-Aguirre FJ, Rodrigo-García J, Martínez-Ruiz ND, Cárdenas-Robles AI, Mendoza-Díaz SO, Álvarez-Parrilla E, et al. Cyanidin-3-O-glucoside: physical-chemistry, foodomics and health effects. Molecules. 2016;21:1264. doi: 10.3390/molecules21091264. [DOI] [PMC free article] [PubMed] [Google Scholar]
- Qin C, Li Y, Niu W, Ding Y, Zhang R, Shang X. Analysis and characterisation of anthocyanins in mulberry fruit. Czech J Food Sci. 2010;28:117–126. doi: 10.17221/228/2008-cjfs. [DOI] [Google Scholar]
- Quiroz A, Mendez L, Mutis A, Hormazabal E, Ortega F, Birkett MA, Parra L. Antifeedant activity of red clover root isoflavonoids on Hylastinus obscurus. J Soil Sci Plant Nutr. 2017;17:231–239. doi: 10.4067/S0718-95162017005000018. [DOI] [Google Scholar]
- Ren W, Ma Y, Wang R, Liang P, Sun Q, Pu Q, et al. Research advance on Qingfei Paidu Decoction in prescription principle, mechanism analysis and clinical application. Front Pharmacol. 2021;11:589714. doi: 10.3389/fphar.2020.589714. [DOI] [PMC free article] [PubMed] [Google Scholar]
- Rodriguez-Saona LE, Wrolstad RE. Extraction, isolation, and purification of anthocyanins. Curr Protoc Food Anal Chem. 2001;1:F.1.1.1–F1.1.11. doi: 10.1002/0471142913.faf0101s00. [DOI] [Google Scholar]
- Salamone F, Li Volti G, Titta L, Puzzo L, Barbagallo L, La Delia F, et al. Moro orange juice prevents fatty liver in mice. World J Gastroenterol. 2012;18:3862–3868. doi: 10.3748/wjg.v18.i29.3862. [DOI] [PMC free article] [PubMed] [Google Scholar]
- Schmittgen TD, Livak KJ. Analyzing real-time PCR data by the comparative CT method. Nat Protoc. 2008;3:1101–1108. doi: 10.1038/nprot.2008.73. [DOI] [PubMed] [Google Scholar]
- Shen JC, Shao WL, Du ZJ, lu HF, Li JM. Integrated metabolomic and transcriptomic analyses reveal differences in the biosynthetic pathway of anthocyanins in Fragaria nilgerrensis and Fragaria pentaphylla. Sci Hortic. 2020;271:109476. doi: 10.1016/j.scienta.2020.109476. [DOI] [Google Scholar]
- Singh K, Kumar S, Rani A, Gulati A, Ahuja PS. Phenylalanine ammonia-lyase (PAL) and cinnamate 4-hydroxylase (C4H) and catechins (flavan-3-ols) accumulation in tea. Funct Integr Genom. 2009;9:125–134. doi: 10.1007/s10142-008-0092-9. [DOI] [PubMed] [Google Scholar]
- Su XD, Jang HJ, Li HX, Kim YH, Yang SY. Identification of potential inflammatory inhibitors from Aster tataricus. Bioorg Chem. 2019;92:103208. doi: 10.1016/j.bioorg.2019.103208. [DOI] [PubMed] [Google Scholar]
- Sun Y, Li L, Liao M, Su M, Wan C, Zhang L, et al. A systematic data acquisition and mining strategy for chemical profiling of Aster tataricus rhizoma (Ziwan) by UHPLC-Q-TOF-MS and the corresponding anti-depressive activity screening. J Pharm Biomed Anal. 2018;154:216–226. doi: 10.1016/j.jpba.2018.03.022. [DOI] [PubMed] [Google Scholar]
- Terrier N, Torregrosa L, Ageorges A, Vialet S, Verries C, Cheynier V, et al. Ectopic expression of VvMybPA2 promotes proanthocyanidin biosynthesis in grapevine and suggests additional targets in the pathway. Plant Physiol. 2009;149:1028–1041. doi: 10.1104/pp.108.131862. [DOI] [PMC free article] [PubMed] [Google Scholar]
- Treutter D. Significance of flavonoids in plant resistance and enhancement of their biosynthesis. Plant Biol. 2005;7:581–591. doi: 10.1055/s-2005-873009. [DOI] [PubMed] [Google Scholar]
- Varet H, Brillet-Guéguen L, Coppée JY, Dillies MA. SARTools: a DESeq2–and EdgeR–based R pipeline for comprehensive differential analysis of RNA-Seq data. PLoS One. 2016;11:e0157022. doi: 10.1371/journal.pone.0157022. [DOI] [PMC free article] [PubMed] [Google Scholar]
- Wang N, Liu W, Zhang T, Jiang S, Xu H, Wang Y, et al. Transcriptomic analysis of red–fleshed apples reveals the novel role of MdWRKY11 in flavonoid and anthocyanin biosynthesis. J Agric Food Chem. 2018;66:7076–7086. doi: 10.1021/acs.jafc.8b01273. [DOI] [PubMed] [Google Scholar]
- Wang X, Fan L, Yin H, Zhou Y, Tang X, Fei X, et al. Protective effect of Aster tataricus extract on NLRP3-mediated pyroptosis of bladder urothelial cells. J Cell Mol Med. 2020;24:13336–13345. doi: 10.1111/jcmm.15952. [DOI] [PMC free article] [PubMed] [Google Scholar]
- Wang Y, Zhou LJ, Wang Y, Liu S, Geng Z, Song A, et al. Functional identification of a flavone synthase and a flavonol synthase genes affecting flower color formation in Chrysanthemum morifolium. Plant Physiol Biochem. 2021;166:1109–1120. doi: 10.1016/j.plaphy.2021.07.019. [DOI] [PubMed] [Google Scholar]
- Wen K, Fang X, Yang J, Yao Y, Nandakumar KS, Salem ML, et al. Recent research on flavonoids and their biomedical applications. Curr Med Chem. 2021;28:1042–1066. doi: 10.2174/0929867327666200713184138. [DOI] [PubMed] [Google Scholar]
- Xie Y, Zheng Y, Dai X, Wang Q, Cao J, Xiao J. Seasonal dynamics of total flavonoid contents and antioxidant activity of Dryopteris erythrosora. Food Chem. 2015;186:113–118. doi: 10.1016/j.foodchem.2014.05.024. [DOI] [PubMed] [Google Scholar]
- Xu W, Dubos C, Lepiniec L. Transcriptional control of flavonoid biosynthesis by MYB–bHLH–WDR complexes. Trends Plant Sci. 2015;20:176–185. doi: 10.1016/j.tplants.2014.12.001. [DOI] [PubMed] [Google Scholar]
- Yu P, Cheng S, Xiang J, Yu B, Zhang M, Zhang C, et al. Expectorant, antitussive, anti-inflammatory activities and compositional analysis of Aster tataricus. J Ethnopharmacol. 2015;164:328–333. doi: 10.1016/j.jep.2015.02.036. [DOI] [PubMed] [Google Scholar]
- Zhang H, Zhang Z, Zhao Y, Guo D, Zhao X, Gao W, et al. StWRKY13 promotes anthocyanin biosynthesis in potato (Solanum tuberosum) tubers. Funct Plant Biol. 2021;49:102–114. doi: 10.1071/FP21109. [DOI] [PubMed] [Google Scholar]
- Zhang F, Huang J, Guo H, Yang C, Li Y, Shen S, et al. OsRLCK160 contributes to flavonoid accumulation and UV-B tolerance by regulating OsbZIP48 in rice. Sci China Life Sci. 2022 doi: 10.1007/s11427-021-2036-5. [DOI] [PubMed] [Google Scholar]
- Zhao DX, Hu BQ, Zhang M, Zhang CF, Xu XH. Simultaneous separation and determination of phenolic acids, pentapeptides, and triterpenoid saponins in the root of Aster tataricus by high-performance liquid chromatography coupled with electrospray ionization quadrupole time-of-flight mass spectrometry. J Sep Sci. 2015;38:571–575. doi: 10.1002/jssc.201401008. [DOI] [PubMed] [Google Scholar]
- Zhao C, Liu X, Gong Q, Cao J, Shen W, Yin X, et al. Three AP2/ERF family members modulate flavonoid synthesis by regulating type IV chalcone isomerase in citrus. Plant Biotechnol J. 2021;19:671–688. doi: 10.1111/pbi.13494. [DOI] [PMC free article] [PubMed] [Google Scholar]
Associated Data
This section collects any data citations, data availability statements, or supplementary materials included in this article.
Supplementary Materials
Data Availability Statement
The whole set of raw data can be found in the national center for biotechnology information (NCBI) SRA database (accession number PRJNA874188).


