Abstract
In this article, we describe the serendipitous synthesis of two remarkable iso-structural Cd(ii)–Salen complexes [L2Cd4(OAc)2(NCS)2] in the presence of H2L and NaSCN {where L = L1 (N,N′-bis(3-methoxysalicylidene)-1,2-diaminopropane) and L = L2 (N,N′-bis(3-methoxysalicylidene)-ethylenediamine) in 1 and 2, respectively}. The complexes were characterized by using elemental analysis, SEM-EDX, PXRD, spectroscopy, and X-ray crystallography. The X-ray crystal structure revealed that both complexes crystallize in the orthorhombic space group Pbcn, with unit cell parameters: a = 20.758(6), b = 11.022(3), c = 21.396(6) Å, V = 4895(2) Å3, and Z = 4. The inner N2O2 and outer O4 compartments are essentially occupied by two different Cd(ii) metal ions resulting from the de-protonated form of the ligand (L2−) with the Cd(1) metal ions adopting a capped octahedral geometry. At the same time, Cd(2) assumes a distorted trigonal prismatic geometry. The solid-state crystal structure involves various non-covalent supramolecular interactions delineated by Hirshfeld Surface and 2D fingerprint plot analysis. Noteworthily, interesting S⋯H, O⋯H, and N⋯H contacts were observed, which have identical percentages in both complexes. The sparse tetrel bonding interactions in the complex, involving the CH3 group, were evaluated in a new dimension of DFT. We observed this privileged bonding landscape that leads to the formation of self-assembled dimers in the crystal complexes. DFT-based MEP, RDG surface, NBO, and QTAIM/NCI plot investigation quantified such unique tetrel bonding interactions.
Two preeminent iso-structural Cd(ii)–Salen complexes were synthesized and structurally characterized. The unique tetrel bonding interactions involving the CH3 group have been reported in a reassessed dimension of the DFT.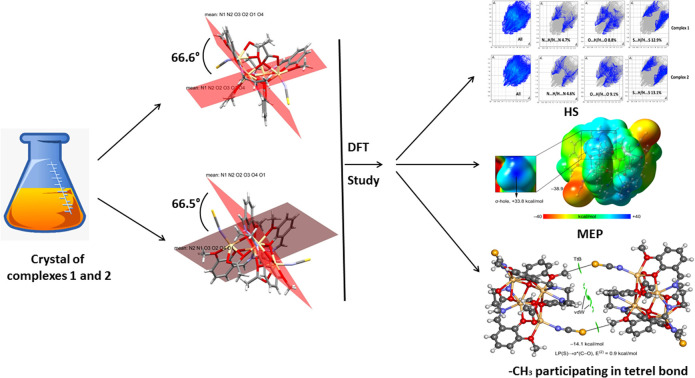
Introduction
The synthesis of Salen coordination complexes/polymers (CPs) has become a prominent research area in coordination chemistry in recent decades.1 Coordination polymers, specifically organometallic coordination networks, are formed based on metal–ligand bonds. Here, the extension is infinite into different dimensions through the metal–ligand bonds.2–4 The indispensable goal of coordination complex formation in crystal engineering is to find exciting properties and unique privileged bonding features that require a reasonable choice of ligands and metal precursors.5–8 The combined effect of Mn+ and spacers like SCN−, DCA, N3−, and OCN− eventually creates the supramolecular architecture of the CP.9,10 The dominant Salen ligands must contain bridging sites in at least one extended dimension, so this ligand can only bridge the metal atoms. Consequently, SCN− ligand-derived CPs with intriguing architectural frameworks have recently attracted much attention in coordination chemistry (Scheme S1A and B†).11–22 The attraction is due to the diverse bonding functionalities in their X-ray crystal structures. In this way, the fruitful synthesis of CPs using compartmentalized N2O4 scaffolds stands out due to its convenient synthesis, product stability, and versatility.23–26 At present, crystal engineering researchers are struggling to find non-covalent interactions in the synthesized CPs.27,28 More attention is being paid to the halogen, chalcogen, pnictogen, and tetrel-type bonds.29 Tetrel bonding interactions can be observed using an experimental 13C NMR spectral study.29 A tetrel bond is a directional non-covalent interaction between a covalently bonded Group IV atom and a −ve site. The −ve site is the lone pair of electrons of a Lewis base, or it may be an anion. Furthermore, it is a positive electrostatic potential (σ-hole) region, which is energetically comparable to H-bonding and other σ-hole-like interactions. The literature reveals that preferential tetrel bonding formation is restricted to the Hemi-/Holo-directed feature of Pb(ii)–Salen complexes (Scheme S3†).12,13,15,16,18–22 Non-covalent interactions are conventionally discussed in terms of interatomic distances and angles.30,31 However, due to the pronounced and specific electrostatic element of such non-covalent bonds,32,33 a rapid examination of the electronic features of halogen, chalcogen, pnictogen, and tetrel bonds is required. Such analysis needs to focus on the characteristics of valence electron shells and related anisotropy of the electrostatic potential of interacting atoms. The published research evaluates the binding energy for molecules in the [Y4T⋯Ha]− complexes (T = C, Si, Ge, Sn, where T = tetrel atom, Ha = Cl, Br) and an explanation of the electron density characteristics of tetrel bonds is vividly explored.34–39 It is amusing that the carbon atom in the CH3 group is often noted as the owner of the σ-hole, and the oxygen atom can act as an electron-rich centre in the CH3⋯O tetrel bond.40,41 Therefore, the non-covalent interaction was referred to as a carbon bond. Pal et al.42 described the CH3⋯N tetrel bonding in a Co(ii)–CP system. The high-precision X-ray diffraction method has also enabled observation of typical tetrel bonds formed by the CH3 group.43–45 However, it is unclear whether the carbon atom in a CH3 group or an aliphatic chain (sp3 hybridized) shows such behaviour. Mani et al. suggested that the carbon atom might function as an electrophilic centre. It can non-covalently associate with nucleophilic atoms, resulting in carbon bonding.45 Their work is essentially based on AIM studies.45 Therefore, a carbon-bonding interaction and the experimental validation of its existence may be significant, given its far-reaching implications for supramolecular chemistry. Additionally, evidence for non-covalent carbon–oxygen/carbon interactions in carbon monoxide complexes with haloalkanes has recently been reported.46 They are referred to as carbon/dicarbon bonds. Recently, carbon bonding interactions have been explored in the literature.47,48 Experimental work confirming these theoretical predictions is scarce in the literature, but solid-state NMR spectroscopy has provided evidence of carbon-bonding interactions in sarcosine salts.45
In this context, we synthesized and structurally characterized two remarkable iso-structural Cd(ii)–Salen complexes. We emphasize the research in this manuscript on the existence of non-covalent carbon bonding interactions in 1. To the best of our knowledge, we can confirm for the first time that the tetrel bonding interactions with carbon result from OCH3 groups in the Salen complexes. The tetrel bonding is studied using DFT-based MEP, NCI plot, RDG surface, and NBO analysis.
Experimental section
Materials and measurements
Most of the research chemicals and solvents used in the current research works were reagents graded and used without further purification. The substances such as Cd(OAc)2·2H2O, DCM (dichloromethane), NaSCN, Ortho vanillin, salicylaldehyde, 1,2-propanediamine, and ethylenediamine were purchased from the Sigma-Aldrich Company, USA. Elemental (CHN) compositions were analyzed using a PerkinElmer 2400 CHN elemental analyzer. FT-IR/Raman spectra were recorded via KBr pellets (4000–400 cm−1) using PerkinElmer spectrum RX 1 and BRUKER RFS 27 (4000–50 cm−1) models. 1H/13C NMR spectral analyses were performed on Bruker 400 MHz and 75.45 MHz FT-NMR spectrometers using TMS as an internal standard in DMSO-d6 solvent. The EDX experiment was carried out on an EDX OXFORD XMX N using a W filament. The SEM images were recorded by a JEOL Model JSM-6390LV. A BRUKER AXS model and a GERMANY D8 FOCUS model with Cu Kα−1 radiation were used to perform PXRD. UV-visible spectra (200–1100 nm) were recorded using the popular Hitachi U-3501 spectrophotometer model.
Computational methods
The non-covalent interaction (NCI) calculations were carried out using Gaussian-16 49 at the PBE0-D3/def2-SVP level of theory50,51 and the crystallographic coordinates. The X-ray coordinates were used because we were interested in evaluating the interactions as they exist in the solid state, instead of finding the most stable geometry in the gas phase. This methodology has been previously used to evaluate interactions in the solid state.51 The interaction energies were computed by calculating the difference between the energies of isolated monomers and their assembly. The interaction energies were corrected for the basis set superposition error (BSSE) by employing the methodology proposed by Boys–Bernardi.52 The NCI plot index (QTAIM)53,54 is based on the reduced density gradient (RDG) Iso-surfaces derived from the electronic density. Its first derivative has been used to reveal the interactions in real space through the AIM All calculation package.55 The molecular electrostatic potential surfaces were computed using Gaussian-16 software, and the 0.001 a.u. Iso-value. The Gaussian-16 software program was employed to perform the NBO analysis.
X-ray crystallography
The two iso-structural crystal complexes were grown in situ after slow evaporation of the methanol solvent at room temperature. For the generation of better diffraction quality crystals, five drops of DCM (dichloromethane) were added. The numerous crystal data were collected on a Bruker CCD56 diffractometer using MoKα radiation at λ = 0.71073 Å. To solve the crystal structure, we used versatile crystallographic programs. First, SMART was used to collect information frames, index reflections, and determine lattice parameters, SAINT57 was used to combine the intensity of reflections, and scale, SADAB58 was used for absorption correction, and SHELXTL was used for space group and structure determination, and least-squares refinements on F2. The crystal structure was solved by full-matrix least-squares methods against F2 using SHELXL-2014 59 and Olex-2 software.60 All the non-H atoms were refined with anisotropic shift parameters, and all hydrogen positions were constant at calculated positions, resulting in isotropic sensitivity. The essential crystallographic information and complete structure refinement parameters are shown in Table 1.
Full crystal data and structure refinement parameters.
| Complex | 1 | 2 |
| Formula | C44H46Cd4N6O12S2 | C42H42Cd4N6O12S2 |
| Formula weight | 1364.63 | 1336.58 |
| Temperature (K) | 293(2) | 293(2) |
| Crystal system | Orthorhombic | Orthorhombic |
| Space group | Pbcn | Pbcn |
| a (Å) | 20.758(6) | 20.758(6) |
| b (Å) | 11.022(3) | 11.022(3) |
| c (Å) | 21.396(6) | 21.396(6) |
| V [Å]3 | 4895(2) | 4895(2) |
| Z | 4 | 4 |
| d cal (g cm−3) | 1.852 | 1.814 |
| μ (mm−1) | 1.865 | 1.863 |
| F (000) | 2688 | 2624 |
| Total reflection | 182 284 | 182 284 |
| Unique reflections | 5095 | 5095 |
| Observed data [I > 2σ(I)] | 3924 | 3924 |
| R(int) | 0.082 | 0.08 |
| Goodness-of-fit on F2 | 1.18 | 1.20 |
| Min. and max. resd. dens. [e/Å3] | −1.43, 1.00 | −1.55, 0.74 |
| R 1, wR2 (all data) | 0.0881, 0.1482 | 0.0891, 0.1518 |
| R 1, wR2 [I > 2σ(I)] | 0.0672, 0.1368 | 0.0680, 0.1402 |
Synthesis of ligands
Salen-based ligands were obtained following the literature method.11,12,61
H2L1
The standard protocol was used to synthesize this type of ligand. First, 1,2-propanediamine (0.0371 g, 0.5 mmol) was mixed with Ortho vanillin (0.152 g, 1 mmol) in methanol solvent. The resulting solution was refluxed for ca. 2 h and allowed to cool. The yellow-coloured Salen ligand separated upon cooling the solution and was collected and dried. Yield: (90%), Anal. Calc. for C19H22N2O4: C, 66.65; H, 6.48; N, 8.18. Found: C, 66.59; H, 6.21; N, 8.13%. IR (KBr cm−1) selected bands: ν(C N), 1632, ν(C–Ophenolic), 1279, ν(OH), 3436, 1H NMR (DMSO-d6, 400 MHz): δ (ppm): 13.53 (s, 1H, OH), 8.59 (s, 1H, N CH), 6.87–7.45 (m, 8H, Ar–H), 3.40–3.69 (t, 2H, N–CH2), 2.01–2.51 (m, 2H, CH2), 13C NMR (DMSO-d6, 75.45 MHz): d (ppm): 116.92–132.75 (Arom-C), 161.15 (C–OH), 166.66 (CH N), UV-vis λmax (CH3OH): 254, 331 nm.
H2L2
A similar procedure was performed, except ethylenediamine was used in place of 1,2-propanediamine. Yield: (85%), Anal. Calc. for C18H20N2O4: C, 65.84; H, 6.14; N, 8.53. Found: C, 65.82; H, 6.10; N, 8.49%. IR (KBr cm−1) selected bands: ν(C N), 1638, ν(C–Ophenolic), 1281, ν(OH), 3437, 1H NMR (DMSO-d6, 400 MHz): δ (ppm): 13.39 (s, 1H, OH), 8.59 (s, 1H, N CH), 6.85–7.43 (m, 8H, Ar–H), 3.40–3.92 (t, 2H, N–CH2), 2.51 (m, 2H, CH2), 13C NMR (DMSO-d6, 75.45 MHz): δ (ppm): 116.92–132.83 (Arom-C), 161.01 (C–OH), 167.38 (CH N), UV-vis λmax (CH3OH): 283, 334 nm.
Synthesis of [L12Cd4(OAc)2(NCS)2] 1
Cd(OAc)2·2H2O (0.219 g, 1 mmol) was dissolved in 25 mL of hot methanol. After that, a methanolic solution of H2L1 (0.0742 g, 1 mmol) was added, followed by the drop-wise addition of an aqueous methanolic (5 mL) solution of NaSCN (0.081 g, 1 mmol). The resultant mixture was refluxed at room temperature for 1 h. Then, five drops of DCM were added to this reflux solution. Finally, the mixture was stirred at 75 °C for 1 h under ice-bath conditions. The light-yellow solution was filtered and kept at room temperature for slow crystallization. After seven days, block-sized, light, yellow-coloured single crystals suitable for SCXRD were obtained. Yellow crystals were isolated by filtration after proper rinsing with cold methanol to eliminate the contaminants and tight air-dried in a desiccator. Yield: 0.402 g, (53%), Anal. Calc. for C44H46Cd4N6O12S2: C, 38.73; H, 3.40; N, 6.16. Found: C, 38.68; H, 3.38; N, 6.12%. FT-IR (KBr cm−1) selected bands: ν(C N), 1623 s, ν(NCS), 2072 s, ν(Ar–O), 1445 s, FT-Raman (cm−1) selected bands: ν(C N), 1635 s, ν(NCS), 2126 s, 1H NMR (DMSO-d6, 400 MHz): δ (ppm): 2.51 (s, 3H), 7.15 (w, Arom-H), 8.21 (w, 1H), 3.77 (m, 2H), UV-vis λmax (DMF): 269 and 357 nm.
Synthesis of [L22Cd4(OAc)2(NCS)2] 2
2 was synthesized using a similar synthetic protocol with H2L2 instead of H2L1. Yellow crystals were isolated by filtration after proper rinsing with cold methanol to eliminate the contaminants and tight air-dried in a desiccator. Yield: 0.398 g, (51%), Anal. Calc. for C42H42Cd4N6O12S2: C, 37.74; H, 3.71; N, 6.29. Found: C, 37.71; H, 3.65; N, 6.32%. FT-IR (KBr cm−1) selected bands: ν(C N), 1623 S, ν(NCS), 2088 s, ν(Ar–O), 1406 s, 1H NMR (DMSO-d6, 400 MHz): δ (ppm): 2.51 (s, 3H), 7.15 (w, Arom-H), 8.21 (w, H), 3.74 (m, H), UV-vis λmax (DMF): 269 and 357 nm.
Results and discussion
Synthetic perspective
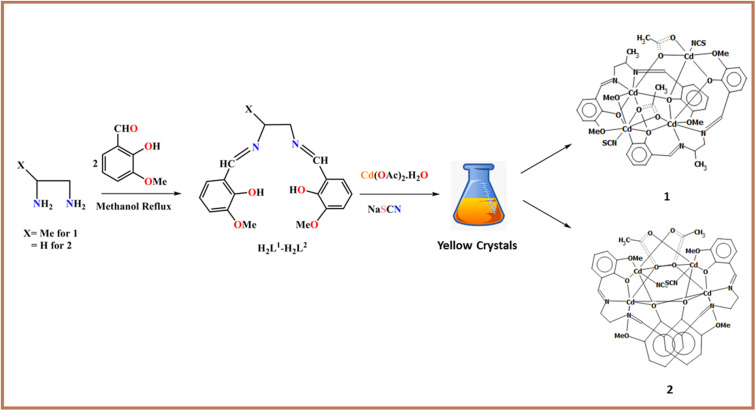
The two trendy Salen ligands were synthesized using a previous literature method (Scheme 1).11,12,61 The two complexes containing the Salen ligands are iso-structural, and SCN− co-ligands were prepared in moderate yields by a self-assembly in situ procedure (Scheme 1). Generally, a methanol solution of the two Salen ligands was treated with Cd(OAc)2·2H2O in sodium thiocyanate, which produces iso-structural complexes after solvent evaporation at room temperature. The compounds are insoluble in water and are soluble in most common organic solvents. The complexes were isolated analytically in pure light yellow crystalline form with moderate air and moisture sensitivity. Notably, the single crystals were not grown in methanol solvent alone; we used a few drops of DCM to promote better diffraction-quality crystals suitable for SCXRD (Scheme 1). The trendy Salen ligands used herein comprise two imines, two phenols, two alkoxys, and one weakly acidic aliphatic –OH group. After deprotonation, the Salen-type ligand forms an N2O2 imine chelating position,11–16 successfully capturing several transition/post-metal ions (Scheme S2†). The complexation leads to polymerization in the presence of a versatile spacer. Such ligand activities are explored in the literature vividly.11–16 Concerning the novelty of this work, our dedicated research team envisaged that tetrel bonding interactions with carbon result from methoxy groups, which is rare in the literature. The tetrel bonding was studied based on MEP, NCI plot, RDG surface, and NBO analyses.
Scheme 1. Outline for the synthesis of the ligands and complexes.
Spectroscopic characterization
FT-IR/Raman spectroscopy
The IR and Raman spectroscopic study successfully characterized the ligands and complexes. Here, since the two compounds are structurally analogous, we only present the characterization of 1 in detail. The two ligands exhibit imine (C N) stretching in the range of 1632–1638 cm−1 (Fig. S1†).62 Therefore, imine (C N) bond formation in both ligands is common. For 1, the IR and Raman bands are shifted to 1623 cm−1 (Fig. S2†) and 1635 cm−1 (Fig. S3†), respectively, which supports the coordination mode of the azomethine nitrogen atom to the Cd metal centre.63 Thiocyanate co-ligands (SCN−) showed influential strong bands at 2072 cm−1 (1) (stretching band for SCN− at 2069 cm−1) and 2126 cm−1 (1) (Raman) (Fig. S2 and S3†). Such splitting patterns are attributed to non-bifurcated binding modes with the Cd metal ions.64 The observed Ar–O stretching frequency near 1279–1281 cm−1 is identical to that of the reported Salen ligands.
UV-visible spectra
The UV-visible spectra of the ligands and 1 were recorded in CH3OH and DMF. The two ligands exhibit bands at 254, 331 nm and 283, 334 nm (Fig. S4†), respectively. These transitions are of the π → π*/n → π* type. In contrast, 1 reveals a potent ligand-based UV domain at 269, 357 nm (Fig. S5†) due to the L → M charge-transfer transition (π → π*/n → π*)63,65 that is identical to that of the previously reported Salen.66,67 Because of the d10 configuration and the diamagnetic nature of Cd(ii), no broad metal-centered d–d absorption band was identified.
NMR study
In addition, we structurally characterized the ligands and 1 using NMR spectroscopic tools (Fig. S6 and S8†). We did not find a broad peak in the region δ 5.0–8.0 ppm, supporting the absence of the –NH2 group. The phenolic protons (OH) are associated with a defined broad peak in the δ 13.39–13.53 ppm range. The protons in 1, bound to the imino carbon, are downshifted by 8.21 ppm due to the combined action of phenolic –OH and imino N groups in their immediate vicinity.66,67 For both ligands, peaks in the range of 6.81–7.45 ppm and 6.83–7.43 ppm correspond to the aromatic protons. In 1, almost identical peaks are identified near 7.15 ppm. The three methyl protons (OCH3) in the ligand bound to the aromatic oxygen appear at 3.40–3.92 ppm. In compound 1, such peaks were observed near 3.77 ppm. The OH proton signal (OH) on the ligand disappeared in the 1H NMR spectra of 1, indicating deprotonation and coordination of the O atom with the Cd metal ion.73,74 The 13C NMR spectra of the first Salen-type ligand showed the azomethine (CH N) carbons at 166.66 ppm, aromatic carbons at 116.92–132.75 ppm, and C–OH carbons at 161.15 ppm, respectively. The second Salen ligand showed aromatic carbons at 116.92–132.83 ppm, C–OH carbons at 161.01 ppm, and azomethine (CH N) carbons at 167.38 ppm, respectively (Fig. S7†). All the above discussion is based on the experimental section.
SEM-EDX and PXRD analysis
We characterized 1 based on EDX (energy dispersive X-ray spectroscopy) and SEM. EDX is an analytical technique used to describe elemental composition. The chemical composition correctly confirmed the presence of the elements C, O, Na, S, and Cd in the EDX profile (Fig. S9†). The synthesized complexes are SCN− spacer linked. Hence, we used NaSCN. Therefore, the origin of Na is from NaSCN. The molecular formula of the compound is justified. The EDX profile shows that the highest peak belongs to S, followed by Cd metal ions. In addition, SEM (Scanning Electron Microscopy) is a powerful analysis technique used to determine a synthesized compound's structural shape, size, and morphological properties.12,13,68–70 We describe the ligands (ESI-2 & ESI-3† for SEM) and 1 separately (Fig. S10†). Here, the ligands have an unorganized ice-type SEM morphology, whereas the ice-based morphology is more organized in 1. The PXRD method was used to scrutinize the phase purity and crystallinity of the complex. PXRD patterns were recorded at room temperature. Experimental scanning of the compound in the range of 2θ = 4–50° was used to record the PXRD patterns. The well-defined sharp PXRD peaks support the crystalline nature of 1 (Fig. S11†). The material's experimental and simulated powder X-ray diffraction patterns agree well, indicating bulk sample consistency.
X-ray crystal structure description of 1 and 2
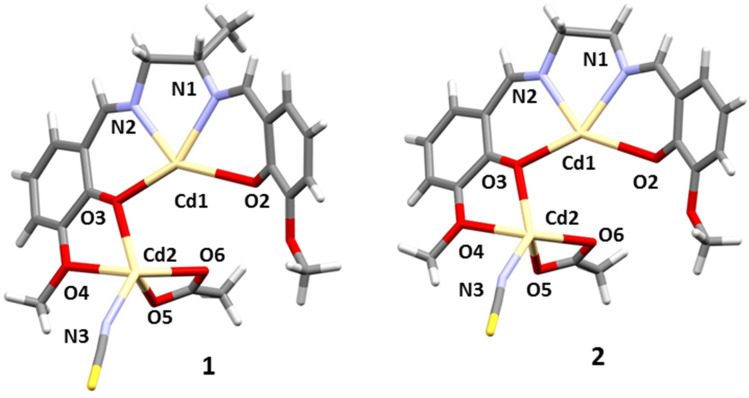
The X-ray crystal structure determination revealed that 1and2 crystallize in the orthorhombic space group Pbcn. The molecular structure is built from isolated tetranuclear molecules of [L2Cd4(OAc)2(NCS)2] {where L = L1 (N,N′-bis(3-methoxysalicylidene)-1,2-diaminopropane) in 1and L2 (N,N′-bis(3-methoxysalicylidene)-ethylenediamine) in 2}. In the two complexes, the asymmetric unit contains one Salen-type ligand (L1 in 1 and L2 in 2), two Cd(ii) centres, and two co-ligands; an acetate and a thiocyanate (Fig. 1). The complete crystallographic data and refinement details are given in Table 1. Bond distances and angles are summarized in Table S1.†
Fig. 1. Perspective view of 1 and 2 (asymmetric unit) with a selective atom numbering scheme.
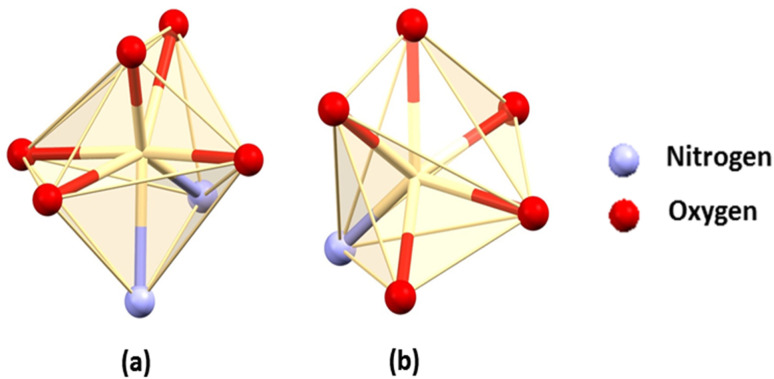
In each complex, the inner N2O2 core is occupied by a hepta-coordinated Cd(ii) centre. Cd(1) is coordinated by two imine nitrogen atoms, N(1) and N(2), and two phenoxy oxygen atoms, O(2) and O(3), from deprotonated Schiff base ligands (L2−), which constitute the equatorial plane. The fifth, sixth and seventh coordination sites are occupied by one methoxy oxygen, O(1)#, one phenoxy oxygen, O(2)#, from another Schiff base ligand and acetate oxygen, O(6) # [# = 1 − x, y, 1.5 − z ]. This acetate oxygen, O(6), is further coordinated with the Cd(2) centre. Cd(2) is hexacoordinated where one phenoxy oxygen, O(3), one methoxy oxygen, O(4), from one Schiff base ligand and another phenoxy oxygen, O(2)#, from the other Schiff base ligand arrange around Cd(2). The remaining three coordination sites are filled by a nitrogen atom, N(3), from a thiocyanate molecule and two acetate oxygens, O(5) and O(6). Cd(1) adopts a capped octahedral geometry, whereas Cd(2) assumes a distorted trigonal prismatic geometry (Fig. 2).
Fig. 2. Perspective view of the (a) capped octahedral and (b) trigonal prismatic geometry of the Cd(1) and Cd(2) centres in both complexes.
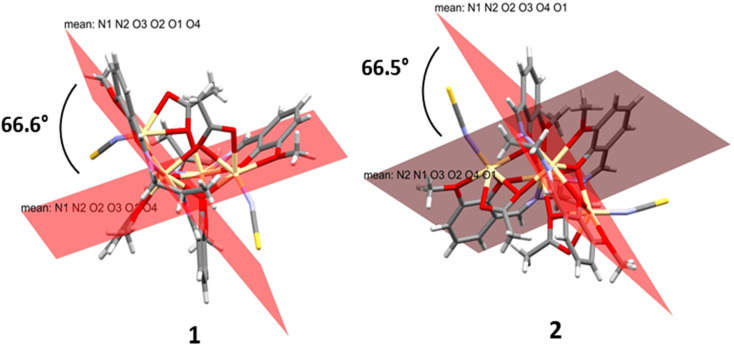
In 1 and 2, two Salen ligands are oriented vertically with each other at an angle of 66.6° and 66.5°, respectively (Fig. 3). The said arrangements lead to the formation of an unusual open cubane core71 within the complexes (Fig. S12†). The open cubane has five Cd2O2 faces with Cd–O bond distances ranging from 2.224(6) Å to 2.499(6) Å. The O–Cd–O bond angles are within the range of 69.4(2)° to 105.4(3)°. The intermetallic distances predict that the cubane core is in the (2 + 2 + 1 + 1) category, which also signifies that it is an open core.
Fig. 3. Arrangement of Salen ligands in both complexes.
Supramolecular interactions
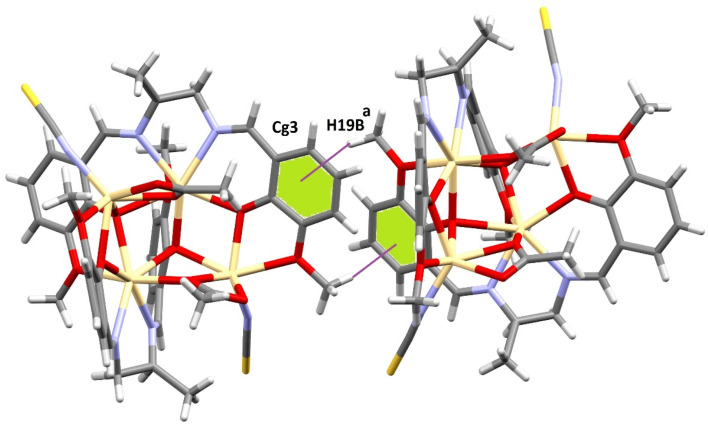
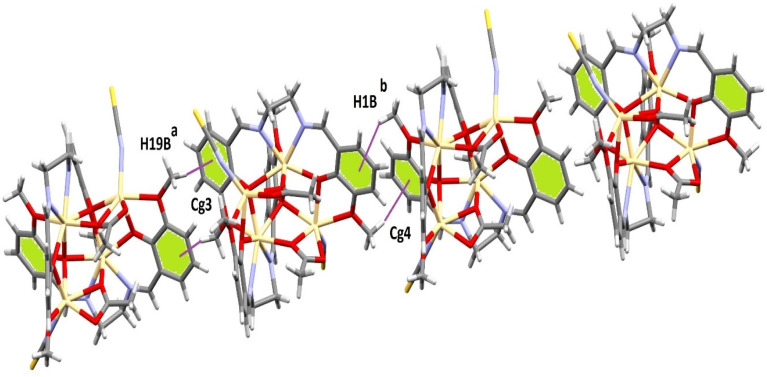
The crystal packing of both complexes involves C–H⋯π(arene) and tetrel bonding interactions. In 1, the hydrogen atom, H(19B), attached to a carbon atom, C(19), of a methoxy (OCH3) group interacts with the symmetry-related [1/2 + x, −1/2 + y, 3/2 − z] aromatic ring [C(2)–C(3)–C(4)–C(5)–C(6)–C(7)] at a distance of 2.88 Å forming a dimeric assembly (Fig. 4). A similar interaction was observed in 2. Two C–H⋯π(arene) interactions were observed, which lead to the formation of a 1D supramolecular structure (Fig. 5). Two hydrogen atoms, H(19B) and H(1B), attached to two carbon atoms, C(19) and C(1), of two (OCH3) methoxy groups respectively interact with symmetry-related [a = 1/2 + x, −1/2 + y, 3/2 − z; b = −1/2 + x, 1/2 + y, 3/2 − z] aromatic rings [C(2)–C(3)–C(4)–C(5)–C(6)–C(7)] and [C(12)–C(13)–C(14)–C(15)–C(16)–C(17)] at a distance of 2.90 Å and 2.99 Å, respectively. The details of the geometric features of the C–H⋯π(arene) interactions of both complexes are given in Table 2.
Fig. 4. Supramolecular assembly formed through C–H⋯π(arene) interactions in the solid-state of 1. [a = 1/2 + x, −1/2 + y, 3/2 − z].
Fig. 5. Supramolecular 1D structure formed through C–H⋯π(arene) interactions in the solid-state of complex 2. [a = 1/2 + x, −1/2 + y, 3/2 − z; b = −1/2 + x, 1/2 + y, 3/2 − z].
Geometric features (distances in Å and angles in °) of the C–H⋯π interactions observed for both complexesa.
| Complex | C–H⋯Cg (ring) | H⋯Cg (Å) | C–H⋯Cg (°) | C⋯Cg (Å) | Symmetry |
|---|---|---|---|---|---|
| 1 | C(49)–H(49A)⋯Cg(15) | 2.88 | 164 | 3.816(16) | 1/2 + x, −1/2 + y, 3/2 − z |
| 2 | C(1)–H(1B)⋯Cg(4) | 2.99 | 141 | 3.784(16) | 1/2 + x, −1/2 + y, 3/2 − z |
| C(19)–H(19B)⋯Cg(3) | 2.90 | 161 | 3.815(16) | 1/2 + x, −1/2 + y, 3/2 − z |
[Cg(7) = centre of gravity of the ring [C(3)–C(4)–C(5)–C(6)–C(7)–C(8)]; Cg(15) = centre of gravity of the ring [C(26)–C(27)–C(28)–C(29)–C(30)–C(31)]; Cg(16) = centre of gravity of the ring [C(39)–C(40)–C(41)–C(42)–C(43)–C(44)].
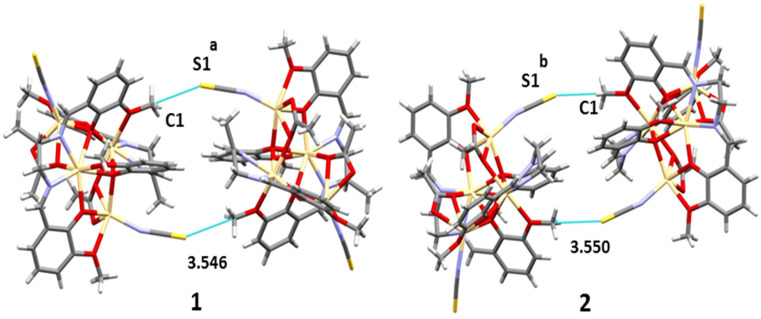
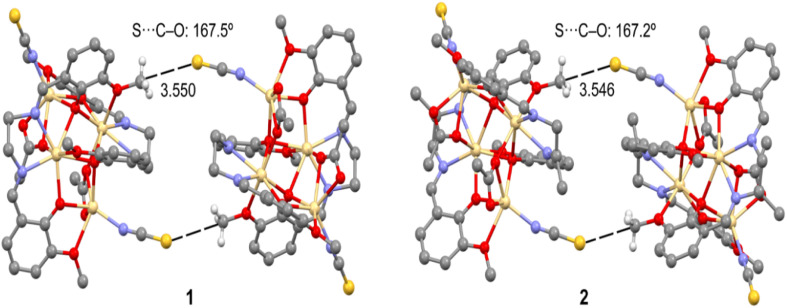
In both complexes, the sulphur atom, S(1), of a thiocyanate molecule forms S⋯C–O interactions with the symmetry-related [a = 1 − x, 2 − y, 1 − z for 1, b = 1 − x, y, 1.5 − z for 2] methoxy carbon, C(1), at a distance of ∼3.55 Å. When analyzing the nature of the interaction, it was assumed that a σ-hole is formed and locates over the carbon atom establishing a tetrel bonding interaction. Very similar tetrel bond distances were observed with reported Pb complexes (Table S1†). A dimeric assembly is generated through this interaction (Fig. 6). For detailed analysis, theoretical calculations were performed and are discussed in the latter part of the manuscript.
Fig. 6. Tetrel bonding interactions observed in both complexes.
Hirshfeld surface analysis
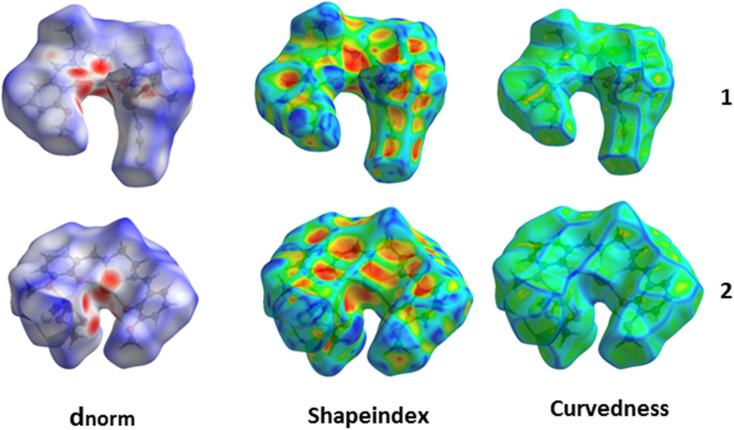
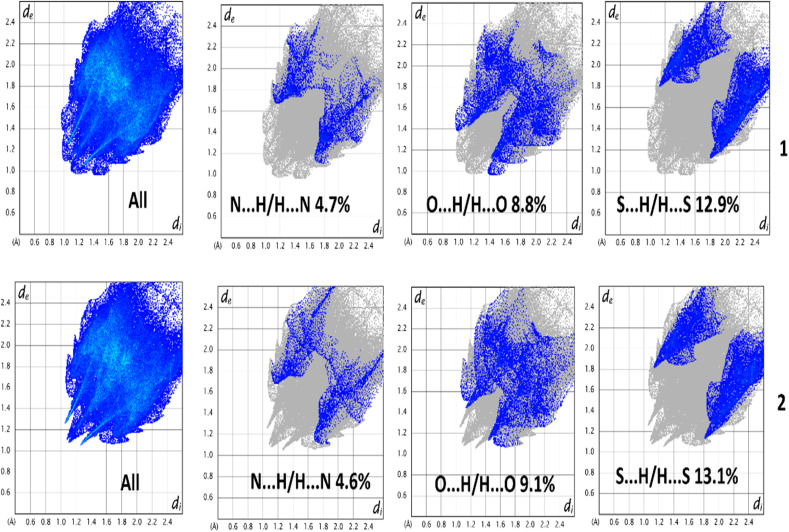
Hirshfeld surfaces72 were established by electron distribution and obtained as the sum of the electron densities of spherical atoms.73 Hirshfeld surfaces help analyze the properties of short/extended contacts of non-covalent interactions through color-coding in the crystal lattice. A particular Hirshfeld surface is obtained for specific crystal and spherical atomic densities.74 The Hirshfeld surfaces and 2D fingerprint plots were calculated with the help of Crystal Explorer 17.5.75 The normalized contact distance (dnorm) is determined by the distance of the atoms inside (di) and outside (de) the Hirshfeld surface with the vdW radii of the corresponding atoms.76 The 2D fingerprint plot displayed some information on the intermolecular contacts through a combination of de and di in the crystal.77 Hirshfeld surface analysis is used to interpret the noncovalent interactions present in the solid state structure of a complex. It helps to measure the electronic distribution around the surface of a particular complex. Moreover, it is also used in calculating the interaction energies and energy frameworks within a complex.78 The Hirshfeld surfaces of both complexes were mapped with dnorm (−0.5 to 1.5 Å), shape index (−1.0 to 1.0 Å), and curvedness (−4.0 to 0.4 Å) as shown in Fig. 7. The dnorm Hirshfeld surfaces feature deep and light red zones that reveal the positions of strong contact and interactions. In contrast, the white patches represent weaker and longer connections. Using HS and 2D fingerprint plot analysis, we compared the intermolecular interactions in 1 and 2. In Table 3, the possible intermolecular interactions are shown in detail. Interestingly, the two complexes are analogous structures and hence hold nearly identical percentages of interactions (Fig. 7). We compared the interactions in 1 and 2 and observed that the significant interactions are O⋯H, N⋯H, and S⋯H. Furthermore, the dominant interactions are S⋯H in both complexes, but their level is slightly higher in 2. Therefore, the aforementioned significant contributions in the crystal structures are responsible for the supramolecular topographies. The minor contributing interactions in the complexes are N⋯H. The 2D fingerprint plots established using de and di elaborate on the observed contacts/interactions in both complexes (Fig. 8).
Fig. 7. Hirshfeld surfaces mapped with dnorm (left), shape index (middle), and curvedness (right).
HAS-based possible intermolecular interactions.
| Entry of intermolecular interactions | Percentage contribution | |
|---|---|---|
| 1 | O⋯H | 8.8 (%) |
| N⋯H | 4.7 (%) | |
| S⋯H | 12.9 (%) | |
| 2 | O⋯H | 9.1 (%) |
| N⋯H | 4.6 (%) | |
| S⋯H | 13.1(%) | |
Fig. 8. 2D fingerprint plot deconvoluted into different contacts.
Tetrel bonding/σ-hole interactions
As shown in Fig. 9, both compounds form self-assembled dimers in the solid-state X-ray crystal structures. The S-atom of the thiocyanate co-ligand (SCN−) is opposite the C–O bond at 3.55 Å, almost identical to the sum of C + S van der Waals radii (3.50 Å), thus suggesting the existence of a tetrel bonding interaction. Moreover, the S⋯C–O angles are around 167 Å, which is typical of σ-hole interactions. The theoretical study focused on this interaction and especially on differentiating it from classical CH⋯S interactions. Since both complexes exhibit almost identical geometric features and electronic environments, we have used only 1 for this DFT study.
Fig. 9. Partial view of the solid-state X-ray structures of 1 and 2 (distances in Å). Only the H-atoms belonging to the interacting methoxy groups (OCH3) are shown.
MEP surface
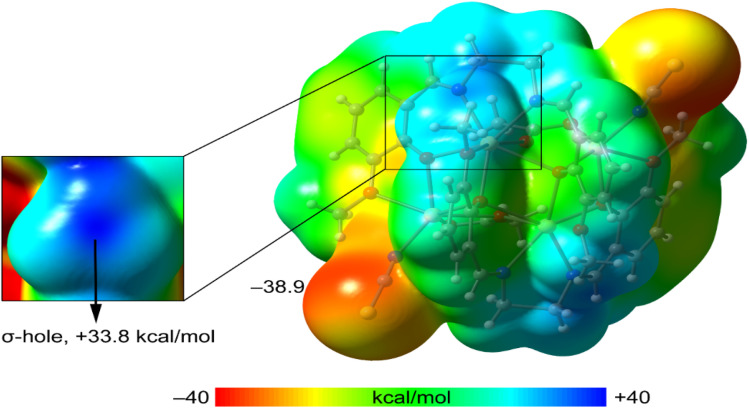
First, we computed the MEP surface to investigate the molecule's most nucleophilic and electrophilic parts. Quite remarkably, the MEP maximum is located at the C-atom of the methoxy group that forms the S⋯C interactions shown in Fig. 10. It is essential to explore the presence of a σ-hole at the C-atom (darkest blue region, see inset graphic), exactly on the extension of the O–C bond. Moreover, the MEP value at the C-atom is more positive than that at the H-atoms of the methyl group, thus disclosing the higher ability of the methoxy group as a carbon bond donor than a hydrogen bond donor. As expected, the MEP minimum is located at the S-atom of the thiocyanate ligands (−38.9 kcal mol−1) (Fig. 10). Further, we are not sure about the meaning of the energy change of relevant atoms. The MEP surface does not provide energy changes; the MEP simply provides the potential energy of a proton positioned at each point of the van der Waals surface. It is thus considered an efficient tool for understanding and interpreting the chemical properties of molecules. Since the MEP at the C-atom of the methyl group is large and positive, and that at the S-atom is large and negative, a favourable electrostatic attraction is anticipated.
Fig. 10. MEP surface of 1 at the PBE0-D3/def2-TZVP level of theory. In the inset graphic, an amplified region of the MEP surface around the methoxy group (OCH3) is shown. (Energies in kcal mol−1).
NCI plot: a good computational tool
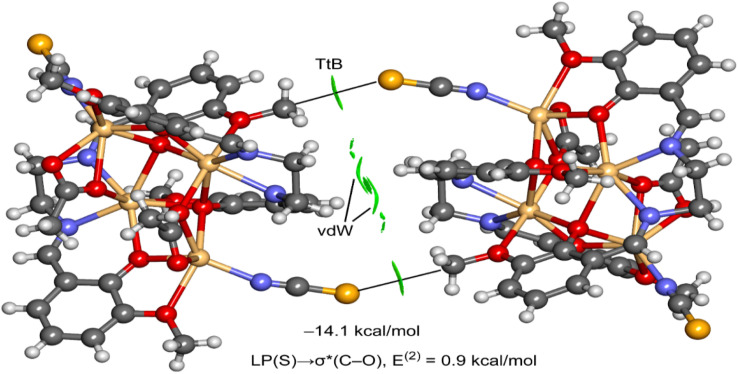
We used the NCI plot computational tool to further characterize the S⋯C tetrel bond. The above method is based on the representation of the reduced density gradient (RDG) as iso-surfaces, and it is very convenient to reveal interaction in real space. Moreover, the color of the iso-surface is used to differentiate between repulsive and attractive interactions. It is based on the sign of the second eigenvalue of the Hessian of ρ (sign λ2). In this work, we have used green for attractive and yellow for repulsive. The NCI plot analysis of the dimer is shown in Fig. 11, evidencing the presence of two symmetrically equivalent green iso-surfaces between the C-atom and the S-atom of the SCN ligand, thus confirming the existence of the tetrel bond. Moreover, a more extended iso-surface is located between the bulk of both molecules, between the C–H bonds, thus disclosing the existence of additional van der Waals interactions. The dimerization energy is large (−14.1 kcal mol−1), thus confirming the importance of such contacts in the solid state of 1.
Fig. 11. NCI plot analysis of the dimer of 1. The dimerization energy is also indicated as the result of the NBO analysis.
Natural bond orbital (NBO) analysis
To further analyze the physical nature of the interaction and to differentiate the tetrel bond from a trifurcated S⋯H3C H-bonding interaction, we performed natural bond orbital (NBO) analysis. This method helps to analyze donor–acceptor interactions from an orbital point of view. Interestingly, second-order perturbation analysis showed electron donation from a lone pair (LP) orbital located at the S-atom of the thiocyanate ligand to the antibonding σ(C–O) orbital, as is typical in σ-hole interactions. Although the concomitant stabilization energy is minimal (0.9 kcal mol−1), it confirms that the electron donation of the S-atom is to the C-atom and not the H-atoms. The analysis does not show any other donor–acceptor interaction between the monomers, further supporting the σ-hole tetrel nature of the S⋯C contact. Finally, it should be mentioned that the small orbital contribution suggests that the tetrel bonding interaction is dominated by electrostatic effects, in good agreement with the MEP analysis that revealed that the minimum and maximum MEP values are located at the atoms involved in the tetrel bonding.
Tetrel bonding: a comprehensive literature review
The novelty of this research is fundamental to us. Therefore, to substantiate the wonder of the work, we performed an extensive literature review concerning the tetrel bonding interactions induced by any atomic groups. Herein, the inspection is restricted to the Salen crystal complexes involving thiocyanate spacers only (Table 4). It is noteworthy that large, heavier, and polarizable Pb(ii) metal ions form tetrel bonds among the group IV elements. Pb(ii) can act as an electron donor to form supramolecular interactions for such bonds.79,80 These interactions have been widely referred to as chalcogen, pnictogen, and halogen bonds.81 Therefore, tetrel bonding interactions are most commonly expected for the homo/heteronuclear lead complexes. The above discussion supports the below-mentioned published works (Table 4). Tetrel bonding interactions involving the CH3 group are rare in the literature. The high-precision X-ray diffraction method recently observed the tetrel bonds formed by CH3 groups in the crystal structures. In our present work, we have observed a similar type of bonding, leading to the formation of self-assembled dimers, whereas most published works explore the standard tetrel bonding conception. The present research reports two iso-structural Cd(ii)–Salen complexes containing tetrel bond interactions initiated by the methyl groups.
Comparison of tetrel bonding in the complexes reported here with that of analogous complexes.
| Literature reported complexes | Ligands | Spacer | Tetrel bond | Ref. |
|---|---|---|---|---|
| [L12Cd4(OAc)2(NCS)2] | Salen | SCN− | Tetrel bond interactions by CH3 groups | This work |
| [L22Cd4(OAc)2(NCS)2] | ||||
| [(SCN)CuL1Pb(SCN)] | Salen | SCN− | Pb⋯S tetrel bonding | 18 |
| [(SCN)NiL1(μ1,3-NCS)Pb] | Salen | SCN− | Pb⋯S and Pb⋯π type tetrel bonding | 19 |
| [(SCN)NiL1(μ-OAc)Pb] | ||||
| [(SCN)NiL2(μ-OAc)Pb] | ||||
| [(H2O)DMSO)NiLPbCl](SCN) | Salen | SCN− | Pb⋯Cl tetrel bonds | 20 |
| [(H2O)Ni(SCN)L1Pb(OAc)]·DMSO | Salen | SCN− | Pb-noncovalent | 21 |
| [(H2O)2NiL2PbCl2] | Tetrel bonding interactions | |||
| [(SCN)NiL2(OAc)Pb] | ||||
| [(H2O)Ni(SCN)L3PbCl] | ||||
| [(NCS)(H2O)NiLPb(DMF)Cl] | Salen | SCN− | — | 22 |
Concluding remarks
This article vividly delineates the synthesis, spectroscopic study, and single-crystal structure characterization of two iso-structural Cd(ii)–Salen complexes. The inner N2O2 and outer O4 compartments are substantially filled by Cd(ii) metal ions resulting from the de-protonated form of the ligand. The X-ray results divulge that Cd(1) adopts a capped octahedral geometry, whereas Cd(2) assumes a distorted trigonal prismatic geometry. The crystal structure in the solid state displayed various non-covalent supramolecular interactions endorsed by the Hirshfeld surface and 2D fingerprint analyses. Herein, the interesting S⋯H, O⋯H, and N⋯H contacts are mainly observed, which hold identical percentages in both complexes. The rare tetrel bonding interactions in the complex preferentially involving the CH3 group were appraised in a new dimension using DFT. This type of interaction occurs because the C-atom in the electron-withdrawing CH3 group has a σ-hole opposite the EWG (EWG = electron-withdrawing group)–C bond that is adequate for interacting with electron donors (Lewis bases, anions, or π-systems). The same has been demonstrated before in the case of coordinated OCH3 groups. The coordination of the O-atom to a cadmium metal centre increases the magnitude of the σ-hole at the C-atom. We observed this type of bonding, leading to the formation of self-assembled dimers in the complexes. Overall, such unique bonding interactions were quantified by DFT-based MEP, RDG surface, NBO, and QTAIM/NCI plot analyses. We anticipate that the reported results will benefit scientists working in crystal engineering. Furthermore, applying QTAIM/NCI plots to analyze rare tetrel bonds initiated by the CH3 group in Salen complexes will open a new avenue in crystal engineering that is still being unveiled.
Author contributions
Dhrubajyoti Majumdar was the project's project administrator and conceived the whole research idea, performed data curation, conceptualization, methodology, research investigation, formal analysis, software visualization, writing review, initial draft preparation, and editing. Antonio Frontera performed all DFT-based experiments. Sourav Roy was involved in the X-ray structure analysis of single crystals and various Graphics preparation. All authors in the manuscript carefully read and approved the final version before submission.
Conflicts of interest
The authors indicate no competing interests or personal relationships that may have influenced the work described in this paper.
Supplementary Material
Acknowledgments
This research has not received specific funding from any funding agency in the public, commercial, or non-profit sectors. All authors thank the Central Laboratory of Tamralipta Mahavidyalaya, Tamluk, West Bengal, India, funded by the DST-FIST project (Level-0) under the Department of Science and Technology, Govt. from India. All authors of the manuscript carefully read and approved the final version before submission.
Electronic supplementary information (ESI) available. CCDC 2210803 (1) and 2210804 (2). For ESI and crystallographic data in CIF or other electronic format see DOI: https://doi.org/10.1039/d2ra07080d
References
- Das L. K. Biswas A. Gomez-Garcia C. J. Drew M. G. B. Inorg. Chem. 2014;53(1):434–445. doi: 10.1021/ic402415b. [DOI] [PubMed] [Google Scholar]
- Blatov V. A., and Proserpio D. M., in Modern Methods of Crystal Structure Prediction, ed. A. R. Oganov, Wiley-VCH, Weinheim, 2011, ch. 1 [Google Scholar]
- Bradshaw D. Garai A. Huo J. Chem. Soc. Rev. 2012;41:2344–2381. doi: 10.1039/c1cs15276a. [DOI] [PubMed] [Google Scholar]
- Zhu Q.-L. Xu Q. Chem. Soc. Rev. 2014;43:5468–5512. doi: 10.1039/c3cs60472a. [DOI] [PubMed] [Google Scholar]
- Hoskins B. F. Robson R. J. Am. Chem. Soc. 1990;112:1546–1554. [Google Scholar]
- Singh M. Ramanan A. Cryst. Growth Des. 2011;11:3381–3394. [Google Scholar]
- Batten S. R. Robson R. Angew R. Chem. Int. Ed. 1998;37:1460–1494. doi: 10.1002/(SICI)1521-3773(19980619)37:11<1460::AID-ANIE1460>3.0.CO;2-Z. [DOI] [PubMed] [Google Scholar]
- Adarsh N. N. Dastidar P. Cryst. Growth Des. 2011;11:328–336. [Google Scholar]
- Maji T. K. Uemura K. Chang H. C. Matsuda R. Kitagawa S. Angew. Chem., Int. Ed. 2004;43:3269–3272. doi: 10.1002/anie.200453923. [DOI] [PubMed] [Google Scholar]
- Shiga T. Okewa H. Kitagawa S. Ohba M. J. Am. Chem. Soc. 2006;128:16426–16427. doi: 10.1021/ja066434x. [DOI] [PubMed] [Google Scholar]
- Majumdar D. J. Dey S. Sreejith S. S. Biswas J. K. Mondal M. Shukla P. Das S. Pal T. K. Das D. Bankura K. Mishra D. J. Mol. Struct. 2019;1179:694–708. [Google Scholar]
- Majumdar D. J. Frontera A. Gomila R. M. Das S. Bankura K. P. RSC Adv. 2022;12:6352–6363. doi: 10.1039/d1ra09346k. [DOI] [PMC free article] [PubMed] [Google Scholar]
- Majumdar D. J. Tüzün B. Pal T. K. Das S. Bankura K. J. Inorg. Organomet. Polym. 2022;32:1159–1176. [Google Scholar]
- Majumdar D. J. Dey S. Sreejith S. S. Biswas J. K. Mondal M. Shukla P. Das S. Pal T. K. Das D. Bankura K. Mishra D. J. Mol. Struct. 2019;1179:694–708. [Google Scholar]
- Majumdar D. J. Phillip J. E. Tüzün B. Frontera A. Gomilla R. Roy S. Bankura K. J. Inorg. Organomet. Polym. 2022;32:4320–4339. [Google Scholar]
- Majumdar D. J. Tüzün B. Pal T. K. Saini R. V. Bankura K. Mishra D. Polyhedron. 2021;210:115504. [Google Scholar]
- Majumdar D. J. Phillip J. E. Das S. Kundu B. K. Saini R. V. Chandan G. Bankura K. Mishra D. J. Mol. Struct. 2021;1225:129189. [Google Scholar]
- Mirdya S. Banerjee S. Chattopadhyay S. CrystEngComm. 2020;22:237–247. [Google Scholar]
- Mirdya S. Roy S. Chatterjee S. Bauza A. Frontera A. Chattopadhyay S. Cryst. Growth Des. 2019;19:5869–5881. [Google Scholar]
- Mirdya S. Frontera A. Chattopadhyay S. CrystEngComm. 2019;21:6859–6868. [Google Scholar]
- Roy S. Drew M. G. B. Bauza A. Frontera A. Chattopadhyay S. New J. Chem. 2018;42:6062–6076. [Google Scholar]
- Mahmoudi G. Bauzá A. Frontera A. Dalton Trans. 2016;45:4965–4969. doi: 10.1039/c6dt00131a. [DOI] [PubMed] [Google Scholar]
- Liu X. Manzur C. Novoa N. Celedoń S. Carrillo D. Hamon J.-R. Coord. Chem. Rev. 2018;357:144–172. [Google Scholar]
- Vigato P. A. Tamburini S. Bertolo L. Coord. Chem. Rev. 2007;251:1311–1492. [Google Scholar]
- Chattopadhyay S. Ray M. S. Chaudhuri S. Mukhopadhyay G. Bocelli G. Cantoni A. Ghosh A. Inorg. Chim. Acta. 2014;359:1367–1375. [Google Scholar]
- Barone G. Terenzi A. Lauria A. Almerico A. M. Leal J. M. Busto N. Garcia B. Coord. Chem. Rev. 2013;257:2848–2862. [Google Scholar]
- Legon A. C. Phys. Chem. Chem. Phys. 2017;19:14884–14896. doi: 10.1039/c7cp02518a. [DOI] [PubMed] [Google Scholar]
- Cavallo G. Metrangolo P. Pilati T. Resnati G. Terraneo G. Cryst. Growth Des. 2014;14:2697–2702. [Google Scholar]
- (a) Terraneo G. Resnati G. Cryst. Growth Des. 2017;17:1439–1440. [Google Scholar]; (b) Southern S. A. Bryce D. J. Phys. Chem. A. 2015;119(49):11891–11899. doi: 10.1021/acs.jpca.5b10848. [DOI] [PubMed] [Google Scholar]
- Desiraju G. R. Parthasarathy R. J. Am. Chem. Soc. 1989;111:8725–8726. [Google Scholar]
- Desiraju G. R. Ho P. S. Kloo L. Legon A. C. Marquardt R. Metrangolo P. Politzer P. Resnati G. Rissanen K. Pure Appl. Chem. 2013;85:1711–1713. [Google Scholar]
- Politzer P. Murray J. S. Clark T. Phys. Chem. Chem. Phys. 2010;12:7748–7757. doi: 10.1039/c004189k. [DOI] [PubMed] [Google Scholar]
- Politzer P. Murray J. S. Clark T. Resnati G. Phys. Chem. Chem. Phys. 2017;19:32166–32178. doi: 10.1039/c7cp06793c. [DOI] [PubMed] [Google Scholar]
- Del Bene J. E. Alkorta I. Elguero J. Chem. Phys. Lett. 2016;655–656:115–119. [Google Scholar]
- Scheiner S. Molecules. 2018;23:1147. doi: 10.3390/molecules23051147. [DOI] [PMC free article] [PubMed] [Google Scholar]
- Esrafili M. D. Asadollahi S. Mousavian P. Chem. Phys. Lett. 2018;691:394–400. [Google Scholar]
- Esrafili M. D. Mousavian P. Molecules. 2018;23:2642. doi: 10.3390/molecules23102642. [DOI] [PMC free article] [PubMed] [Google Scholar]
- Mani D. Arunan E. Phys. Chem. Chem. Phys. 2013;15:14377–14383. doi: 10.1039/c3cp51658j. [DOI] [PubMed] [Google Scholar]
- Grabowski S. J. Phys. Chem. Chem. Phys. 2014;16:1824–1834. doi: 10.1039/c3cp53369g. [DOI] [PubMed] [Google Scholar]
- Bauza A. Frontera A. Crystals. 2016;6:26. [Google Scholar]
- Garcia-LLinas X. Bauza A. Seth S. K. Frontera A. J. Phys. Chem. A. 2017;121:5371–5376. doi: 10.1021/acs.jpca.7b06052. [DOI] [PubMed] [Google Scholar]
- Garcia-L Linas X. L. Bauza A. A. Seth S. K. Frontera A. J. Phys. Chem. A. 2017;121:5371–5376. doi: 10.1021/acs.jpca.7b06052. [DOI] [PubMed] [Google Scholar]
- Frontera A. Recent Advances in Crystal Engineering and Catalysis. J. Carbon Res. 2020;6:60. [Google Scholar]
- Tsirelson V. G. Stash A. I. Potemkin V. A. Rykounov A. A. Shutalev A. D. Zhurova E. A. Zhurov V. V. Pinkerton A. A. Gurskaya G. V. Zavodnik V. E. Acta Crystallogr., Sect. B: Struct. Sci. 2006;62:676–688. doi: 10.1107/S0108768106016326. [DOI] [PubMed] [Google Scholar]
- Thomas S. P. Pavan M. S. Row T. N. G. Chem. Commun. 2014;50:49–51. doi: 10.1039/c3cc47226d. [DOI] [PubMed] [Google Scholar]
- Varadwaj P. R. Varadwaj A. Jin B.-Y. Phys. Chem. Chem. Phys. 2014;16:17238–17252. doi: 10.1039/c4cp01775g. [DOI] [PubMed] [Google Scholar]
- Li Q.-Z. Zhuo H.-Y. Li H.-B. Liu Z.-B. Li W.-Z. Cheng J.-B. J. Phys. Chem. A. 2015;119:2217–2224. doi: 10.1021/jp503735u. [DOI] [PubMed] [Google Scholar]
- Nziko V. de P. N. Scheiner S. Phys. Chem. Chem. Phys. 2016;18:3581–3590. doi: 10.1039/c5cp07545a. [DOI] [PubMed] [Google Scholar]
- Frisch M. J., Trucks G. W., Schlegel H. B., Scuseria G. E., Robb M. A., Cheeseman J. R., Scalmani G., Barone V., Petersson G. A., Nakatsuji H., Li X., Caricato M., Marenich A. V., Bloino J., Janesko B. G., Gomperts R., Mennucci B., Hratchian H. P., Ortiz J. V., Izmaylov A. F., Sonnenberg J. L., Williams-Young D., Ding F., Lipparini F., Egidi F., Goings J., Peng B., Petrone A., Henderson T., Ranasinghe D., Zakrzewski V. G., Gao J., Rega N., Zheng G., Liang W., Hada M., Ehara M., Toyota K., Fukuda R., Hasegawa J., Ishida M., Nakajima T., Honda Y., Kitao O., Nakai H., Vreven T., Throssell K., Montgomery Jr J. A., Peralta J. E., Ogliaro F., Bearpark M. J., Heyd J. J., Brothers E. N., Kudin K. N., Staroverov V. N., Keith T. A., Kobayashi R., Normand J., Raghavachari K., Rendell A. P., Burant J. C., Iyengar S. S., Tomasi J., Cossi M., Millam J. M., Klene M., Adamo C., Cammi R., Ochterski J. W., Martin R. L., Morokuma K., Farkas O., Foresman J. B., and Fox D. J., Gaussian 16, Revision C.01, Gaussian, Inc., Wallingford CT, 2016 [Google Scholar]
- Grimme S. Antony J. Ehrlich S. Krieg H. J. Chem. Phys. 2010;132:154104. doi: 10.1063/1.3382344. [DOI] [PubMed] [Google Scholar]
- (a) Weigend F. Phys. Chem. Chem. Phys. 2006;8:1057–1065. doi: 10.1039/b515623h. [DOI] [PubMed] [Google Scholar]; (b) Daolio A. Pizzi A. Terraneo G. Urshini M. Frontera A. Resnati G. Angew. Chem., Int. Ed. Engl. 2021;60(26):14385–14389. doi: 10.1002/anie.202104592. [DOI] [PMC free article] [PubMed] [Google Scholar]; (c) Daolio A. Pizzi A. Calabrese M. Terraneo G. Bordignon S. Frontera A. Resnati G. Angew. Chem., Int. Ed. Engl. 2021;60:20723–20727. doi: 10.1002/anie.202107978. [DOI] [PMC free article] [PubMed] [Google Scholar]; (d) Eliseeva A. A. Ivanov D. M. Rozhkov A. V. Ananyev I. V. Frontera A. Kukushkin V. Yu. J. Am. Chem. Soc. 2021;1(3):354–361. doi: 10.1021/jacsau.1c00012. [DOI] [PMC free article] [PubMed] [Google Scholar]; (e) Soldatova N. S. Postnikov P. S. Ivanov D. M. Semyonoy O. V. Kukurima O. S. Guselnikova O. Yamauchi Y. Wirth T. Zhdankin V. V. Yusubov M. S. Gomila R. Frontera A. Resnati G. Kukushkin V. Yu. Chem. Sci. 2022;13:5650–5658. doi: 10.1039/d2sc00892k. [DOI] [PMC free article] [PubMed] [Google Scholar]
- Boys S. F. Bernardi F. Mol. Phys. 1970;19:553–566. [Google Scholar]
- Contreras-García J. Johnson E. R. Keinan S. Chaudret R. Piquemal J.-P. Beratan D. N. Yang W. J. Chem. Theory Comput. 2011;7:625–632. doi: 10.1021/ct100641a. [DOI] [PMC free article] [PubMed] [Google Scholar]
- Johnson E. R. Keinan S. Mori-Sánchez P. Contreras-García J. Cohen A. J. Yang W. J. Am. Chem. Soc. 2010;132:6498–6506. doi: 10.1021/ja100936w. [DOI] [PMC free article] [PubMed] [Google Scholar]
- Keith T. A., AIMAll (Version 13.05.06), TK Gristmill Software, Overland Park, KS, 2013 [Google Scholar]
- Sheldrick G. M., SADABS, a software for empirical absorption correction, Ver.2.05, University of Göttingen, Göttingen, Germany, 2002 [Google Scholar]
- SMART & SAINT Software Reference manuals Version 6.45, Bruker Analytical X-ray Systems, Inc., Madison, WI, 2003 [Google Scholar]
- SHELXTL Reference Manual Ver. 6.1, Bruker Analytical X-ray Systems, Inc., Madison, WI, 2000 [Google Scholar]
- Sheldrick G. M., SHELXTL, a software for empirical absorption correction Ver. 6.12, Bruker AXS Inc., WI, Madison, 2001 [Google Scholar]
- Dolomanov O. V. Bourhis L. J. Gildea R. J. Howard J. A. K. Puschmann H. OLEX2, OLEX2: a complete structure solution, refinement, and analysis program. J. Appl. Crystallogr. 2009;42:339–341. [Google Scholar]
- Das L. K. Biswas A. Frontera A. Ghosh A. Polyhedron. 2013;52:1416–1424. [Google Scholar]
- Maiti M. Thakurta S. Sadhukhan D. Pilet G. Rosair G. M. Nonat A. Charbonniere L. J. Mitra S. Polyhedron. 2013;65:6–15. [Google Scholar]
- Lever A. B. P., Inorganic Spectroscopy, Elsevier, second edn, New York, 1984 [Google Scholar]
- Das L. K. Drew M. G. B. Ghosh A. Inorg. Chim. Acta. 2013;394:247–254. [Google Scholar]
- Mishra D. K. Singha U. K. Das A. Dutta S. Kar P. Chakraborty A. Sen A. Sinha B. J. Coord. Chem. 2018;71:2165–2182. [Google Scholar]
- Sadhukhan D. Ray A. Rosair G. Charbonnière L. Mitra S. Bull. Chem. Soc. Jpn. 2011;84:211–217. [Google Scholar]
- Amirnasr M. Schenk K. J. Salavati M. Dehghanpour S. Taeb A. Tadjarodi A. J. Coord. Chem. 2003;56:231–243. [Google Scholar]
- Sheta S. M. Akl M. A. Saad H. E. EI-Gharkawy E.-S. R. H. RSC Adv. 2020;10:5853–5863. doi: 10.1039/c9ra10133k. [DOI] [PMC free article] [PubMed] [Google Scholar]
- Dolai M. Mistri T. Panja A. Ali M. Inorg. Chim. Acta. 2013;399:95–104. [Google Scholar]
- Kilic E. Bayramgil N. P. Results Chem. 2022;4:100544. [Google Scholar]
- Srivastava A. K. Mondal A. Konar S. Pal S. Dalton Trans. 2022;51:4510–4521. doi: 10.1039/d1dt04086c. [DOI] [PubMed] [Google Scholar]
- Yadav R. Trivedi M. Kociok-Köhn G. Prasad R. Kumar A. CrystEngComm. 2015;17:9175–9184. [Google Scholar]
- Spackman M. A. Jayatilaka D. CrystEngComm. 2009;11:19–32. [Google Scholar]
- McKinnon J. J. Spackman M. A. Mitchell A. S. Acta Crystallogr., Sect. B: Struct. Sci. 2004;60:627–668. doi: 10.1107/S0108768104020300. [DOI] [PubMed] [Google Scholar]
- Turner M. J., McKinnon J. J., Wolff S. K., Grimwood D. J., Spackman P. R., Jayatilaka D., and Spackman M. A., CrystalExplorer, The University of Western Australia, 2017 [Google Scholar]
- Spackman M. A. McKinnon J. J. CrystEngComm. 2002;4:378–392. [Google Scholar]
- Parkin A. Barr G. Dong W. Gilmore C. J. Jayatilaka D. McKinnon J. J. Spackman M. A. Wilson C. C. CrystEngComm. 2007;9:648–652. [Google Scholar]
- Basak T. Roy S. Banerjee S. Gomila R. M. Frontera A. Chattopadhyay S. Polyhedron. 2022;225:116044–116053. [Google Scholar]
- Davidovich R. L. Stavila V. Marinin D. V. Voit E. I. Whitmire K. H. Coord. Chem. Rev. 2009;253:1316–1352. [Google Scholar]
- Gourlaouen C. Parisel O. Gérard H. Dalton Trans. 2011;40:11282–11288. doi: 10.1039/c1dt10604j. [DOI] [PubMed] [Google Scholar]
- Gomila R. M. Frontera A. J. Org. Chem. 2021;954–955:122092. [Google Scholar]
Associated Data
This section collects any data citations, data availability statements, or supplementary materials included in this article.


