Abstract
High-temperature aging has a serious impact on the safety and performance of lithium-ion batteries. This work comprehensively investigates the evolution of heat generation characteristics upon discharging and electrochemical performance and the degradation mechanism during high-temperature aging. Post-mortem characterization analysis revealed that lithium plating is the main degradation mechanism. The occurrence of side reactions leads to cell capacity fading and electrochemical performance degradation. The DC resistance and AC impedance increase significantly, and the severe internal polarization makes the incremental capacity curve shift to lower voltage. In the early aging stage, the cell degrades slightly, and the temperature rise rate has not changed significantly upon discharging. The cell capacity plays a leading role, whose degradation makes the temperature rise decrease. With the aging deepening, the severe cell degradation makes the temperature rise rate increase significantly. Even if the capacity fading, the temperature rise still increases significantly compared to the fresh state. Furthermore, irreversible heat and reversible heat increase significantly with the aging deepening and current rate increasing.
1. Introduction
In the modern era of fossil energy shortage and severe environmental pollution, the energy structure is shifting toward green and sustainable development.1−4 Electric vehicles have developed rapidly with the unique advantages of energy saving and environmental protection under the background.5−7 With the large-scale popularity of electric vehicles, the issues such as range anxiety and long charging time are constantly criticized by consumers.8 In order to alleviate these issues, the energy density has been continuously increased, and the charging power has been continuously improved.9,10 However, it is accompanied by a decline in the safety and stability of lithium-ion batteries.11,12 With the huge base of electric vehicles, electric vehicle fire accidents are becoming more and more frequent.13−17 In particular, the proportion of electric vehicle fire accidents during charging in the hot summer is very high.18 Therefore, it is particularly important to understand the heat generation characteristics of lithium-ion batteries during use in high temperatures.
High temperature not only degrades battery performance but also reduces battery safety. High temperature will accelerate battery capacity degradation. Zhang found that the degradation rate of battery capacity increased approximately 3-fold at a higher temperature (70 °C).19 Xie found that the battery capacity decayed by 38.9% in the initial two charge/discharge cycles at 100 °C.20 Ouyang and Du also found that the battery voltage and capacity decreased seriously and the battery impedance increased significantly under high-temperature conditions.21,22 In addition, Park found that high-temperature conditions had a more pronounced effect on battery power than on battery capacity.23 Ouyang revealed that the severe degradation behavior under high-temperature conditions is caused by lithium inventory loss, anode material loss and electrode interface degradation.24 Sloop found that battery self-discharge is severe at high temperature, and further revealed the mechanism of self-discharge exacerbation.25
Moreover, high temperature also has an impact on the thermal stability of lithium-ion batteries. Tanguchi found that the state of charge (SOC) has the greatest impact on the battery safety during the high-temperature aging.26 The higher the SOC is, the worse the thermal stability is. Ren discovered that high-temperature storage would lead to a decrease in the temperature rise rate and an increase in thermal stability of lithium-ion batteries, while high-temperature cycling would not lead to a change in the thermal stability.27 Abda found that the onset self-heating temperature increased while the thermal runaway triggering temperature decreased after high-temperature aging for lithium iron phosphate batteries.28 Larsson found that the thermal stability of lithium cobalt oxide batteries would not change significantly after high-temperature aging.29 Börner found that the thermal stability of ternary lithium-ion batteries decreased after high-temperature aging.30 It is further revealed that the change in the thermal stability of the solid–electrolyte interphase (SEI) film is the major reason for the change in the onset exothermic temperature.
In addition, some researchers have also studied the effect of aging on the heat generation characteristics of lithium-ion batteries during charging/discharging. Zhang found that the total heat generation decreased while the heat generation rate increased significantly during the discharge process under the fast charge aging path.31 Zhang found that electrical abuse, such as overcharge and overdischarge, could significantly increase the heat generation during charging/discharging.32 Huang found that the larger the charge/discharge rate is, the more the heat generation is.33 Wang investigated lithium titanate batteries and found that the heat generation rate of aged batteries is higher than that of fresh batteries, and the heat generation is greater than that during charging.34
In view of the fact that there are few investigations on the heat generation characteristics of lithium-ion batteries during high-temperature aging and understanding the heat generation characteristics during aging is of great significance for practical applications, to make up for the gaps in current research, this work comprehensively investigates the electrochemical characteristics, heat generation characteristics, and degradation mechanism of lithium-ion batteries during high-temperature aging. The findings can provide a reference for the safe use and protection of lithium-ion batteries and provide a reference for battery safety design.
2. Experimental Section
The test sample is the pouch lithium-ion battery with a rated capacity of 4.2 Ah. The battery mass is about 63 g. The cathode is Li(Ni0.6Co0.2Mn0.2) O2 (NCM622), and the anode is graphite. The battery separator is polypropylene/polyethylene/polypropylene (PP/PE/PP) film which is coated with alumina ceramics. The electrolyte solute is LiPF6, and the electrolyte solvents are ethyl methyl carbonate (EMC), ethylene carbonate (EC), diethyl carbonate (DEC), and propylene carbonate (PC).
2.1. Aging Tests
The test cells are placed into the incubator (BINDER, MK056) and connected to the battery test system (LANHE, CT2001B). First, the standard capacity test is performed at 25 °C. After the test cell is cycled three times, the last discharge capacity is taken as the actual capacity. Afterward, the high-temperature cyclic aging test is performed at 60 °C. After every 20 cycles, a capacity calibration is performed at 25 °C. The test temperature is controlled by the incubator. The specific test profiles are shown in Table 1.
Table 1. Specific Aging Test Profiles.
| Standard
capacity tests | ||||
|---|---|---|---|---|
| Step | State | Condition | Duration | Cut-off values |
| 1 | CC charging | 1.4 A | 4.2 V | |
| 2 | CV charging | 4.2 V | 0.021 A | |
| 3 | Rest | 30 min | ||
| 4 | CC discharging | 1.4 A | 2.5 V | |
| 5 | Rest | 30 min | ||
| 6 | Repeat 1–5, 3 times | |||
| High-temperature
cyclic aging tests | ||||
|---|---|---|---|---|
| Step | State | Condition | Duration | Cut-off values |
| 1 | CC charging | 2.1 A | 4.2 V | |
| 2 | CV charging | 4.2 V | 0.021 A | |
| 3 | Rest | 30 min | ||
| 4 | CC discharging | 2.1 A | 2.5 V | |
| 5 | Rest | 30 min | ||
| 6 | Repeat 1–5, 20 times | |||
2.2. Electrochemical Performance Tests
When the state of health (SOH) of the test cell reaches 100%, 95%, and 90%, the electrochemical performance tests are performed. The electrochemical impedance spectroscopy tests are performed on the test cell in a fully charged state. The equipment used is Solartron Analytical 1470E. The amplitude of sinusoidal current is 0.1A. The test frequency range is 0.01–10 kHz.
Subsequently, the test cell is performed on the hybrid pulse power characteristic (HPPC) test. The fully charged cell rests for 1 h. After that, the cell is charged with constant current (2.1 A) for 10 s. After resting for 60 s, the constant current (2.1 A) discharge for 10 s is performed. Then, the state of charge (SOC) is reduced by 10% by means of constant current discharge (1.4 A). After the cell rests for 1 h, the above test steps are repeated until SOC drops to zero.
After the test cell with different SOH is fully charged, the test cell is discharged with constant current (0.021 A) to obtain the incremental capacity (IC) curves. When the cell voltage reaches 2.5 V, the test ends. The above tests are all carried out at an ambient temperature of 25 °C.
2.3. Heat Generation Tests
The heat generation characteristics of test cells during discharge are tested in the accelerating rate calorimeter (ARC, BTC-130). The test cell is wrapped with a heating wire to adjust the cell temperature. The ARC’s thermocouple is fixed in the cell center to obtain the cell temperature. The wires are connected to the cell tabs and then are led out of the ARC cavity to connect to the battery test system. The test adopts the “Adiabatic” mode, the initial temperature is 30 °C, and the initial calibration time is 90 min to create a great adiabatic environment. Subsequently, the fully charged cell is discharged at a constant current. The current rate is 1/4 C, 1/3 C, 1/2 C, and the cutoff voltage is 2.5 V. When the test cell is aged to different SOH, the above operation is repeated.
2.4. Specific Heat Capacity Test
The heating plate is placed in the middle part of two cells with the same SOH, and they are fixed with the high-temperature resistant insulating tape. The ARC’s thermocouple is fixed between the two cells. The wire of the heating plate is connected to the data collector to obtain the voltage of the heating plate. The initial temperature is set to 30 °C, and after 90 min calibration, the two cells are heated to increase 30 °C. The voltage of the heating plate is obtained during this process.
2.5. Characterization Test
Fully charged cells with 100% and 90% SOH are disassembled in the argon-filled glovebox (MBRAUN-MB-200B-MOD) to obtain the anode and cathode. A small piece of electrode sample is cut off and then placed on the sample stage. The samples are transferred to the scanning electron microscope (SEM, JEOL JSM-7610FPLUS) through a vacuum transfer box to observe the morphology of the samples, and the surface elements of the samples are analyzed by the energy-dispersive spectroscopy (EDS, Genesis Apollo X). Similarly, the samples are transferred to the X-ray photoelectron spectroscopy (XPS, Thermo Scientific KALPHA+) for analysis of the surface composition of the samples.
3. Results and Discussion
3.1. Electrochemical Performances
Figure 1 shows the change of the SOH of the cell with the number of cycles during high-temperature aging, where the SOH is calculated by eq 1. The cell capacity decreases continuously during high-temperature aging. The cell capacity has an approximately linear relationship with the number of cycles, which indicates that the cell capacity decreases approximately linearly.
| 1 |
where Ca is the actual cell capacity, and C0 is the initial cell capacity.
Figure 1.
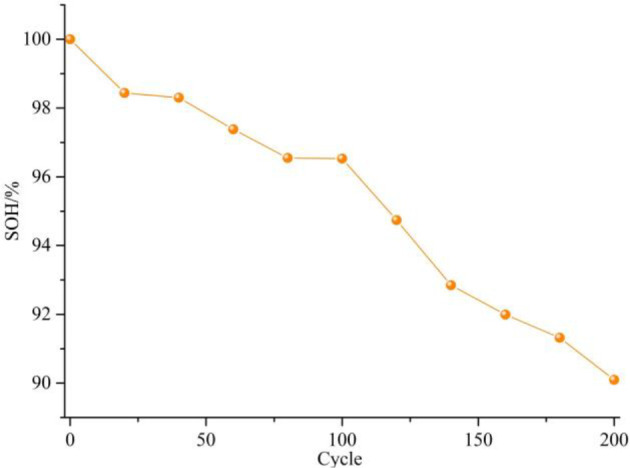
Cell capacity degradation during aging.
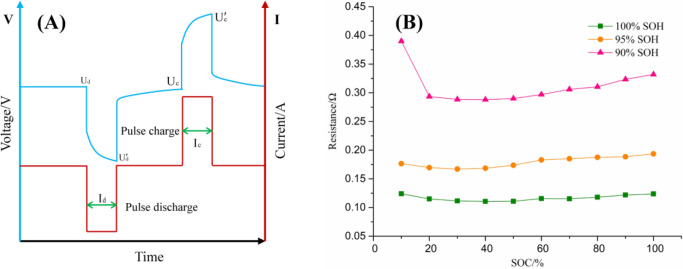
Furthermore, HPPC tests are performed on the test cell when they are aged to different SOHs. During the discharge process, the cell is tested by pulse discharging and pulse charging at intervals of 10% SOC. The corresponding internal resistance acquisition principle is shown in Figure 2A. The internal resistance during pulse charging and pulse discharging is obtained by eqs 2 and 3. In this work, the average value of Rd and Rc is taken as the internal resistance of the cell at different SOCs:
| 2 |
| 3 |
Figure 2.
(A) The acquisition principle of internal resistance. (B) Internal resistance under different SOHs.
Figure 2B displays the change of internal resistance under different SOH. During the discharging process, as the SOC decreases, the internal resistance shows a trend of decreasing and then increasing. As the SOC decreases, the internal resistance decreases continuously, reaching a minimum value at around 40% SOC, and then, as the SOC decreases, the internal resistance continues to increase. As the SOH decreases, the internal resistance shows a significant increase. Moreover, as the cell ages, the internal resistance still shows the trend of first decreasing and then increasing during the discharge process, and this trend of change becomes more and more significant.
Further, EIS tests are performed on the cell under different SOH. The EIS results of the cell at different SOHs and the equivalent circuit used for fitting are shown in Figure 3. The ohmic resistance (Roh) corresponds to the intersection of the EIS plot and the real axis, which represents the resistance encountered by lithium ions when passing the electrolyte, separator, active materials, and so on. The SEI film resistance corresponds to the first arc of the EIS plot, which represents the resistance of the diffusion and migration of lithium ion through the SEI film. The charge-transfer resistance (Rct) corresponds to the second arc, which reflects the charge transfer in the electrochemical reaction. Warburg resistance (Rw) describes the solid diffusion process of lithium ions inside active material particles. The EIS fitting results are shown in Table 2.
Figure 3.
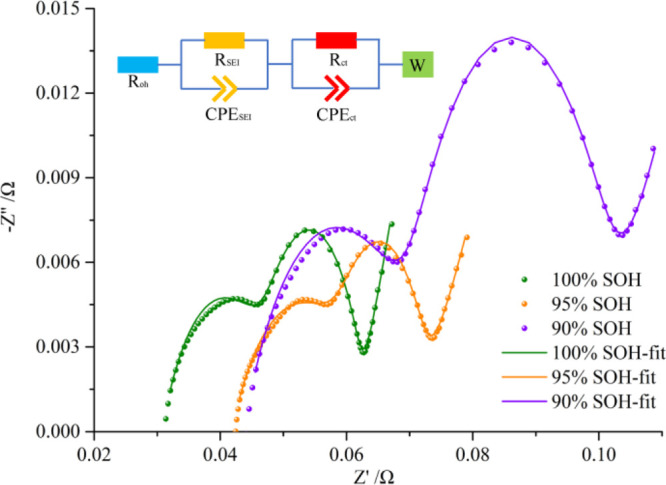
EIS results of the cell under different SOHs.
Table 2. EIS Fitting Results.
| SOH (%) | Roh (Ω) | RSEI (Ω) | Rct (Ω) | Rw (Ω) |
|---|---|---|---|---|
| 100 | 0.0308 | 0.0171 | 0.0136 | 0.0041 |
| 95 | 0.0418 | 0.0192 | 0.0106 | 0.0057 |
| 90 | 0.0437 | 0.0275 | 0.0289 | 0.0057 |
With the cell aging, the EIS plot moves to the right, and the ohmic resistance increases, which is the same trend as the internal resistance. This is mainly caused by the increased internal polarization with aging. The first and second arcs also become significantly larger with aging, which means that the SEI film resistance and charge-transfer resistance increase significantly with aging. When the cell degrades to 90% SOH, the SEI film resistance and charge-transfer resistance are approximately doubled. Under high-temperature conditions, the electrolyte will decompose, resulting in the gas generation. The electrolyte consumption will cause the anode to dry up locally, and the gas will affect the distance between the electrodes, which leads to local current nonuniformity. Therefore, in the subsequent charging process, lithium plating will occur. The plated metallic lithium will react with the electrolyte to thicken the SEI film and affect the transfer of charges. This makes the SEI film resistance and charge-transfer resistance increase significantly with aging. In addition, high-temperature aging makes the diffusion of lithium ions in the active material particles difficult, resulting in increased Warburg resistance.
Furthermore, IC curves of the cell under different SOHs are shown in Figure 4 to further analyze the effect of high-temperature aging on cell degradation. Two distinct characteristic peaks appear in Figure 4. With the cell aging, the characteristic peaks gradually shift to lower voltages, which is mainly caused by the increased polarization of the cell caused by high-temperature aging. In addition, the area of the IC curve decreases with aging, which is mainly due to the loss of active materials and loss of lithium inventory. Combined with the EIS results, the loss of lithium inventory is mainly caused by lithium plating, while the loss of active materials is mainly caused by the SEI film thickening and electrolyte decomposition.
Figure 4.
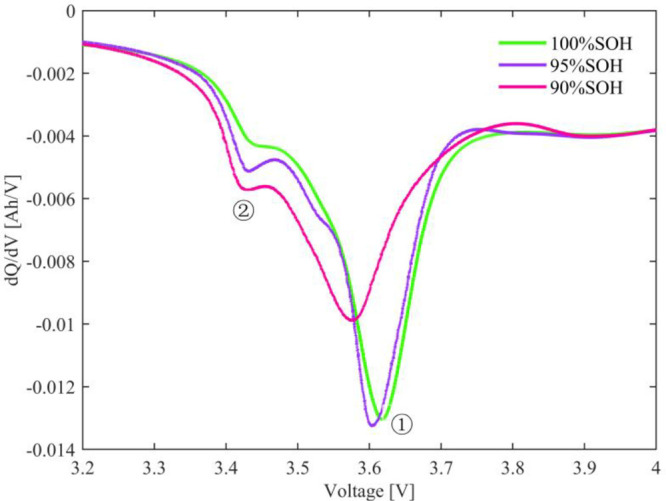
Incremental capacity curves of the cell under different SOH.
3.2. Heat Generation Characteristics
Under adiabatic conditions, the heat generated by the test cell can be continuously accumulated during the constant current discharge process, which makes the cell temperature increase continuously. In this work, the cell temperature rises, and temperature rise rates during the discharge process of the test cell at different current rates and SOHs are displayed in Figures 5 and 6, respectively. The temperature rise is also shown in the Table 3.
Figure 5.
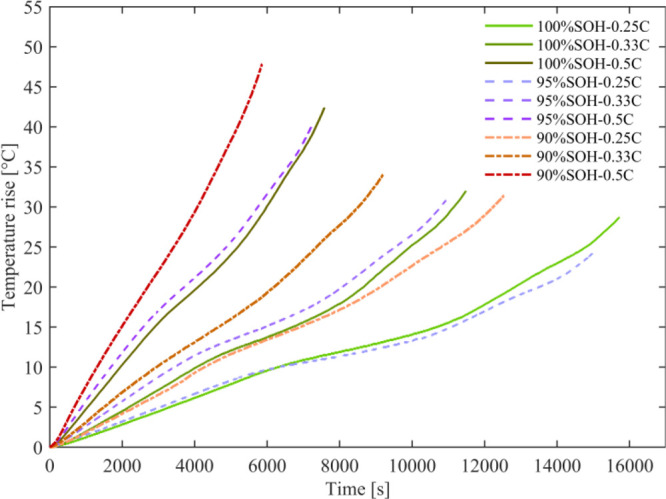
Heat generation at different current rates and SOHs.
Figure 6.
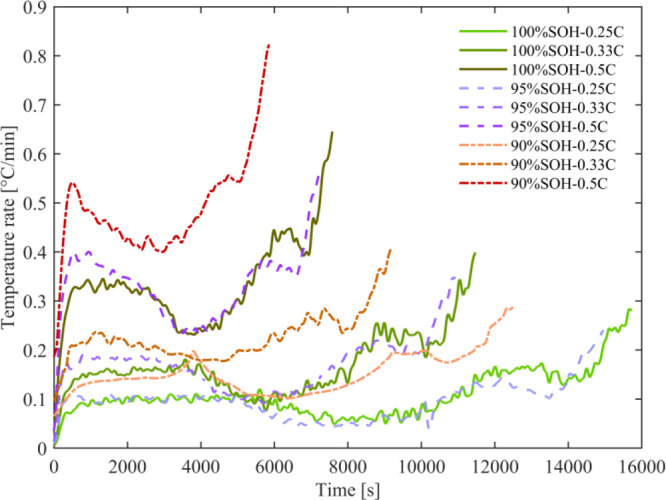
Heat generation rates at different current rates and SOHs.
Table 3. Temperature Rise of the Cell at Different Current Rates and SOHs.
| SOH (%) | 0.25C (°C) | 0.33C (°C) | 0.5C (°C) |
|---|---|---|---|
| 100 | 28.7 | 32 | 42.4 |
| 95 | 24.2 | 30.8 | 40.3 |
| 90 | 31.4 | 34 | 47.8 |
During the constant current discharge process, the change of the cell temperature is nonlinear. The cell temperature changes with the SOC. Under the same SOH, with the current rate increase, the discharge time is shortened, and the temperature rise increases during the whole discharge process. For example, the fresh cell temperature increases by 28.7 °C at the current rate of 0.25C and 42.4 °C at the current rate of 0.5C. At the same current rate, with the cell aging, the temperature rise during the discharge process first decreases and then increases. Moreover, this change trend is more significant with the current rate increasing. Besides, with the cell aging, the larger the current rate is, the more serious the effect on the heat generation is. For the fresh state, the cell temperature increases by 13.7 °C during discharge at 0.5C than during discharge at 0.25C. When the cell has aged to 90% SOH, the cell temperature increases by 16.4 °C during the discharge at 0.5C than during the discharge at 0.25C.
Figure 6 shows the cell temperature rise rate during discharge as a function of time. It can be found that the temperature rise rate fluctuates during the discharge process. In the initial discharge stage, the temperature rise rate increases rapidly. In the subsequent process, with the decrease of SOC, the temperature rise rate shows the trend of first decreasing and then increasing. At the end of discharge, the temperature rise rate increases significantly, which means that the cell temperature increases significantly. Figure 6 shows that when the cell is aged to 95% SOH, the temperature rise rate has not changed significantly compared with the fresh state. However, due to the decrease in cell capacity, the cell temperature rise decreases during the entire discharge process. With further aging, it can be found that the temperature rise rate increases significantly; even if the cell capacity decreases, the temperature rise rate plays a dominant role at this time. Therefore, the cell temperature increases significantly during the entire discharge process. Moreover, as the current rate increases, this phenomenon becomes more pronounced.
Furthermore, further analysis of the heat sources of the test cell during adiabatic discharge is performed. The heat generated by the cell is mainly composed of two parts, the irreversible heat generated by internal resistance and the reversible heat generated by the internal reversible chemical reaction, as shown in eq 4:
| 4 |
where Q is the total heat, Qr is the reversible heat, and Qi is the irreversible heat.
The cell heat obtained during discharging in the ARC is the total heat. The irreversible heat can be obtained by eq 5. The used internal resistance of the cell has been obtained by HPPC. Therefore, the reversible heat of the cell can be obtained by eq 6:
| 5 |
| 6 |
Given that the cell temperature is obtained in ARC, the heat generated by the cell needs to be calculated, as shown in eq 7:
| 7 |
where Cp is the specific heat capacity, M is the cell mass, and ΔT is the temperature rise.
To calculate the heat generation of the cell, it is necessary to obtain the specific heat capacity of the cell under different SOHs. Due to the adiabatic test condition, the heat applied to the cell can be completely absorbed by the cell. The heat applied to the cell can be calculated from eq 8. Furthermore, the specific heat capacity of the cell under different SOHs can be calculated by eq 9:
| 8 |
| 9 |
where Qh is the heat generated by the heating plate, U is the voltage of the heating plate, Rh is the resistance of the heating plate, and t is the heating time.
Therefore, the specific heat capacity of the cell when the SOH is 100%, 95%, and 90% is calculated to be 1.1352 J/(g·°C), 1.1522 J/(g·°C), and 1.2087 J/(g·°C), respectively.
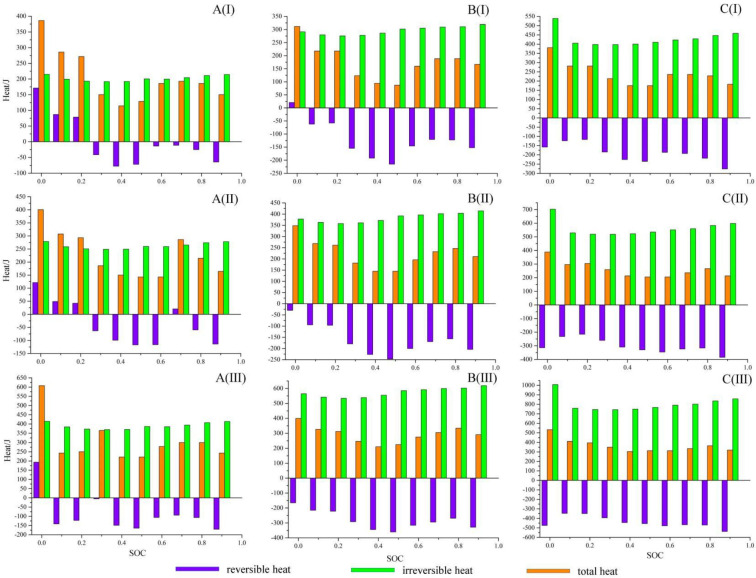
Figure 7 shows the changes of total heat, reversible heat, and irreversible heat of the cell at different SOHs and current rates. During the discharge process, the cell generates less heat at the midrange SOC, which corresponds to a lower temperature rise rate. At the beginning and end of discharge, the cell generates more heat, corresponding to a higher temperature rise rate. Under different SOHs and current rates, the heat generation of the test cell during discharge exhibits similar changes.
Figure 7.
Determined total heat generation, reversible heat generation and irreversible heat generation at different current rates and SOHs: (A) 100% SOH, (B) 95% SOH, and (C) 90% SOH; (I) 0.25C, (II) 0.33C, and (III) 0.5C.
For fresh cells, the heat generation is lower. Due to the small internal resistance, the generation of irreversible heat is low, which indicates that the internal chemical reaction is not violent and the heat is generated less. As the current rate increases, the heat generation increases. At the same time, irreversible heat and reversible heat has also increased significantly. At a larger current rate, the internal endothermic chemical reaction can be stimulated to a greater extent, which can offset partial irreversible heat generated by internal resistance. Therefore, the total heat exhibited by the cell to the outside is lower than that the irreversible heat.
With the cell aging, the irreversible heat increases significantly at the same current rate, and the reversible heat changes relatively slowly, but also increases. This means that aging intensifies chemical reactions inside the cell. The effect of aging on irreversible heat and reversible heat is more significant with the increase in current rate. The reversible and irreversible heat generation of the cell during the discharge process is much more significant at the current rate of 0.5C than at the current rate of 0.25C.
3.3. Degradation Mechanism
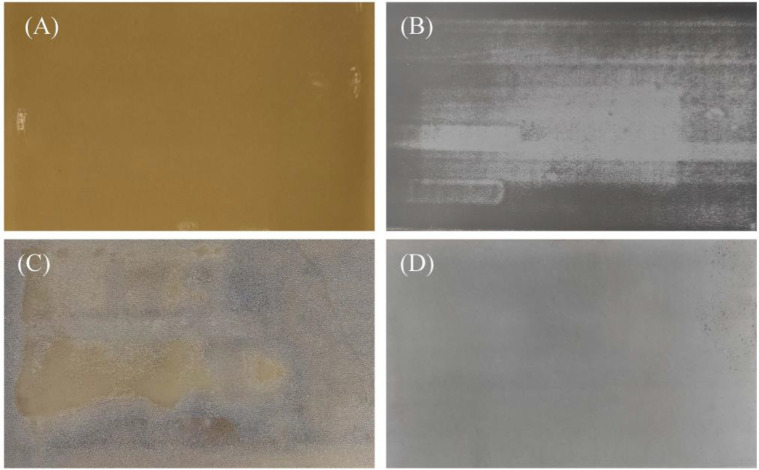
To further elucidate the effect of high temperature on the cell, the cell is further disassembled and characterized to investigate the cell degradation mechanism. To avoid the interference of external factors, the fully charged cells are disassembled in an argon-filled glovebox to obtain the anode and cathode. The appearances of the fresh and aged electrodes are shown in Figure 8. Fresh anode surface is smooth and flat, showing a uniform golden yellow color. However, the aged anode exhibits an uneven gray color, and the anode surface is covered with a layer of white substance. In comparison, the change of the cathode is smaller. After aging, the appearance of the cathode has not changed significantly, except that the color changed from black to gray.
Figure 8.
Electrode appearances: (A) fresh anode, (B) fresh cathode, (C) aged anode, and (D) aged cathode.
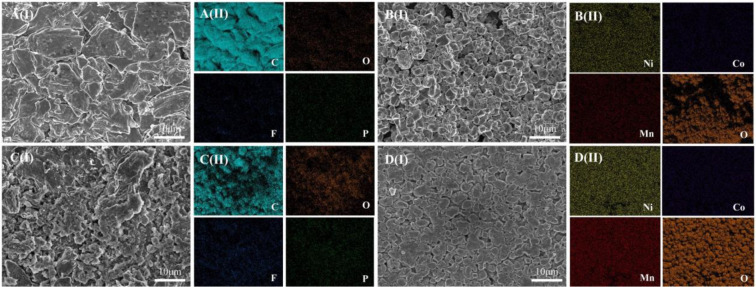
Further, SEM and EDS tests are performed on the electrode samples, and the test results are shown in Figure 9. The graphite particles of fresh anode are clearly visible and smooth, not covered by other substances. In contrast, the graphite particles of the aged anode are covered with a layer of white substance, and partial graphite particles could not be observed due to the covering. Furthermore, EDS analysis is performed on the fresh anode and aged anode. It can be found that carbon is the main constituent element of the anode and plays a dominant role. The carbon content of fresh anode is very high, while the content of other elements is so low that it is barely visible, as shown in Figure 9A(II). In contrast, the carbon content in the aged anode is significantly reduced and the oxygen content is significantly increased, as shown in Figure 9C(II). This is mainly caused by the electrolyte decomposition during high-temperature aging, resulting in gas generation and local drying of the electrodes. This will make the local current between the electrodes uneven during the recharging process, resulting in the occurrence of lithium plating. The plated metallic lithium has great reactivity and can react with the electrolyte to form organic lithium salts and inorganic lithium salts. The generated reactant coats the graphite particle surface, which is what is observed as the white substance. The oxygen content in the by-reaction products is high, which is why the oxygen content in the aged anode is significantly increased in the EDS test.
Figure 9.
SEM and EDS test results of fresh and aged electrodes: (A) fresh anode, (B) fresh cathode, (C) aged anode, and (D) aged cathode; (I) SEM and (II) EDS.
In contrast, high-temperature aging has little effect on the morphology of the cathode. The cathode surface is slightly powdered during high-temperature aging. Further, the element content of the cathode surface has not changed significantly by further analysis by EDS. However, the presence of small amounts of transition metals is detected on the anode surface, which indicates that the transition metal dissolves during high-temperature aging. The dissolution of transition metals is also a key factor leading to cell degradation.
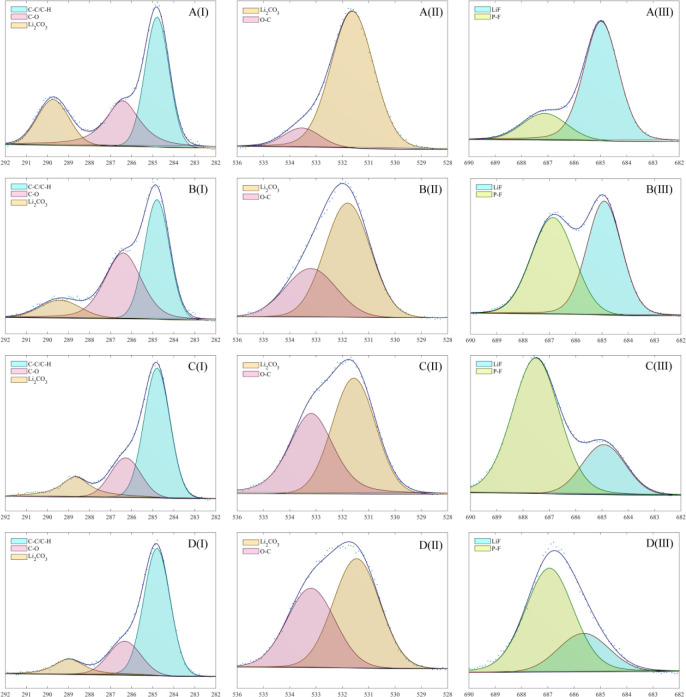
Further, XPS tests are performed on fresh and aged electrodes to analyze the effect of high-temperature aging on the cell composition. The test results are shown in Figure 10. The peaks of C–C/C–H, C–O, and Li2CO3 are located at 284.8, 286.2, and 289.7 eV in the C 1s spectrum, respectively. The peaks of O–C and Li2CO3 are located at 531.5 and 533.3 eV in the O 1s spectrum, respectively. The peaks of LiF and P–F are located at 685 and 687.1 eV in the F 1s spectrum, respectively.
Figure 10.
XPS results of fresh and aged electrodes: (A) fresh anode, (B) aged anode, (C) fresh cathode, and (D) aged cathode; (I) C 1s, (II) O 1s, and (III) F 1s.
By comparing the XPS test results of fresh and aged anodes, it can be found that the ratio of the C–C/C–H and C–O increases on the aged anode compared to the fresh anode. This indicates that high-temperature aging causes an increase in the organic components on the anode surface. At the same time, an increase in the ratio of O–C content in the aged anode compared to fresh anode is also observed in the O 1s spectrum. This shows that the SEI film of the anode is thickened due to lithium plating during high-temperature aging. Furthermore, the proportion of organic components in the SEI film is increased, and the proportion of inorganic components is decreased. In addition, the presence of LiF is also detected, and the content of LiF has not changed significantly, which means that LiF is always generated in the side reaction. In contrast, comparing the XPS test results of fresh and aged cathodes, it can be found that the content and ratio of each component have not changed significantly, which indicates that high-temperature aging has little effect on the cathode surface components.
3.4. Discussion
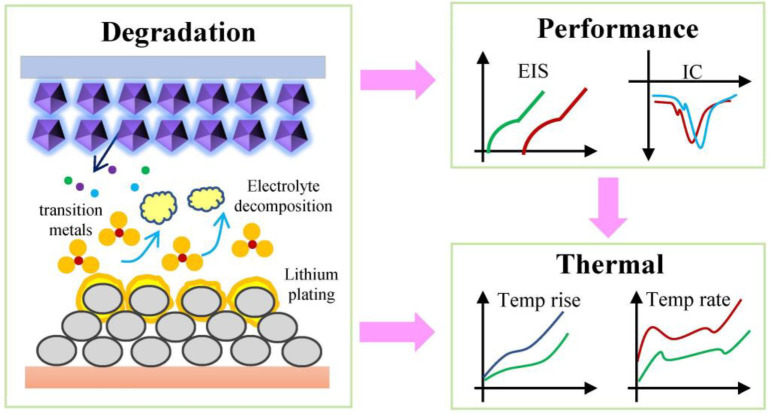
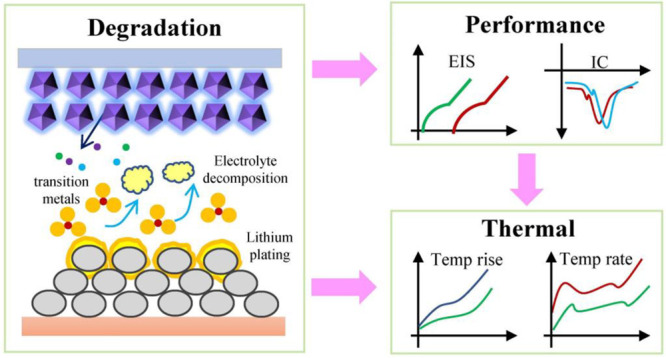
High-temperature aging can cause the cell to degrade, resulting in the deterioration of the electrochemical performance of the cell, and further affecting the heat generation characteristics. The relationship between the three is shown in Figure 11. During high-temperature aging, the electrolyte will decompose, resulting in gas generation and local electrolyte drying. The generated gas will change the distance between the electrodes, and the local electrolyte drying will cause the local potential to change. Therefore, when recharging, the local current on the electrode will be nonuniform, thus resulting in lithium plating. The plated metallic lithium has great reactivity and can react with the electrolyte to form side reactions, which are coated on the graphite particles, resulting in the thickening of the SEI film. At the same time, the decomposition products of the electrolyte also contribute to the thickening of the SEI film. In addition, the transition metal of the cathode will dissolve during the high-temperature aging. The dissolution of the transition metal will aggravate the occurrence of side reactions, resulting in further deterioration of the cell performance.
Figure 11.
Relationship between degradation mechanism, electrochemical performance, and heat generation characteristics.
The occurrence of side reactions leads to the cell degradation during the high-temperature cycling, which not only leads to the cell capacity fading but also results in the degradation of the electrochemical performance. Degradation causes severe internal polarization of the cell, causing the IC curve to shift toward lower voltages. At the same time, severe degradation results in a significant increase in both the DC resistance and the AC impedance. The increase in DC resistance during high-temperature aging causes a significant increase in the irreversible heat during the adiabatic discharging. Moreover, the irreversible heat becomes more pronounced as the current rate increases. At the same time, the increase of the current rate will also stimulate the internal chemical reaction of the cell, resulting in an increase in reversible heat. Since the internal degradation of the cell is not severe in the early stage of aging, the heat generation characteristics have not changed much during the discharge process. At this time, due to the capacity fading, the heat generation of the cell during the discharge process decreases. With further aging, the cell degradation intensifies, causing the cell to heat up at a higher rate during the discharge process. At this time, the temperature rise rate plays a leading role. Although the cell capacity decreases, the temperature rise increases significantly.
4. Conclusion
This work comprehensively investigates the heat generation characteristics upon discharging, electrochemical performance and degradation mechanism of lithium-ion batteries during high-temperature aging, and clarifies the relationship between the three. High temperature causes severe degradation. Through disassembly analysis and multiple characterizations including SEM, EDS and XPS, it is revealed that side reactions including electrolyte decomposition, lithium plating, and transition-metal dissolution are the major degradation mechanism of lithium-ion batteries during high-temperature aging. The occurrence of side reactions not only leads to cell capacity fading but also results in severe electrochemical performance degradation. With aging, the DC resistance and AC impedance increase significantly. The internal polarization is severe, which makes the IC curve shift toward lower voltage. Cell degradation and electrochemical performance degradation further leads to the changes in heat generation characteristics. In the early stage of aging, the slight degradation has little effect on the heat generation characteristics. At this time, the cell capacity plays a leading role. Capacity fading causes the cell to generate less heat. With the deepening of the aging degree, the severe degradation causes the cell temperature rise rate to increase significantly. The temperature rise rate dominates, and the temperature rise remains high even with capacity fading. In addition, by analyzing the heat sources, as the aging deepens and the current rate increases, the electrochemical reactions inside the cell intensify. Thus, the irreversible heat and reversible heat increase significantly with aging and increasing current rate.
Acknowledgments
The authors sincerely acknowledge the Project of Science and Technology for Social Development of Shanghai Municipal Commission of Science and Technology (20DZ1205500) for the support of this work.
The authors declare no competing financial interest.
References
- Ogunfuye S.; Sezer H.; Said A. O.; Simeoni A.; Akkerman V. y An analysis of gas-induced explosions in vented enclosures in lithium-ion batteries. J. Energy Storage 2022, 51, 104438. 10.1016/j.est.2022.104438. [DOI] [Google Scholar]
- Feng J.-C.; Yan J.; Yu Z.; Zeng X.; Xu W. Case study of an industrial park toward zero carbon emission. Appl. Energy 2018, 209, 65–78. 10.1016/j.apenergy.2017.10.069. [DOI] [Google Scholar]
- Zhu X.; Meng F.; Zhang Q.; Xue L.; Zhu H.; Lan S.; Liu Q.; Zhao J.; Zhuang Y.; Guo Q.; Liu B.; Gu L.; Lu X.; Ren Y.; Xia H. LiMnO2 cathode stabilized by interfacial orbital ordering for sustainable lithium-ion batteries. Nat. Sustain. 2021, 4, 392–401. 10.1038/s41893-020-00660-9. [DOI] [Google Scholar]
- Xue L.; Zhang Q.; Huang Y.; Zhu H.; Xu L.; Guo S.; Zhu X.; Liu H.; Huang Y.; Huang J.; Lu L.; Zhang S.; Gu L.; Liu Q.; Zhu J.; Xia H. Stabilizing Layered Structure in Aqueous Electrolyte via Dynamic Water Intercalation/Deintercalation. Adv. Mater. 2022, 34, 2108541. 10.1002/adma.202108541. [DOI] [PubMed] [Google Scholar]
- Zhang G.; Wei X.; Han G.; Dai H.; Zhu J.; Wang X.; Tang X.; Ye J. Lithium plating on the anode for lithium-ion batteries during long-term low temperature cycling. J. Power Sources 2021, 484, 229312. 10.1016/j.jpowsour.2020.229312. [DOI] [Google Scholar]
- Zhang G.; Wei X.; Chen S.; Zhu J.; Han G.; Dai H. Unlocking the thermal safety evolution of lithium-ion batteries under shallow over-discharge. J. Power Sources 2022, 521, 230990. 10.1016/j.jpowsour.2022.230990. [DOI] [Google Scholar]
- Chen S.; Zhang G.; Wu C.; Huang W.; Xu C.; Jin C.; Wu Y.; Jiang Z.; Dai H.; Feng X.; Wei X.; Ouyang M. Multi-objective optimization design for a double-direction liquid heating system-based Cell-to-Chassis battery module. Int. J. Heat Mass Transfer 2022, 183, 122184. 10.1016/j.ijheatmasstransfer.2021.122184. [DOI] [Google Scholar]
- Han X.; Lu L.; Zheng Y.; Feng X.; Li Z.; Li J.; Ouyang M. A review on the key issues of the lithium ion battery degradation among the whole life cycle. eTransportation 2019, 1, 100005. 10.1016/j.etran.2019.100005. [DOI] [Google Scholar]
- Choi J. W.; Aurbach D. Promise and reality of post-lithium-ion batteries with high energy densities. Nat. Rev. Mater. 2016, 1, 16013. 10.1038/natrevmats.2016.13. [DOI] [Google Scholar]
- Tomaszewska A.; Chu Z.; Feng X.; O’Kane S.; Liu X.; Chen J.; Ji C.; Endler E.; Li R.; Liu L.; Li Y.; Zheng S.; Vetterlein S.; Gao M.; Du J.; Parkes M.; Ouyang M.; Marinescu M.; Offer G.; Wu B. Lithium-ion battery fast charging: A review. eTransportation 2019, 1, 100011. 10.1016/j.etran.2019.100011. [DOI] [Google Scholar]
- Nam G. W.; Park N.-Y.; Park K.-J.; Yang J.; Liu J.; Yoon C. S.; Sun Y.-K. Capacity Fading of Ni-Rich NCA Cathodes: Effect of Microcracking Extent. ACS Energy Lett. 2019, 4, 2995–3001. 10.1021/acsenergylett.9b02302. [DOI] [Google Scholar]
- Noh H.-J.; Youn S.; Yoon C. S.; Sun Y.-K. Comparison of the structural and electrochemical properties of layered Li[NixCoyMnz]O2 (x = 1/3, 0.5, 0.6, 0.7, 0.8 and 0.85) cathode material for lithium-ion batteries. J. Power Sources 2013, 233, 121–30. 10.1016/j.jpowsour.2013.01.063. [DOI] [Google Scholar]
- Zhang G.; Wei X.; Tang X.; Zhu J.; Chen S.; Dai H. Internal short circuit mechanisms, experimental approaches and detection methods of lithium-ion batteries for electric vehicles: A review. Renew. Sust. Energy Rev. 2021, 141, 110790. 10.1016/j.rser.2021.110790. [DOI] [Google Scholar]
- Feng X.; Ouyang M.; Liu X.; Lu L.; Xia Y.; He X. Thermal runaway mechanism of lithium ion battery for electric vehicles: A review. Energy Storage Mater. 2018, 10, 246–67. 10.1016/j.ensm.2017.05.013. [DOI] [Google Scholar]
- Li S.; Wang K.; Zhang G.; Li S.; Xu Y.; Zhang X.; Zhang X.; Zheng S.; Sun X.; Ma Y. Fast Charging Anode Materials for Lithium-Ion Batteries: Current Status and Perspectives. Adv. Funct. Mater. 2022, 32, 2200796. 10.1002/adfm.202200796. [DOI] [Google Scholar]
- Lebrouhi B. E.; Khattari Y.; Lamrani B.; Maaroufi M.; Zeraouli Y.; Kousksou T. Key challenges for a large-scale development of battery electric vehicles: A comprehensive review. J. Energy Storage 2021, 44, 103273. 10.1016/j.est.2021.103273. [DOI] [Google Scholar]
- Sun P.; Bisschop R.; Niu H.; Huang X. A Review of Battery Fires in Electric Vehicles. Fire Technol. 2020, 56, 1361–410. 10.1007/s10694-019-00944-3. [DOI] [Google Scholar]
- Chen Z.; Xiong R.; Sun F. Research Status and Analysis for Battery Safety Accidents in Electric Vehicles. J Mech. Eng. 2019, 55, 93–104. 10.3901/JME.2019.24.093. [DOI] [Google Scholar]
- Zhang L.; Liu J.; Du L.; Fan P.; Xu X.; Ma Y.; Zuo P.; Qu B.; Yin G.; Fu Q. LiNi0.5Co0.2Mn0.3O2/graphite batteries storing at high temperature: Capacity fading and raveling of aging mechanisms. J. Power Sources 2021, 496, 229858. 10.1016/j.jpowsour.2021.229858. [DOI] [Google Scholar]
- Xie X.; Wang L.; Feng X.; Ren D.; He X. High-temperature Aging Behavior of Commercial Li-Ion Batteries. Int. J. Electrochem. Sci. 2020, 15, 4586–91. 10.20964/2020.05.71. [DOI] [Google Scholar]
- Ouyang D.; Weng J.; Chen M.; Wang J. Impact of high-temperature environment on the optimal cycle rate of lithium-ion battery. J. Energy Storage 2020, 28, 101242. 10.1016/j.est.2020.101242. [DOI] [Google Scholar]
- Du Y.; Fujita K.; Shironita S.; Sone Y.; Hosono E.; Asakura D.; Umeda M. Capacity fade characteristics of nickel-based lithium-ion secondary battery after calendar deterioration at 80 °C. J.Power Sources 2021, 501, 230005. 10.1016/j.jpowsour.2021.230005. [DOI] [Google Scholar]
- Park S. H.; Park J.; Ryou M.-H.; Lee Y. M. Sensitivity of power of lithium-ion batteries to temperature: A case study using cylindrical- and pouch-type cells. J. Power Sources 2020, 465, 228238. 10.1016/j.jpowsour.2020.228238. [DOI] [Google Scholar]
- Ouyang D.; Weng J.; Chen M.; Wang J.; Wang Z. Electrochemical and thermal characteristics of aging lithium-ion cells after long-term cycling at abusive-temperature environments. Process Saf. Environ. Protect. 2022, 159, 1215–23. 10.1016/j.psep.2022.01.055. [DOI] [Google Scholar]
- Sloop S. E.; Kerr J. B.; Kinoshita K. The role of Li-ion battery electrolyte reactivity in performance decline and self-discharge. J. Power Sources 2003, 119–121, 330–7. 10.1016/S0378-7753(03)00149-6. [DOI] [Google Scholar]
- Taniguchi S.; Shironita S.; Konakawa K.; Mendoza-Hernandez O. S.; Sone Y.; Umeda M. Thermal characteristics of 80 °C storage-degraded 18650-type lithium-ion secondary cells. J. Power Sources 2019, 416, 148–54. 10.1016/j.jpowsour.2019.01.087. [DOI] [Google Scholar]
- Ren D.; Hsu H.; Li R.; Feng X.; Guo D.; Han X.; Lu L.; He X.; Gao S.; Hou J.; Li Y.; Wang Y.; Ouyang M. A comparative investigation of aging effects on thermal runaway behavior of lithium-ion batteries. eTransportation 2019, 2, 100034. 10.1016/j.etran.2019.100034. [DOI] [Google Scholar]
- Abada S.; Petit M.; Lecocq A.; Marlair G.; Sauvant-Moynot V.; Huet F. Combined experimental and modeling approaches of the thermal runaway of fresh and aged lithium-ion batteries. J. Power Sources 2018, 399, 264–73. 10.1016/j.jpowsour.2018.07.094. [DOI] [Google Scholar]
- Larsson F.; Bertilsson S.; Furlani M.; Albinsson I.; Mellander B.-E. Gas explosions and thermal runaways during external heating abuse of commercial lithium-ion graphite-LiCoO2 cells at different levels of ageing. J. Power Sources 2018, 373, 220–31. 10.1016/j.jpowsour.2017.10.085. [DOI] [Google Scholar]
- Börner M.; Friesen A.; Grützke M.; Stenzel Y. P.; Brunklaus G.; Haetge J.; Nowak S.; Schappacher F. M.; Winter M. Correlation of aging and thermal stability of commercial 18650-type lithium ion batteries. J. Power Sources 2017, 342, 382–92. 10.1016/j.jpowsour.2016.12.041. [DOI] [Google Scholar]
- Zhang G.; Wei X.; Chen S.; Zhu J.; Han G.; Wang X.; Dai H. Revealing the Impact of Fast Charge Cycling on the Thermal Safety of Lithium-Ion Batteries. ACS Appl. Energy Mater. 2022, 5, 7056–68. 10.1021/acsaem.2c00688. [DOI] [Google Scholar]
- Zhang G.; Wei X.; Chen S.; Zhu J.; Han G.; Dai H. Revealing the Impact of Slight Electrical Abuse on the Thermal Safety Characteristics for Lithium-Ion Batteries. ACS Appl. Energy Mater. 2021, 4, 12858–70. 10.1021/acsaem.1c02537. [DOI] [Google Scholar]
- Huang L.; Xu G.; Du X.; Li J.; Xie B.; Liu H.; Han P.; Dong S.; Cui G.; Chen L. Uncovering LiH Triggered Thermal Runaway Mechanism of a High-Energy LiNi0.5Co0.2Mn0.3O2/Graphite Pouch Cell. Adv. Sci. 2021, 8, 2100676. 10.1002/advs.202100676. [DOI] [PMC free article] [PubMed] [Google Scholar]
- Wang K.; Gao F.; Zhu Y.; Liu H.; Qi C.; Yang K.; Jiao Q. Internal resistance and heat generation of soft package Li4Ti5O12 battery during charge and discharge. Energy 2018, 149, 364–74. 10.1016/j.energy.2018.02.052. [DOI] [Google Scholar]


