Abstract
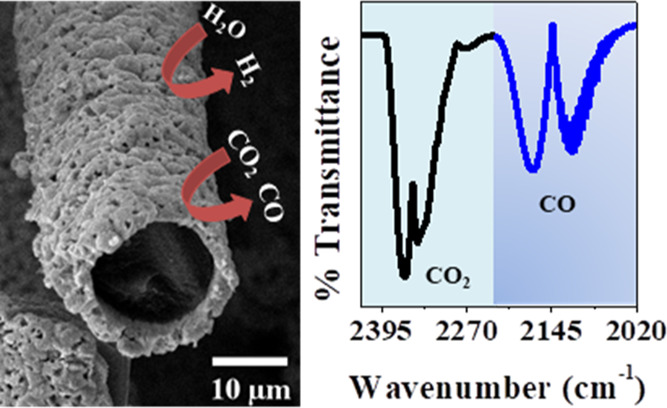
Obtaining CO and H2 from electrochemical CO2 reduction (CO2RR) offers a viable alternative to reduce CO2 emissions and produce chemicals and fuels. Herein, we report a simple strategy for obtaining polycrystalline copper deposited on oxidized graphite felt (Cu-OGF) and its performance on the selective conversion of CO2 and H2O to CO and H2. For the electrode obtaining, graphite felt (GF) was first oxidized (OGF) in order to make the substrate hydrophilic and then copper particles were electrochemically deposited onto OGF. The pH of deposition was investigated, and the CO2RR activity was assessed for the prepared electrodes at each pH (2.0, 4.0, 6.0, 8.0, and 10.0). It was found that pH 2.0 was the most promising for CO2RR due to the presence of hexagonal copper microparticles. Fourier transform infrared analysis of the produced gases showed that this is a low-cost catalyst capable of reducing CO2 and H2O to CO and H2, with Faradaic efficiencies between 0.50 and 5.21% for CO and 50.87 to 98.30% for H2, depending on the experimental conditions. Hence, it is possible for this gas mixture to be used as a fuel gas or to be enriched with CO for use in Fischer–Tropsch processes.
1. Introduction
In the search for renewable energy sources, electrochemical energy conversion has emerged as a promising alternative to the use of fossil fuels.1 In this sense, the CO2 reduction reaction (CO2RR) emerges as an excellent alternative because it can provide sustainable fuel production.2 As a widely available and inexpensive metal, copper has been extensively studied as the catalyst for CO2RR. An additional feature is the obtention of several fuels, such as hydrogen, methane, ethylene, ethanol, and methanol.3 However, the costs associated with the separation of these and other CO2RR products make it difficult to implement this technology.4
In the electrochemical reduction of CO2, H2 is inevitably obtained as a byproduct from the competitive hydrogen evolution reaction (HER).5,6 It is, therefore, possible to obtain syngas (a mixture composed of 30–60% CO, 25–30% H2, and 5–15% CO27), which has aroused interest due to the wide range of possible applications.8 For example, syngas can be used for the synthesis of chemicals and synthetic fuels through well-established industrial processes.5,9 According to the H2/CO molar ratio, syngas is targeted for specific applications. For instance, an H2/CO ratio of 2:1 to 3:1 is ideal for methanol production, an H2/CO ratio of 0.25:1 is favorable for ethanol production, and an H2/CO ratio of 2:1 is suitable for Fischer–Tropsch processes.6,10−12
Aiming for an efficiency increase in syngas production by copper electrodes, several strategies have been developed. Reske and co-workers studied the effect of Cu nanoparticle (NP) size on the catalytic activity and selectivity for CO2RR. They reported a dramatic increase in selectivity for CO and H2 for NPs below 5 nm.13 The use of different morphologies has also been proposed. Wang and co-workers reported the use of copper nanowire arrays and obtained a tunable H2/CO ratio according to the applied potential.9 Grosse and collaborators studied nanocubic Cu and the effect of the supporting materials, such as copper and carbon. The results showed higher Faradaic efficiency (FE) for CO in copper nanocubes supported on carbon.14 Another method that has been shown to increase CO production is etching copper single-crystal surfaces.15 However, among the cited works, only copper nanowire arrays produced only H2 and CO as gaseous products.9 For this reason, the combination of copper with other materials has been studied, such as Cu/Ni(OH)2,16 Cu/In2O3,5 Cu/SnO2,17 Cu/In,18,19 Cu/Ag,20 Cu/Pd,21 and Cu/Au.22 Modifications in the electrochemical measurements have also been shown to be effective for increasing the FE of CO2RR on copper materials, such as the use of pulsed electrolysis. Engelbrecht and co-workers reported suppression of HER, achieving 10% FE,23 while Kumar and colleagues showed high selectivity for syngas by suppressing the side reactions.24
NPs and single crystals are important for understanding the mechanisms involved in CO2RR but are limited in their applicability. However, electrodeposited copper offers excellent applicability as it can be obtained with the desired geometric area. Also, it is a low-cost and simple operation process.25,26 As a support material for electrodeposition, graphite felt (GF) has some outstanding properties, such as chemical resistance and good electrical and mechanical properties.27−29 Nevertheless, due to its low hydrophilicity, a surface modification treatment, such as thermal activation,30 nitration,31,32 or anodic modification,33 is required to enhance its use as an electrode in aqueous media.
Herein, we report the synthesis of low-cost copper electrodes supported on oxidized GF (Cu-OGF). GF was first oxidized, and then copper was electrochemically deposited at different pHs. Fourier transform infrared (FTIR) spectroscopy-assisted electrocatalytic experiments showed that the electrode obtained at pH 2 can be used for the selective reduction of CO2 and water to CO and H2.
2. Experimental Section
2.1. Chemicals
Copper sulfate pentahydrate (CuSO4·5H2O, 99.99%, Sigma-Aldrich), citric acid (C6H8O7, 99%, Sigma-Aldrich), sodium hydroxide (NaOH, 99%, Sigma-Aldrich), carbon dioxide (CO2, 99.99%, White Martins), and nitrogen (N2, 99.999%, White Martins) were used without purification. GF was used as the support for copper microparticles, and copper foil (99.9%) was employed as the counter electrode in the copper deposition. Commercial copper foam was used as the reference material. All solutions were prepared using 18.2 MΩ cm deionized water.
2.2. GF Surface Treatment
In a glass reflux condenser reactor, commercial GF (4.0 cm × 1.0 cm × 0.2 cm) was soaked in a boiling mixture of 1:1 (v/v) HNO3 and H2SO4 in a fume hood. The GF was kept in the hot acid mixture for 5 min and then quickly immersed and stored in deionized water. This procedure was essential for obtaining good copper adhesion to the substrate and preserving its low electrical resistance.
2.3. Copper Electrocatalyst Electrodeposition
An electrochemical bath was prepared with a saturated CuSO4 solution in 1 M citric acid. Then, the pH value was adjusted by adding sodium hydroxide (1 M) dropwise until it reached the desired pH value (2, 4, 6, 8, and 10). Using a two-electrode cell configuration, the oxidized GF (OGF) was immersed in the electrochemical bath, and 250 mA of a cathodic current was applied against copper foil at room temperature for 2 h. Subsequently, the Cu-OGF electrodes were rinsed with deionized water to remove all chemical residues.
2.4. Physical Characterization
Scanning electron microscopy (SEM) images and energy-dispersive X-ray (EDX) elemental maps were acquired in a dual-beam FEI Scios microscope operating at 20.00 kV. Raman spectra were collected with a Witec Alpha 300 micro-Raman confocal microscope using a 532 nm excitation laser. X-ray diffraction (XRD) patterns were collected using a Shimadzu Lab X XRD6000 X-ray diffractometer equipped with a Cu Kα source (λ = 1.5406 Å).
2.5. Electrochemical Instrumentation and Procedures
The electrochemical experiments reported in this work were carried out at 25 °C in a three-electrode cell configuration using a 1010 B electrochemical workstation (Gamry, USA). The as-prepared Cu-OGF materials were used as working electrodes, while a platinum plate (1.0 cm × 1.0 cm × 0.1 mm) and Ag wire (0.1 mm) were used as the counter and pseudo-reference electrodes, respectively. To conduct the experiments, an H-shaped electrolysis cell with a Nafion membrane was used. The membrane separates the anode and cathode compartments (Figure S1). Each compartment of the H-type cell was filled with 100 mL of 0.1 M NaHCO3 and 0.1 M KCl and purged with high-purity gas (N2 or CO2) for at least 30 min before electrochemical measurements. CO2 RR polarization curves were obtained from −0.5 to −1.0 V versus reversible hydrogen electrode (RHE) at 1 mV·s–1. CO2RR and HER currents were measured by chronoamperometry from −0.58 to −0.84 V versus RHE. Electrochemical impedance spectroscopy (EIS) was recorded in the range of 20 kHz to 10 mHz in the potentiostatic mode at −0.68 V versus RHE, with 10 mV as the DC bias voltage. Finally, Gamry Echem Analyst was used for equivalent circuit modeling (ECM). All of the applied potentials are reported versus RHE potentials according to eq 1.
| 1 |
2.6. Analysis of Electrolysis Products
CO and CO2, can be quickly and simultaneously quantified by FTIR in a gas analysis cell.34,35 The specifications of the short-path gas cell are presented in Figure S2. The quantification was done by analyzing the spectra in absorbance and comparing the areas of the respective bands with the analytical curve with excellent correlation coefficients (Figure S3). To collect the gases generated in the electrolysis, CO2RR was performed in an electrochemical cell coupled with a volumetric gas compartment built from a glass buret, as shown in Figure 1. This electrochemical cell was specially designed to collect the evolved gases from the working electrode and inject them directly into the short-path FTIR gas cell for quantification. The electrochemical cell setup consists of Ag/AgCl(s) as the reference electrode, a platinum rod (d = 0.1 cm) as the counter electrode (Figure S4), and the working electrode (Cu-OGF) positioned inside the cylindric chamber. Therefore, the presence of CO and CO2 was quantified using a Thermo Scientific iS10 spectrometer. As no additional signals were detected, the remaining volume was assigned to H2.
Figure 1.
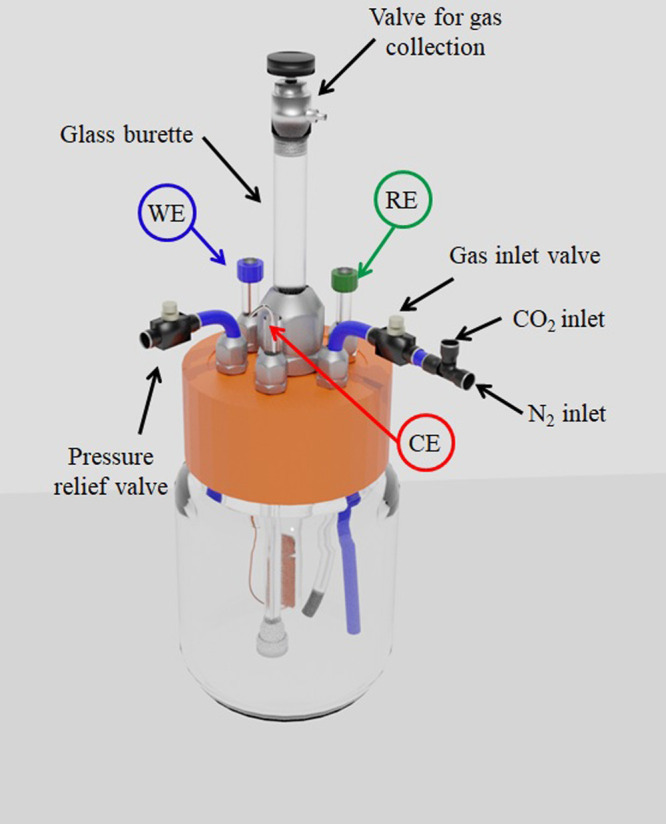
Electrochemical cell used in the quantification of gaseous products generated by FTIR spectroscopy.
3. Results and Discussion
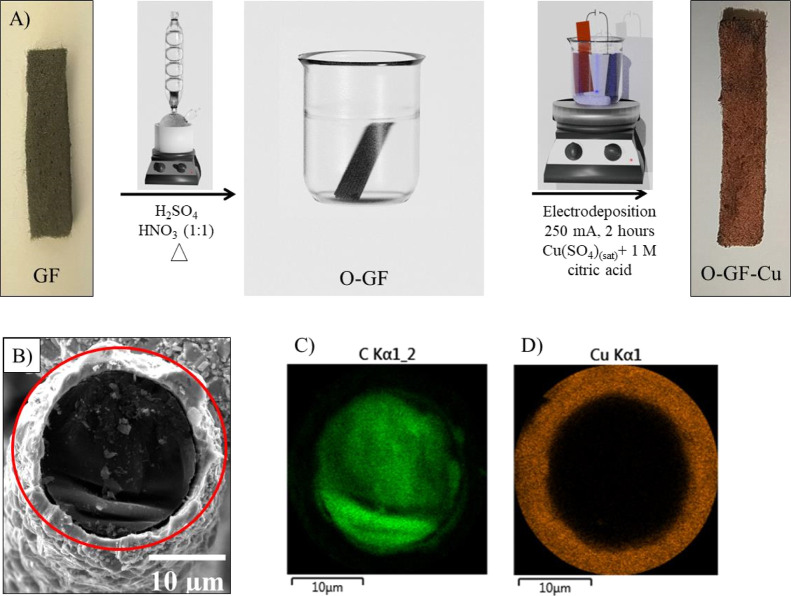
In electrocatalysis, three-dimensional materials such as metals or carbonaceous foams have been used to obtain higher numbers of active sites per geometric area, either as catalysts or as supporting material. Through a two-step method, GF was successfully coated with metallic copper, as demonstrated in Figure 2. First, GF is oxidized by its immersion in a hot mixture of H2SO4 and HNO3 (1:1 v/v) (Figure 2A). This is necessary to make the substrate hydrophilic and thus to obtain good adhesion with copper microparticles. The change in hydrophilicity of GF with the surface treatment can be seen in Figure S5. Then, the oxidized-carbon felt was copper-coated by applying a 250 mA cathodic current for 2 h. SEM imaging coupled with EDX mapping revealed the achievement of copper-coated oxidized GF (Figure 2B–D).
Figure 2.
A) Graphic illustration of the GF-Cu electrode synthesis procedure. (B) SEM image of the GF-Cu cross-section and EDX maps of (C) carbon and (D) copper. The photographs were taken by M.E.G.W.
3.1. Physical Characterization
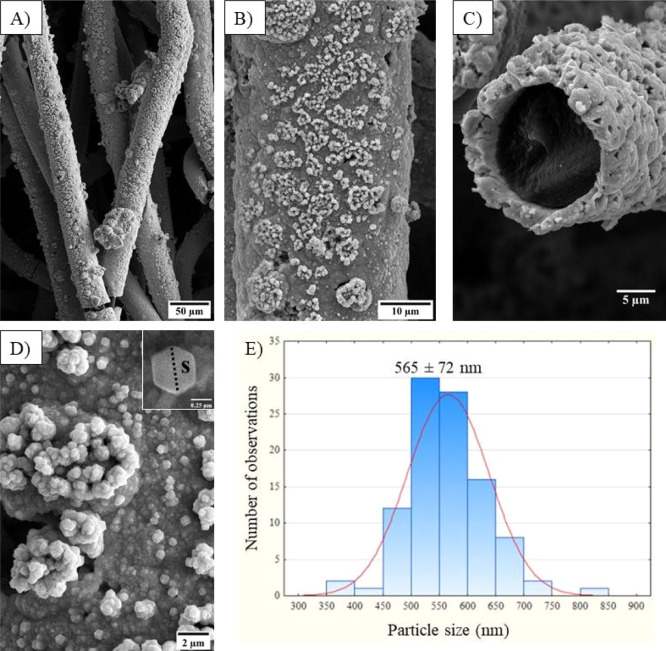
Low-magnification SEM images of the electrode surfaces (Figures 3A,B and S6) revealed that the copper coating on oxidized GF occurred within a controlled process without affecting the fiber-like morphology. Moreover, the pH used for electrodeposition was a key factor in obtaining copper microstructures. This can be seen in the high-magnification SEM images of the materials’ surfaces and by the cross-section micrographs (Figures 3C,D and S7 and S8). Therefore, the results indicate that morphology, particle sizes, roughness, and thickness of the copper layer can be tailored by the pH used. As an example, the copper layer deposited was found to be in the range of 1.1 to 9.2 μm (Table S1), as measured by the SEM images of the cross-section of the material (Figure S8). For the electrode deposited at pH 2 (Cu-OGF pH 2), hexagonal copper particles were found on the surface of the material (inset Figure 3D) with a size distribution of 565 ± 72 nm (Figure 3E). The particle size distribution of the other electrodes is presented in Figure S9.
Figure 3.
SEM results of the Cu-OGF pH 2 electrode. (A,B) Low-magnification images of the surface and (C) cross-section; (D) high-magnification image of the surface and (E) size distribution of copper particles on the surface.
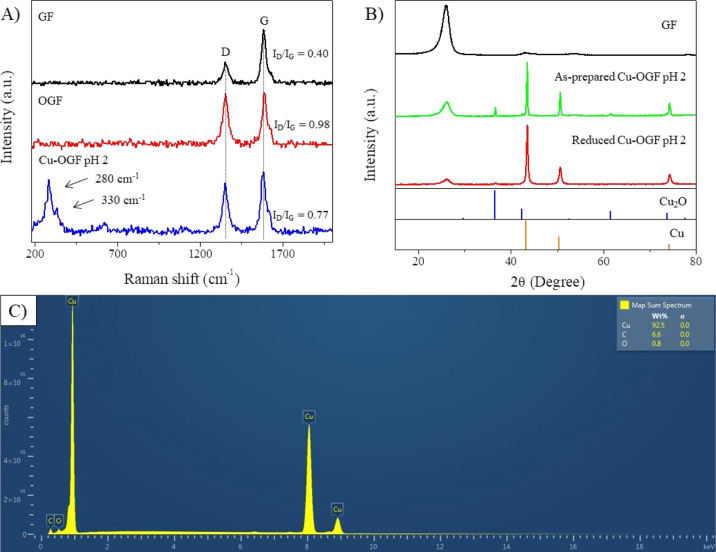
Raman spectroscopy was used to investigate changes in the GF structure caused by the surface treatment and for the characterization of copper oxides on the Cu-OGF pH 2 electrode (Figure 4A). The ratio of D (1352 cm–1) and G (1580 cm–1) bands (ID/IG) of carbonaceous materials is used to evaluate defects in carbonaceous materials. Hence, ID/IG = 0.40 was observed for GF, while ID/IG = 0.98 for OGF. This significant increase in ID is associated with the sp2 C–C bond breakage to form sp3 bonds.36 This causes an increase in defects in the material, and therefore, the ID/IG reveals the high degree of defects caused by the surface treatment in the acid medium. For Cu-OGF pH 2, the Raman spectra revealed the presence of CuO at 280 cm–1 and Cu2O at 330 cm–1, in addition to the carbonaceous D and G bands (ID/IG = 0.77) (Figure 4A). The graphitic peaks were observed in the XRD pattern of the GF (Figure 3B). Hence, the most intense peak, and the one present in the other materials, is related to the (002) plane at 2θ = 26.4°, while the less intense peaks at 43.5 and 54.3° refer to (100) and (004), respectively.37 Cu2O (JCPDS 03-065-3288) diffraction peaks (111), (200), (220), and (311) were observed at 36.7, 42.5, 61.5, and 73.7°, respectively, in the as-prepared Cu-OGF pH 2 (Figure 4B, Table S2). The presence of Cu2O and CuO, revealed by Raman spectroscopy and XRD, may be associated with the oxidation of copper due to atmospheric oxygen exposure. To understand the reduction that occurs in the first voltammetry cycles (Figure S10), the as-prepared Cu-OGF pH 2 electrode was subjected to five cycles of cyclic voltammetry in 0.1 M NaHCO3 and 0.1 M KCl, N2-saturated and then characterized by X-ray diffraction. The XRD pattern of Cu-OGF reduced at pH 2 exhibited a single peak related to the (111) crystallographic plane of Cu2O with a relative intensity of 2.30% (Table S3). This incomplete reduction is similar to that seen in oxide-derived copper materials (OD-Cu). OD-Cu catalysts are formed by copper oxidation and subsequent reduction. Thus, the presence of residual oxides is believed to be responsible for the remarkable catalytic properties.9,38 Additionally, the signals of cubic Cu(111), (200), and (220) were found at 43.6, 50.7, and 74.3°, respectively, in both as-prepared Cu-OGF pH 2 and reduced Cu-OGF pH 2 (JCPDS 00-004-0836). This suggests the deposition of polycrystalline copper on the surface of oxidized GF. EDX mapping was used to analyze the chemical composition of the Cu-OGF pH 2 surface (Figure 4C). The spectrum obtained revealed the presence of the elements Cu, C, and O at atomic ratios of 92.5, 6.6, and 0.8%, respectively, suggesting the Cu-rich surface of the fibers.
Figure 4.
Physical characterization. (A) Raman spectra of GF, OGF, and Cu-OGF pH 2; (B) XRD patterns of GF, as-prepared Cu-OGF pH 2, reduced Cu-OGF pH 2, Cu2O (JCPDS 03-065-3288), and Cu (JCPDS 00-004-0836); and (C) EDX spectra of the Cu-OGF pH 2 surface.
3.2. CO2RR Performance
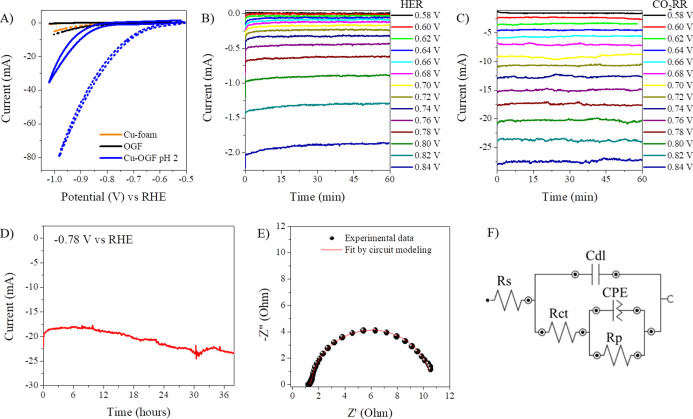
Obtaining fuels from the electrochemical reduction of CO2, where electrical energy can be obtained from renewable sources, has attracted much attention over the last decade. To this end, Cu-based materials have emerged as promising, cost-effective electrocatalysts for CO2 reduction. Motivated by the high surface areas and different morphologies of copper particles, we investigated the catalytic activity of copper-coated oxidized GF in the electrochemical reduction of CO2. As shown in Figures 5A and S11A–D, all Cu-OGF electrodes exhibited catalytic responses for CO2 superior to Cu-foam and the support material (OGF) (Figure S11E). However, the cyclic voltammograms showed significant differences in the onset potential and measured current. In both aspects, the Cu-OGF pH 2 electrode showed more promising results than others, that is, the lowest onset potential (−0.598 V for CO2RR) and the highest cathodic current (Figure 5A). This may be related to micro-structure control and the exposure of the particle edges. Changing the applied potential from −0.58 to −0.84 V versus RHE for 1 h resulted in a current variation from 8.7 μA to −1.88 mA in the absence of CO2, that is, only for HER (Figure 5B). Nevertheless, at the same applied potential range, the current variation obtained in the presence of CO2 was −1.55 to −27.3 mA (Figure 5C), which indicates high catalytic activity. Moreover, for both HER and CO2RR, the current remained stable during the electrocatalysis at each given potential. In long-term chronoamperometry measurements, Cu-OGF pH 2 displayed excellent catalytic stability (Figure 5D). Furthermore, as revealed by EIS and ECM (Figure 5E,F), Cu-OGF pH 2 exhibited charge transfer and electrode polarization resistance of 0.198 and 9.239 Ω, respectively, at −0.68 V versus RHE. These values are significantly lower than those of the other Cu-OGF electrodes (Figure S12 and Table S4). All electrodes exhibited a low total impedance value (<28 Ω), which indicates good charge transfer between the Cu-oxidized GF interface and high catalytic activity. The adopted model circuit (Figure 5F) describes Faradaic reactions in the presence of one adsorbed species, in which, Rs is the electrolyte resistance, Cdl is the double layer capacitance, Rct is the charge transfer resistance, CPE is the constant phase element (a non-ideal capacitor or a pseudocapacitance), and Rp is the electrode polarization resistance.39
Figure 5.
Catalytic performance of the Cu-OGF pH 2 in the electroreduction of CO2. (A) Cyclic voltammograms in N2-saturated and CO2-saturated 0.1 M NaHCO3 and 0.1 M KCl aqueous solutions. The scan rate was 1 mV·s–1. Chronoamperometric currents at different applied voltages in (B) N2-saturated 0.1 M NaHCO3 and 0.1 M KCl and (C) CO2-saturated 0.1 M NaHCO3 and 0.1 M KCl. (D) Long-term chronoamperometry at −0.78 V vs RHE in CO2-saturated 0.1 M NaHCO3 and 0.1 M KCl. (E) Nyquist diagram collected at −0.68 V vs RHE in CO2-saturated 0.1 M NaHCO3 and 0.1 M KCl and (F) model circuit used in the simulations.
3.3. Product Characterization and Faradaic Efficiency
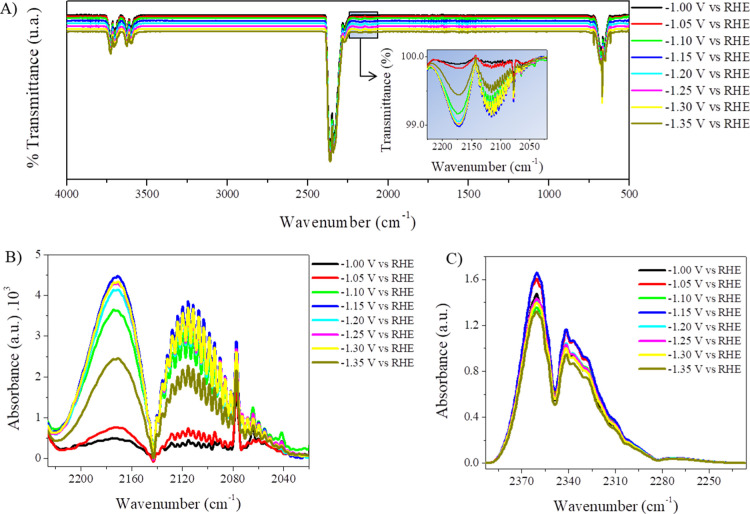
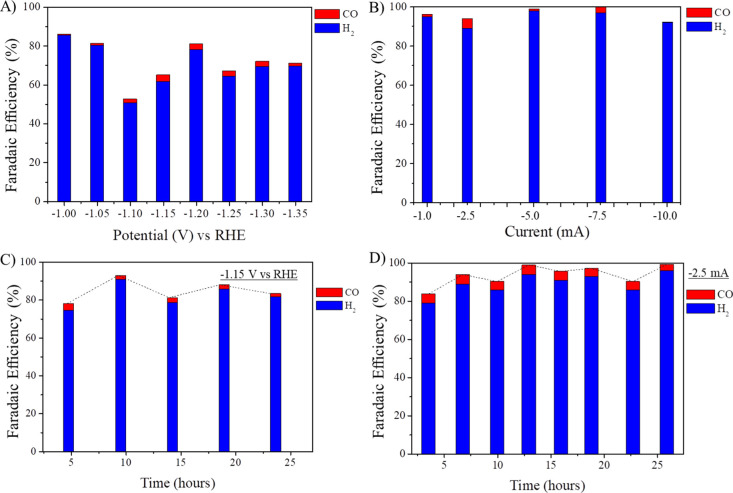
Selectivity is a big issue in CO2RR, as the formation of complex reduction products is possible, from C1 products to C2 and C3. As the focus of this work was the production of CO, the characterization of the generated gases was performed by FTIR in a short-path gas cell. Cu-OGF pH 2 was highly selective in reducing CO2 and H2O to gaseous products CO and H2. Figure 6A shows the FTIR spectra of the gases generated at potentials of −1.00 to −1.35 V—no CO was detected above −1.00 V. The areas of CO (2226–2020 cm–1, Figure 6B) and CO2 (2393–2227 cm–1, Figure 6C) absorbance signals were used for quantifying the CO produced and for calculating the FE. Carbon dioxide was present due to the non-Faradaic processes involved, such as desorption at the electrode surface. The difference between the total volume of gas produced and the volumes of CO and CO2 was assumed to be the volume of H2, as no other signals appeared in the FTIR spectrum (Figure 6A). The chronoamperometry curves are shown in Figure S13, and the data used to calculate the FE are presented in Table S5. From −1.00 to −1.35 V versus RHE, CO was produced with a FE of 0.58 to 3.54%, while H2 had a FE of 50.87 to 85.58%, resulting in a total FE of 52.79 to 86.17% (Figure 7A), suggesting the presence of products in the liquid phase. Interestingly, even at higher potentials (more negatives than −1.25 V vs RHE), there was no detection of methane, which is the main CO2RR product reported for polycrystalline copper under these conditions.3,40 However, by performing constant current measurements, the total FE toward CO and H2 were improved to 92.00% at −10.0 mA and 100.25% at −7.5 mA (Figure 7B). Although the efficiency was very high for H2, the high overpotential for HER does not make it a good catalyst for H2. The FTIR spectra of the constant current measurements, the chronopotentiometry curves, and the data for calculating the FE are shown in Figure S14 and Table S6.
Figure 6.
(A) FTIR spectra from 4000 to 500 cm–1 of the gases produced at different potentials (inset: 2226–2020 cm–1); (B,C) absorption regions of carbon monoxide and carbon dioxide, respectively.
Figure 7.
CO and H2 FE of Cu-OGF pH 2 in saturated sodium bicarbonate solution and CO2 flux at different (A) potentials and (B) currents and in long-duration measurements at optimized (C) potential and (D) current.
After finding the highest efficiency conditions (−1.15 V vs RHE for constant potential and −2.5 mA for constant current), we studied the performance and selectivity in long-duration measurements (at least 24 h). At −1.15 V versus RHE, the total evolved gas volume was 35.00 mL, resulting in five injections to the short-path gas analysis cell, in which the FE toward CO was initially 2.67% and decreased to 1.72% by the end of the experiment, while toward H2, it dropped from 97.03 to 81.29% (Figures 7C, S15, and Table S7). For comparison, at −2.5 mA, the total volume of produced gas was 41.30 mL and divided into eight FTIR measurements. Initially, the FE of CO was 4.88% in the first analysis, reaching the maximum in the second (5.21%) and decreasing to 3.70% at the end of the experiment (Figures 7D, S16, and Table S8).
The found FE for CO (5.21%) is a significant value since the bulk Cu electrode gives a value of only 1.3%, exhibiting higher efficiencies for CH4 (33.3%) and ethylene (25.5%).40 Compared to Cu-foam, this result was even superior (0.55% for CO and 3.19% for H2) (Figure S17 and Table S9). Also, the selectivity of the Cu-OGF pH 2 electrode for CO and H2 was not expected since copper is a metal capable of producing a wide range of products from CO2RR. For example, Kuhl and co-workers reported obtaining 16 products using copper foil as the working electrode, including the gaseous products carbon monoxide, methane, and ethylene.3 Similarly, Wu and co-workers deposited Cu dendrites on carbon paper, and it showed to be active for the production of the same gaseous species.41 In our experiments, only CO was detected, similar to Kumar and co-workers’ results but applying pulsed-bias electrolysis.24 The selectivity for syngas in DC electrolysis was recently reported by Wang and co-workers on copper and copper oxide electrodes.9 They showed high efficiency for CO and H2, but the total FE was around 80%. Although the maximum FE to CO and H2 was 5.21 and 88.80%, respectively, the present work reports a simple and inexpensive strategy for obtaining electrodes capable of transforming CO2 and H2O to CO and H2 (with a total FE close to 100%), which can be used as fuel gas or enriched with CO to achieve suitable H2/CO ratios for the synthesis of chemicals by Fischer–Tropsch processes.
To understand the loss of electrode efficiency, the post-electrolysis electrode surface was characterized by SEM, EDX mapping, and Raman spectroscopy. SEM micrographs revealed restructuring of the electrode surface, such as the loss of hexagonal morphologies and oxidation (Figures 8A and S18). EDX mapping indicated a copper-rich surface with the presence of oxygen (Figure 8B,C), and the increase in the oxygen signal can be seen in Figure S19. The Raman spectrum revealed that the increased oxygen amount is attributable to the oxidation of copper particles to Cu2O, as denoted by the appearance of the 224 cm–1 signal (Figure 8D). The processes of surface restructuring and copper oxidation are two well-known electrode deactivation phenomena.14,40,42
Figure 8.
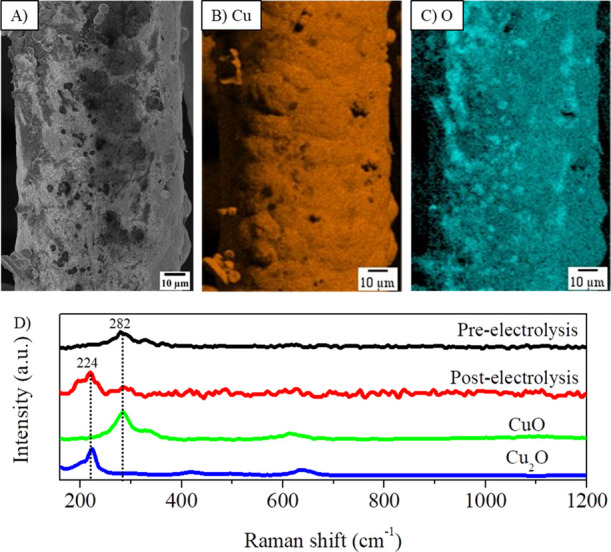
Physical characterization of the post-electrolysis Cu-OGF pH 2 electrode. (A) SEM micrograph; (B,C) EDX mapping of Cu and O elements, respectively; and (D) Raman spectra.
4. Conclusions
Here, a synthetic strategy has been developed to prepare copper-coated oxidized GF electrodes. A series of characterization techniques were used to study the detailed structure of the copper layer. The morphologies of copper particles, the width of the copper layer, and the particle sizes were found to be related to the pH used in the deposition. The highest performance was obtained by the electrode prepared at pH 2, reaching the lowest onset potential and the highest measured current. This could be explained by the better control of the microstructures of particles and the exposure of their edges. FTIR-assisted electrochemical measurements were performed with this electrode at a constant potential (from −1.00 to −1.35 V vs RHE) and current (−1.0, −2.5, −5.0, −7.5, and −10 mA). It was found that the FE was between 0.50 and 5.21% for CO and 50.87 and 98.30 for H2, according to experimental conditions. Therefore, the produced gas mixture can be used as a fuel gas, or it can be CO-enriched for Fischer–Tropsch processes.
Acknowledgments
The authors are thankful for the financial support from the Coordenação de Aperfeiçoamento de Pessoal de Nível Superior, the Conselho Nacional de Desenvolvimento Científico e Tecnológico, Brazil (Proc. nos. 429548/2018-4 and 311517/2020-0), and Instituto Nacional de Ciência, Tecnologia e Inovação em Materiais Complexos Funcionais (INOMAT-Proc. no. CNPq 573644/2008-0). The authors would also like to thank the Complexo de Centrais de Apoio à Pesquisa (COMCAP) and Financiadora de Estudos e Projetos (Finep) for their instrumental support.
Glossary
Abbreviations
- CO
carbon monoxide
- CO2
carbon dioxide
- CuSO4
copper sulfate
- CO2RR
carbon dioxide reduction reaction
- Cu-OGF
copper-coated oxidized graphite felt
- Cu-OGF pH 2
copper-coated oxidized graphite felt deposited at pH 2
- Cu-OGF pH 4
copper-coated oxidized graphite felt deposited at pH 4
- Cu-OGF pH 6
copper-coated oxidized graphite felt deposited at pH 6
- Cu-OGF pH 8
copper-coated oxidized graphite felt deposited at pH 8
- Cu-OGF pH 10
copper-coated oxidized graphite felt deposited at pH 10
- ECM
equivalent circuit modeling
- EDX
energy dispersive X-ray
- EIS
electrochemical impedance spectroscopy
- HER
hydrogen evolution reaction
- HNO3
nitric acid
- H2SO4
sulfuric acid
- H2
hydrogen
- H2O
water
- FE
Faradaic efficiency
- FTIR
Fourier transform infrared
- GF
graphite felt
- OGF
oxidized graphite felt
- N2
nitrogen gas
- RHE
reversible hydrogen electrode
- SEM
scanning electron microscopy
- XRD
X-ray diffraction
Supporting Information Available
The Supporting Information is available free of charge at https://pubs.acs.org/doi/10.1021/acsomega.2c05486.
Additional experimental details, methods, FTIR spectra, SEM images, particle size distribution, cyclic voltammograms, Nyquist diagrams, chronoamperometry curves, and data acquired for FE calculations (PDF)
Author Contributions
Conceptualization, formal analysis, investigation, writing—original draft, reviewing, and editing: [M.E.G.W.]. Conceptualization, formal analysis, investigation, writing—reviewing, editing, and original draft preparation: [R.H.G.]. Resources, validation, reviewing, and editing: [A.F.R.].
The authors declare no competing financial interest.
Supplementary Material
References
- Chu S.; Cui Y.; Liu N. The Path towards Sustainable Energy. Nat. Mater. 2017, 16, 16–22. 10.1038/nmat4834. [DOI] [PubMed] [Google Scholar]
- Bagger A.; Ju W.; Varela A. S.; Strasser P.; Rossmeisl J. Electrochemical CO2 Reduction: Classifying Cu Facets. ACS Catal. 2019, 9, 7894–7899. 10.1021/acscatal.9b01899. [DOI] [Google Scholar]
- Kuhl K. P.; Cave E. R.; Abram D. N.; Jaramillo T. F. New Insights into the Electrochemical Reduction of Carbon Dioxide on Metallic Copper Surfaces. Energy Environ. Sci. 2012, 5, 7050–7059. 10.1039/c2ee21234j. [DOI] [Google Scholar]
- Greenblatt J. B.; Miller D. J.; Ager J. W.; Houle F. A.; Sharp I. D. The Technical and Energetic Challenges of Separating (Photo)Electrochemical Carbon Dioxide Reduction Products. Joule 2018, 2, 381–420. 10.1016/j.joule.2018.01.014. [DOI] [Google Scholar]
- Xie H.; Chen S.; Ma F.; Liang J.; Miao Z.; Wang T.; Wang H. L.; Huang Y.; Li Q. Boosting Tunable Syngas Formation via Electrochemical CO2 Reduction on Cu/In2O3 Core/Shell Nanoparticles. ACS Appl. Mater. Interfaces 2018, 10, 36996–37004. 10.1021/acsami.8b12747. [DOI] [PubMed] [Google Scholar]
- Hernández S.; Amin Farkhondehfal M. A.; Sastre F.; Makkee M.; Saracco G.; Russo N. Syngas Production from Electrochemical Reduction of CO2: Current Status and Prospective Implementation. Green Chem. 2017, 19, 2326–2346. 10.1039/c7gc00398f. [DOI] [Google Scholar]
- U. S. Department of Energy . Syngas Composition. https://netl.doe.gov/research/coal/energy-systems/gasification/gasifipedia/syngas-composition#:~:text=Thiscanvarysignificantlydependingamountsofthesulfurcompounds (accessed November 09, 2022).
- Zhang Z.; Zheng Y.; Qian L.; Luo D.; Dou H.; Wen G.; Yu A.; Chen Z. Emerging Trends in Sustainable CO2 Management Materials. Adv. Mater. 2022, 34, 2201547. 10.1002/adma.202201547. [DOI] [PubMed] [Google Scholar]
- Wang Y.; Niu C.; Zhu Y.; He D.; Huang W. Tunable Syngas Formation from Electrochemical CO2 Reduction on Copper Nanowire Arrays. ACS Appl. Energy Mater. 2020, 3, 9841–9847. 10.1021/acsaem.0c01504. [DOI] [Google Scholar]
- Yang W.; Zhang J.-H.; Si R.; Cao L.-M.; Zhong D.-C.; Lu T.-B. Efficient and Steady Production of 1:2 Syngas (CO/H2 ) by Simultaneous Electrochemical Reduction of CO2 and H2O. Inorg. Chem. Front. 2021, 8, 1695–1701. 10.1039/D0QI01351J. [DOI] [Google Scholar]
- Suttikul T.; Nuchdang S.; Rattanaphra D.; Phalakornkule C. Influence of Operating Parameters, Al2O3 and Ni/Al2O3 Catalysts on Plasma-Assisted CO2 Reforming of CH4 in a Parallel Plate Dielectric Barrier Discharge for High H2/CO Ratio Syngas Production. Plasma Chem. Plasma Process. 2020, 40, 1445–1463. 10.1007/s11090-020-10118-7. [DOI] [Google Scholar]
- Kang J.; He S.; Zhou W.; Shen Z.; Li Y.; Chen M.; Zhang Q.; Wang Y. Single-Pass Transformation of Syngas into Ethanol with High Selectivity by Triple Tandem Catalysis. Nat. Commun. 2020, 11, 827. 10.1038/s41467-020-14672-8. [DOI] [PMC free article] [PubMed] [Google Scholar]
- Reske R.; Mistry H.; Behafarid F.; Roldan Cuenya B.; Strasser P. Particle Size Effects in the Catalytic Electroreduction of CO2 on Cu Nanoparticles. J. Am. Chem. Soc. 2014, 136, 6978–6986. 10.1021/ja500328k. [DOI] [PubMed] [Google Scholar]
- Grosse P.; Gao D.; Scholten F.; Sinev I.; Mistry H.; Cuenya B. R. Dynamic Changes in the Structure, Chemical State and Catalytic Selectivity of Cu Nanocubes during CO2 Electroreduction : Size and Support Effects. Angew. Chem., Int. Ed. 2018, 57, 6192–6197. 10.1002/anie.201802083. [DOI] [PubMed] [Google Scholar]
- Scholten F.; Nguyen K. L. C.; Bruce J. P.; Heyde M.; Roldan Cuenya B. Identifying Structure–Selectivity Correlations in the Electrochemical Reduction of CO2: A Comparison of Well-Ordered Atomically Clean and Chemically Etched Copper Single-Crystal Surfaces. Angew. Chem., Int. Ed. 2021, 60, 19169–19175. 10.1002/anie.202103102. [DOI] [PMC free article] [PubMed] [Google Scholar]
- Dai L.; Qin Q.; Wang P.; Zhao X.; Hu C.; Liu P.; Qin R.; Chen M.; Ou D.; Xu C.; Mo S.; Wu B.; Fu G.; Zhang P.; Zheng N. Ultrastable Atomic Copper Nanosheets for Selective Electrochemical Reduction of Carbon Dioxide. Sci. Adv. 2017, 3, e1701069 10.1126/sciadv.1701069. [DOI] [PMC free article] [PubMed] [Google Scholar]
- Li Q.; Fu J.; Zhu W.; Chen Z.; Shen B.; Wu L.; Xi Z.; Wang T.; Lu G.; Zhu J. J.; Sun S. Tuning Sn-Catalysis for Electrochemical Reduction of CO2 to CO via the Core/Shell Cu/SnO2 Structure. J. Am. Chem. Soc. 2017, 139, 4290–4293. 10.1021/jacs.7b00261. [DOI] [PubMed] [Google Scholar]
- Hoffman Z. B.; Gray T. S.; Moraveck K. B.; Gunnoe T. B.; Zangari G. Electrochemical Reduction of Carbon Dioxide to Syngas and Formate at Dendritic Copper-Indium Electrocatalysts. ACS Catal. 2017, 7, 5381–5390. 10.1021/acscatal.7b01161. [DOI] [Google Scholar]
- Luo W.; Xie W.; Mutschler R.; Oveisi E.; De Gregorio G. L.; Buonsanti R.; Züttel A. Selective and Stable Electroreduction of CO2 to CO at the Copper/Indium Interface. ACS Catal. 2018, 8, 6571–6581. 10.1021/acscatal.7b04457. [DOI] [Google Scholar]
- Choi J.; Kim M. J.; Ahn S. H.; Choi I.; Jang J. H.; Ham Y. S.; Kim J. J.; Kim S. K. Electrochemical CO2 Reduction to CO on Dendritic Ag-Cu Electrocatalysts Prepared by Electrodeposition. Chem. Eng. J. 2016, 299, 37–44. 10.1016/j.cej.2016.04.037. [DOI] [Google Scholar]
- Yin Z.; Gao D.; Yao S.; Zhao B.; Cai F.; Lin L.; Tang P.; Zhai P.; Wang G.; Ma D.; Bao X. Highly Selective Palladium-Copper Bimetallic Electrocatalysts for the Electrochemical Reduction of CO2 to CO. Nano Energy 2016, 27, 35–43. 10.1016/j.nanoen.2016.06.035. [DOI] [Google Scholar]
- Kim D.; Xie C.; Becknell N.; Yu Y.; Karamad M.; Chan K.; Crumlin E. J.; Nørskov J. K.; Yang P. Electrochemical Activation of CO2 through Atomic Ordering Transformations of AuCu Nanoparticles. J. Am. Chem. Soc. 2017, 139, 8329–8336. 10.1021/jacs.7b03516. [DOI] [PubMed] [Google Scholar]
- Engelbrecht A.; Uhlig C.; Stark O.; Hämmerle M.; Schmid G.; Magori E.; Wiesner-Fleischer K.; Fleischer M.; Moos R. On the Electrochemical CO2 Reduction at Copper Sheet Electrodes with Enhanced Long-Term Stability by Pulsed Electrolysis. J. Electrochem. Soc. 2018, 165, J3059–J3068. 10.1149/2.0091815jes. [DOI] [Google Scholar]
- Kumar B.; Brian J. P.; Atla V.; Kumari S.; Bertram K. A.; White R. T.; Spurgeon J. M. Controlling the Product Syngas H2:CO Ratio through Pulsed-Bias Electrochemical Reduction of CO2 on Copper. ACS Catal. 2016, 6, 4739–4745. 10.1021/acscatal.6b00857. [DOI] [Google Scholar]
- Zhao J.; Sun L.; Canepa S.; Sun H.; Yesibolati M. N.; Sherburne M.; Xu R.; Sritharan T.; Loo J. S. C.; Ager III J. W.; Barber J.; Mølhave K.; Xu Z. J. Phosphate Tuned Copper Electrodeposition and Promoted Formic Acid Selectivity for Carbon Dioxide Reduction. J. Mater. Chem. A 2017, 5, 11905–11916. 10.1039/c7ta01871a. [DOI] [Google Scholar]
- Zhu Q.; Sun X.; Yang D.; Ma J.; Kang X.; Zheng L.; Zhang J.; Wu Z.; Han B. Carbon Dioxide Electroreduction to C2 Products over Copper-Cuprous Oxide Derived from Electrosynthesized Copper Complex. Nat. Commun. 2019, 10, 3851. 10.1038/s41467-019-11599-7. [DOI] [PMC free article] [PubMed] [Google Scholar]
- Castañeda L. F.; Walsh F. C.; Nava J. L.; Ponce de León C. Graphite Felt as a Versatile Electrode Material: Properties, Reaction Environment, Performance and Applications. Electrochim. Acta 2017, 258, 1115–1139. 10.1016/j.electacta.2017.11.165. [DOI] [Google Scholar]
- He L.; Wang X.; Li S.; Zhu Y.; Cheng X.; Ma J. Role of Graphite Felt Electrode and Electron Delocalization of Cinnamate Ester in Electrochemical Hydrogenation Reaction. J. Phys. Chem. C 2021, 125, 13871–13879. 10.1021/acs.jpcc.1c02850. [DOI] [Google Scholar]
- Ding P.; Meng C.; Liang J.; Li T.; Wang Y.; Liu Q.; Luo Y.; Cui G.; Asiri A. M.; Lu S.; Sun X. NiFe Layered-Double-Hydroxide Nanosheet Arrays on Graphite Felt: A 3D Electrocatalyst for Highly Efficient Water Oxidation in Alkaline Media. Inorg. Chem. 2021, 60, 12703–12708. 10.1021/acs.inorgchem.1c01783. [DOI] [PubMed] [Google Scholar]
- Zhang H.; Chen N.; Sun C.; Luo X. Investigations on physicochemical properties and electrochemical performance of graphite felt and carbon felt for iron-chromium redox flow battery. Int. J. Energy Res. 2020, 44, 3839–3853. 10.1002/er.5179. [DOI] [Google Scholar]
- Vogel F. L.; Popowich R.. Changes of Electrical Resistivity of Graphite Fibers with Nitration. In Petroleum Derived Carbons; Deviney M. L., O’Grady T. M., Eds.; American Chemical Society: Washington, D. C., 1976; pp 411–417. [Google Scholar]
- Chen J. P.; Wu S. Acid/Base-Treated Activated Carbons: Characterization of Functional Groups and Metal Adsorptive Properties. Langmuir 2004, 20, 2233–2242. 10.1021/la0348463. [DOI] [PubMed] [Google Scholar]
- Guo H.; Xu H.; Zhao C.; Hao X.; Yang Z.; Xu W. High-Effective Generation of H2O2 by Oxygen Reduction Utilizing Organic Acid Anodized Graphite Felt as Cathode. J. Ind. Eng. Chem. 2022, 108, 466–475. 10.1016/j.jiec.2022.01.027. [DOI] [Google Scholar]
- Tan T. L.; Lebron G. B. Determination of Carbon Dioxide, Carbon Monoxide, and Methane Concentrations in Cigarette Smoke by Fourier Transform Infrared Spectroscopy. J. Chem. Educ. 2012, 89, 383–386. 10.1021/ed200178s. [DOI] [Google Scholar]
- Bak J.; Larsen A. Quantitative Gas Analysis with FT-IR: A Method for CO Calibration Using Partial Least-Squares with Linearized Data. Appl. Spectrosc. 1995, 49, 437–443. 10.1366/0003702953964237. [DOI] [Google Scholar]
- Rebelo S. L. H.; Guedes A.; Szefczyk M. E.; Pereira A. M.; Araújo J. P.; Freire C. Progress in the Raman Spectra Analysis of Covalently Functionalized Multiwalled Carbon Nanotubes: Unraveling Disorder in Graphitic Materials. Phys. Chem. Chem. Phys. 2016, 18, 12784–12796. 10.1039/c5cp06519d. [DOI] [PubMed] [Google Scholar]
- Yue L.; Li W.; Sun F.; Zhao L.; Xing L. Highly hydroxylated carbon fibres as electrode materials of all-vanadium redox flow battery. Carbon 2010, 48, 3079–3090. 10.1016/j.carbon.2010.04.044. [DOI] [Google Scholar]
- Lum Y.; Ager J. W. Stability of Residual Oxides in Oxide-Derived Copper Catalysts for Electrochemical CO2 Reduction Investigated with 18O Labeling. Angew. Chem., Int. Ed. 2018, 57, 551–554. 10.1002/anie.201710590. [DOI] [PubMed] [Google Scholar]
- Lasia A.Impedance of the Faradaic Reactions in the Presence of Adsorption. Electrochemical Impedance Spectroscopy and its Applications; Springer New York: New York, NY, 2014; Vol. 1, pp 127–145. [Google Scholar]
- Nitopi S.; Bertheussen E.; Scott S. B.; Liu X.; Engstfeld A. K.; Horch S.; Seger B.; Stephens I. E. L.; Chan K.; Hahn C.; Nørskov J. K.; Jaramillo T. F.; Chorkendorff I. Progress and Perspectives of Electrochemical CO2 Reduction on Copper in Aqueous Electrolyte. Chem. Rev. 2019, 119, 7610–7672. 10.1021/acs.chemrev.8b00705. [DOI] [PubMed] [Google Scholar]
- Wu M.; Zhu C.; Wang K.; Li G.; Dong X.; Song Y.; Xue J.; Chen W.; Wei W.; Sun Y. Promotion of CO2 Electrochemical Reduction via Cu Nanodendrites. ACS Appl. Mater. Interfaces 2020, 12, 11562–11569. 10.1021/acsami.9b21153. [DOI] [PubMed] [Google Scholar]
- Simon G. H.; Kley C. S.; Cuenya B. R. Potential-Dependent Morphology of Copper Catalysts During CO2 Electroreduction Revealed by In Situ Atomic Force Microscopy. Angew. Chem., Int. Ed. 2021, 60, 2561–2568. 10.1002/anie.202010449. [DOI] [PMC free article] [PubMed] [Google Scholar]
Associated Data
This section collects any data citations, data availability statements, or supplementary materials included in this article.


