

ABSTRACT
We have previously described the role of an essential Saccharomyces cerevisiae gene, important for cleavage and polyadenylation 1 (IPA1), in the regulation of gene expression through its interaction with Ysh1, the endonuclease subunit of the mRNA 3′-end processing complex. Through a similar mechanism, the mammalian homolog ubiquitin protein ligase E3D (UBE3D) promotes the migratory and invasive potential of breast cancer cells, but its role in the regulation of gene expression during normal cellular differentiation has not previously been described. In this study, we show that CRISPR/Cas9-mediated knockout of Ube3d in 3T3-L1 cells blocks their ability to differentiate into mature adipocytes. Consistent with previous studies in other cell types, Ube3d knockout leads to decreased levels of CPSF73 and global changes in cellular mRNAs indicative of a loss of 3′-end processing capacity. Ube3d knockout cells also display decreased expression of known preadipogenic markers. Overexpression of either UBE3D or CPSF73 rescues the differentiation defect and partially restores protein levels of these markers. These results support a model in which UBE3D is necessary for the maintenance of the adipocyte-committed state via its regulation of the mRNA 3′-end processing machinery.
KEYWORDS: RNA processing, adipogenesis, cell differentiation
INTRODUCTION
Eukaryotic cells must be able to dynamically regulate gene expression in response to internal and external signals. This regulatory capacity is coordinated by a broad network of molecular interactions impacting all aspects of the mRNA life cycle. It is increasingly appreciated that cleavage and polyadenylation of nascent transcripts at the 3′ end represent a key control point since changes in processing efficiency can affect the amount of the mRNA product (1–5). In addition, changes in which the poly(A) site is used can impact the protein product directly, in the case of intronic polyadenylation, or indirectly by altering the inclusion of regulatory sequences in the 3′ untranslated region (UTR). This is particularly important during cellular differentiation, where alternative polyadenylation (APA) has been shown to play a role in processes such as spermatogenesis and neurogenesis, as well as in induced pluripotent stem cell (iPSC) reprogramming (6).
The core factors which mediate the cleavage and polyadenylation of nascent mRNAs are generally conserved across Eukarya despite variations in the need for additional factors, the organization of the complex, and the consensus sequences that define the poly(A) site (7–9). The availability of cleavage and polyadenylation subunits has been shown to influence poly(A) site use, with decreased levels of core factors often leading to shifts in 3′-UTR lengths through the use of alternate poly(A) sites (1–3, 10). Knowing how the levels of these essential proteins are themselves regulated by the cell is therefore critical to understanding how 3′-end processing capacity affects cellular function.
Important for cleavage and polyadenylation 1 (IPA1) is an essential yeast gene whose function was, until recently, unknown. We identified a role for IPA1 in mRNA 3′-end processing by analyzing its genetic interaction profile and showed that an IPA1 mutant is defective for processing and displays a characteristic shift to downstream poly(A) sites as seen in other 3′-end processing mutants (11, 12). We demonstrated that IPA1 mutant cells exhibit decreased protein levels of the Ysh1 cleavage site endonuclease except wild-type levels of other processing complex subunits and that degradation of Ysh1 occurs in a ubiquitination-dependent manner, leading to global downregulation of mRNA 3′-end processing (12, 13).
The metazoan homolog of IPA1, ubiquitin protein ligase E3D (UBE3D), has not been extensively studied. In 2005, biochemical experiments showed that UBE3D binds cyclin B in vitro (14), but the functional implications of this interaction were not investigated. More recent work has provided additional evidence for its role in cell cycle regulation (15) and linked UBE3D to macular degeneration, chronic periodontitis, and fatty acid composition of sheep muscle (16–19). The molecular mechanism behind these associations, however, remains unclear. In a recent study (20), we provided evidence that the interaction between Ysh1 and Ipa1 seen in yeast is conserved in metazoans. In both HEK-293, an immortalized human embryonic kidney cell line, and MDA-MB-231, a triple-negative breast cancer cell line, we show that loss of UBE3D leads to CPSF73 downregulation, a pre-mRNA cleavage defect, and dysregulated gene expression. Like Ipa1, UBE3D stabilizes CPFS73 protein by preventing its ubiquitin-mediated degradation by the proteasome.
We were curious as to what role UBE3D might have in cell state transitions in normal cells. A recent study on the inhibition of CPSF73 by the small molecule JTE-607 found that genes in the Gene Ontology (GO) terms related to fat cell differentiation were significantly downregulated in NOMO-1, an acute myeloid leukemia cell line, and in A549 cells derived from a lung adenocarcinoma (21). This observation suggested to us that downregulation of CPSF73 by UBE3D might affect adipogenesis. However, the roles of UBE3D or CPSF73 in the context of adipocyte differentiation have not been explored. Moreover, little is known about the regulation of polyadenylation during adipogenesis, and only a few examples have been documented. Differential use of poly(A) sites in UCP1 3′ UTR is important for the thermogenic function of brown adipose tissue (22), providing an illustration of how APA can shape adipocyte function. RNA sequencing of human adipose tissue-derived stromal cells before and during the initial steps of differentiation in vitro revealed both lengthened and shortened 3′ UTRs (23). An analysis of murine 3T3-L1 preadipocyte cells showed an overall increased use of distal poly(A) sites following full differentiation (24). While these studies suggest that mRNA 3′-end processing plays an important regulatory role during adipocyte differentiation, the factors mediating these changes are not known. We therefore chose to use 3T3-L1 preadipocytes as an in vitro model to study the role UBE3D plays during normal cellular differentiation.
3T3-L1 cells represent committed adipocyte precursors that differentiate robustly in vitro when treated with a defined differentiation medium (25, 26). In this work, we show that UBE3D levels are highest in undifferentiated 3T3-L1 cells. Knockout (KO) of Ube3d using CRISPR/Cas9 completely abolishes the ability of these cells to differentiate into mature adipocytes, and this phenotype can be rescued with overexpression of Ube3d or CPSF73. Bulk mRNA sequencing comparing wild-type (WT) and Ube3d-KO cells shows that Ube3d-KO cells display hallmarks of a 3′-end processing defect as well as gene expression changes, indicating a shift away from the committed preadipogenic state. We conclude that UBE3D is necessary for maintenance of the adipogenic commitment of 3T3-L1 cells and that this function is promoted through its regulation of CPSF73 levels.
RESULTS
UBE3D is highly expressed in preadipocytes and decreased during differentiation.
3T3-L1 cells robustly differentiate into adipocytes when treated with a well-established protocol involving a defined induction cocktail containing insulin, dexamethasone, rosiglitazone, and 3-isobutyl-1-methylxanthine (IBMX) (26). For the cells to respond to the differentiation protocol, they must reach confluence, at which point they undergo contact inhibition and stop dividing. At this stage (designated day 0), the induction cocktail is added to the medium. We were able to recapitulate all three stages of this differentiation process (Fig. 1A), including mitotic clonal expansion (day 0 to day 2), adipogenesis (day 2 to day 4), and lipogenesis (day 4 to day 10). UBE3D levels are high in undifferentiated cells during log-phase growth (undifferentiated [UD]) but drop once the cells become confluent (day 0) and decrease below detectable levels as the cells differentiate (Fig. 1B). We measured Ube3d mRNA levels by reverse transcriptase quantitative PCR (RT-qPCR) and found a similar pattern, with transcript levels decreasing significantly once the cells reached confluence at day 0 (Fig. 1C).
FIG 1.

Ube3d expression is dynamic during 3T3-L1 differentiation. (A) Oil Red O staining of 3T3-L1 cells showing accumulation of fat droplets starting on day 4 of the differentiation protocol and increasing dramatically on days 7 and 10. Representative images are shown. (B) UBE3D protein levels are high in undifferentiated 3T3-L1 cells and decrease to undetectable levels during differentiation. FABP4 is shown as a marker of adipocyte differentiation. (C) Ube3d mRNA levels decrease during differentiation. Relative expression levels normalized to 18S rRNA levels are shown (n = 3; mean ± SEM). ns, not significant (one-way analysis of variance [ANOVA] with Dunnett’s multiple-comparison test).
UBE3D knockout in preadipocytes blocks adipogenesis.
To assess whether the high expression level of UBE3D in undifferentiated 3T3-L1 cells was important for maintaining their ability to differentiate, we employed a CRISPR/Cas9-mediated gene knockout strategy and isolated a Ube3d-KO clonal line. We confirmed the presence of a coding DNA sequence (CDS)-disrupting indel at the single guide RNA (sgRNA) targeting site by Sanger sequencing and verified that UBE3D protein levels are undetectable by Western blotting in Ube3d-KO cells (Fig. 2A). After 7 days of induction, Ube3d-KO cells show greatly decreased production of the adipocyte marker FABP4 compared to Ube3d-expressing cells (Fig. 2A) and are unable to differentiate into fat-producing adipocytes, as seen by a lack of Oil Red O staining (Fig. 2B). We quantified the mRNA expression of the differentiation markers peroxisome proliferator-activated receptor gamma (PPARγ), CCAAT/enhancer binding protein alpha (Cebpa), fatty acid binding protein 4 (Fabp4), adipsin (also known as complement factor D [Cfd]), and adiponectin (Adipoq) by RT-qPCR and found that Ube3d-KO cells are defective for expression of these genes (Fig. 2C).
FIG 2.

Ube3d knockout (KO) cells are unable to differentiate into mature adipocytes. (A) UBE3D levels are undetectable in Ube3d-KO cells, and FABP4 levels are greatly decreased compared to UBE3D-expressing cells (WT) after induction of differentiation for 7 days. Representative Western blotting is shown. (B) Ube3d-KO cells do not accumulate fat droplets as evidenced by a lack of Oil Red O staining on day 10 of differentiation. Representative high-power fields are shown. (C) mRNA levels of adipocyte differentiation markers are significantly decreased in Ube3d-KO versus WT cells. Relative expression levels normalized to 18S rRNA levels are shown (n = 3; mean ± SD). All values at day 7 were significantly different from WT (P < 0.0001, two-way ANOVA with Šídák's multiple-comparison test). (D) Representative images of Ki-67 and phosphohistone H3 (pHH3) staining and quantification of the percentage of positive nuclei in WT and Ube3d-KO cells 24 h after treatment with induction medium. There were no significant differences between WT and KO cells (two-way ANOVA with Šídák's multiple-comparison test; ns, P > 0.05).
An important stage in differentiation of 3T3-L1 cells is the mitotic clonal expansion that occurs during the first 48 h after treatment with induction medium (Fig. 1A, days 0 to 2) (27). We used the nuclear proteins Ki-67 and phosphohistone H3 (pHH3) as canonical markers of proliferation (28, 29) and found no significant difference in the proportion of Ki-67 or pHH3-positive nuclei between Ube3d WT and KO cells at 24 h posttreatment (Fig. 2D). This result indicates that the differentiation defect is not due to a proliferation block at this critical stage. Overall, we find that UBE3D levels are downregulated during the course of adipocyte differentiation but that Ube3d knockout impairs the ability of committed 3T3-L1 preadipocytes to successfully mature.
Depletion of CPSF73 in UBE3D KO cells contributes to the adipogenesis defect.
To confirm that loss of UBE3D protein was responsible for the differentiation defect observed in Ube3d-KO cells, we generated stable overexpression lines in both the WT or Ube3d-KO background using a Sleeping Beauty transposon system (30, 31). Cells that successfully integrated a doxycycline-inducible Ube3d overexpression cassette or a control expressing mCherry were isolated using puromycin. Induction of Ube3d overexpression was initiated by treatment with doxycycline 4 days before the start of the differentiation protocol, and at day 0, the levels of the overexpressed proteins were detectable by Western blotting (Fig. 3A). Withdrawal of doxycycline prior to differentiation allowed for a gradual reduction of UBE3D protein similar to what is seen in WT cells (Fig. 3B). We found that overexpressing Ube3d in this manner was able to robustly rescue differentiation of Ube3d-KO cells (Fig. 3C), indicating that the observed defect is a direct result of UBE3D depletion. Interestingly, UBE3D overexpression also increased the number of fat-producing WT cells.
FIG 3.

Ube3d or CPSF73 complementation rescues differentiation in Ube3d-KO cells. (A) UBE3D and CPSF73 levels in undifferentiated WT and Ube3d-KO cells overexpressing mCherry, UBE3D, and CPSF73. Cells were grown in log phase and treated with doxycycline to induce overexpression for 4 days before collection. Representative blots are shown. (B) Withdrawal of doxycycline prior to the start of differentiation allows for a gradual decrease in overexpressed UBE3D protein levels. Ube3d-KO cells with the doxycycline-inducible UBE3D cassette were treated with doxycycline for 4 days before the start of differentiation. On day −2, when cells reach confluence, doxycycline was withdrawn, and the cells were differentiated. (C) UBE3D and CPSF73 overexpression rescues differentiation of Ube3d-KO cells. Representative wells with Oil Red O staining on day 10 are shown. (D) CPSF73 levels are decreased in Ube3d-KO cells. Representative blots of UBE3D and CPSF73, along with total protein staining as a loading control, are shown. (E) Quantification of CPSF73 levels from three independent experiments graphed as CPSF73 signal normalized to tubulin. Mean ± SEM; ***, P = 0.0004 (two-tailed t test) (F) Markers of adipocyte differentiation PPARγ2 and FABP4 are decreased in Ube3d-KO control cells overexpressing mCherry on day 7 of differentiation but restored by UBE3D overexpression. CPSF73 overexpression partially rescues FABP4 levels. The ubiquitously expressed PPARγ1 isoform is also detected by the antibody. Representative blots are shown. (G) Quantification of the PPARγ2 signal from two replicates is shown normalized to the WT.
We have previously shown in other model systems that Ipa1/UBE3D helps regulate CPSF73 protein levels (12, 13, 20). Here as well, we observed that CPSF73 levels are notably decreased in Ube3d-KO 3T3-L1 cells (Fig. 3D and E). To assess whether the decline in total levels of CPSF73 is contributing to the inability of Ube3d-KO 3T3-L1 cells to differentiate, we generated CPSF73-overexpressing cells, also using the Sleeping Beauty transposon system. Overexpression of CPSF73 also increased the number of fat-producing WT cells and restored the adipogenic capacity of Ube3d-KO cells, though not as robustly as with Ube3d (Fig. 3C). The reason for this poorer rescue is not clear, and it is possible that UBE3D may also modulate the levels of other proteins that contribute to efficient differentiation. Levels of the mature adipocyte marker FABP4 are markedly decreased in the Ube3d-KO control cells on day 7 but are rescued by overexpression of Ube3d and partially by CPSF73 (Fig. 3F). PPARγ2 levels were partially rescued by Ube3d overexpression but not by CPSF73 overexpression (Fig. 3F and G). By comparison, PPARγ1, the isoform which is ubiquitously expressed (32), is unchanged. Together, these results suggest that positive regulation of CPSF73 levels by UBE3D promotes preadipocyte differentiation.
UBE3D knockout leads to downstream poly(A) site usage and readthrough transcripts.
Given the central role of CPSF73 as the endonuclease subunit of the cleavage and polyadenylation complex and our previous findings that UBE3D regulated mRNA 3′-end processing in HEK293 and MDA-MB-231 cells (20), we hypothesized that Ube3d knockout would lead to mRNA 3′-end processing defects in 3T3-L1 preadipocytes. To explore changes to mRNA processing in Ube3d-KO 3T3-L1 cells, we isolated RNA from WT and Ube3d-KO cells during log-phase growth and performed mRNA sequencing. We used APAlyzer to quantify alternative poly(A) site usage in the 3′ UTR of genes (33). APAlyzer is a bioinformatics program that correlates changes in transcriptome sequencing (RNA-seq) read density with positions of annotated poly(A) sites and calculates a relative expression difference (RED) score for each gene, where positive values indicate lengthening and negative values indicate shortening. We found an overall predominant shift to downstream poly(A) site use (1,051 lengthened genes, mean RED score, 0.87; 143 shortened genes, mean RED score, −0.46), consistent with an mRNA processing defect causing bypass of upstream poly(A) sites (Fig. 4A and B). As an example, we plotted read coverage of a gene that shows a positive RED score of 0.617 (Padj = 0.032), high-density lipoprotein binding protein (Hdlbp), and observed a marked increase in read coverage downstream of a promoter-proximal poly(A) site in the 3′ UTR (Fig. 4C). To corroborate these findings, we quantified changes in proximal poly(A) site use using PAQR, an alternative pipeline (34), and observed an overall shift toward increased terminal exon length (Fig. 4D). The APA analyses support a conclusion that Ube3d-KO causes changes in mRNA profiles in the 3T3-L1 cell line typical of a defect in 3′ processing, as was seen in our previous examination of Ube3d in other cell lines (20).
FIG 4.

RNA-seq shows that Ube3d-KO causes shifts to downstream poly(A) site use. (A) RNA sequencing of undifferentiated WT and Ube3d-KO cells was analyzed using APAlyzer to quantify alternative polyadenylation in the 3′ UTR (3′UTR APA). Relative expression difference (RED) scores are plotted for each gene, where a positive score indicates 3′ lengthening, and a negative score indicates shortening. Genes with significant changes (P < 0.05) are highlighted (positive RED scores, indicating lengthening, in pink; negative RED scores, indicating shortening, in teal). (B) RED scores (shown as log2 fold changes) calculated by APAlyzer for genes categorized as lengthened, shortened, or undergoing no significant change. (C) Coverage plot for Hdlbp showing 3′-UTR lengthening (RED = 0.617; Padj = 0.032). The upstream poly(A) site considered by APAlyzer is shown with a dashed vertical line. Three biological replicates are overlaid to show areas with common coverage, with read counts given on the y axis. (D) Volcano plot showing terminal exon length differences for each gene calculated by PAQR.
It is well documented that a defect in cleavage caused by CPSF73 inactivation leads to readthrough transcripts (21, 35, 36). We therefore looked for signs of a cleavage defect in UBE3D KO cells by quantifying reads mapping to downstream of gene (DoG) regions, which represent readthrough of the terminal poly(A) site and inappropriate transcription in intergenic regions, using DoGFinder (37). Although most of these transcripts are likely to be unadenylated and rapidly degraded, the program was able to identify DoG regions with both increased (333 total) and decreased (284) read counts in Ube3d-KO cells. We noticed that changes in upstream gene expression explained some of the variation observed in the corresponding DoG regions (Fig. 5A). Nevertheless, we noted that there were several genes that showed a large increase in DoG read counts in Ube3d-KO (log2 fold change > 1) but very little or no increase in gene expression (Fig. 5A, inset). We confirmed that these DoGs display a coverage profile characteristic of poly(A) site readthrough, and representative examples of this pattern are shown in the DoG regions for Rpl19 and Src (Fig. 5B).
FIG 5.

Ube3d knockout leads to readthrough transcripts. (A) Relationship between change in gene expression and change in DoG read counts. DoGs with significantly increased or decreased read counts (absolute value of log2 fold change > 0.5; Padj < 0.05) are shown in orange and blue, respectively. A cluster of DoG-gene pairs with significantly increased DoG levels in Ube3d-KO cells but little or no increase in gene expression are found in the region highlighted by the inset. (B) Coverage plots for Rpl9 and Src DoG regions (black bars, bottom). For each DoG region, read counts are shown on a logarithmic scale [ln(read counts + 1)], and three biological replicates are overlaid to show regions with shared coverage.
GO term enrichment analysis of genes whose mRNAs were lengthened and shortened revealed enrichment of a diverse set of ontology terms (Fig. 6A). “Metabolism of RNA” was the highest-scoring term for lengthened genes, while the top categories for shortened genes were “Regulation of actin filament depolymerization” and “Protein modification by small protein conjugation or removal.” There was no clear indication based on ontology enrichment that the alternative polyadenylation elicited by Ube3d KO contributes directly to the block to differentiation. In some cell models and tissues, shortening of mRNAs is associated with an increase in gene expression, while the reverse is observed upon lengthening (1). However, in the Ube3d-KO cells, changes in poly(A) site use (APAlyzer RED score) were not correlated with a corresponding change in gene expression (Fig. 6B), suggesting that multiple mechanisms are in play to determine the final mRNA level.
FIG 6.
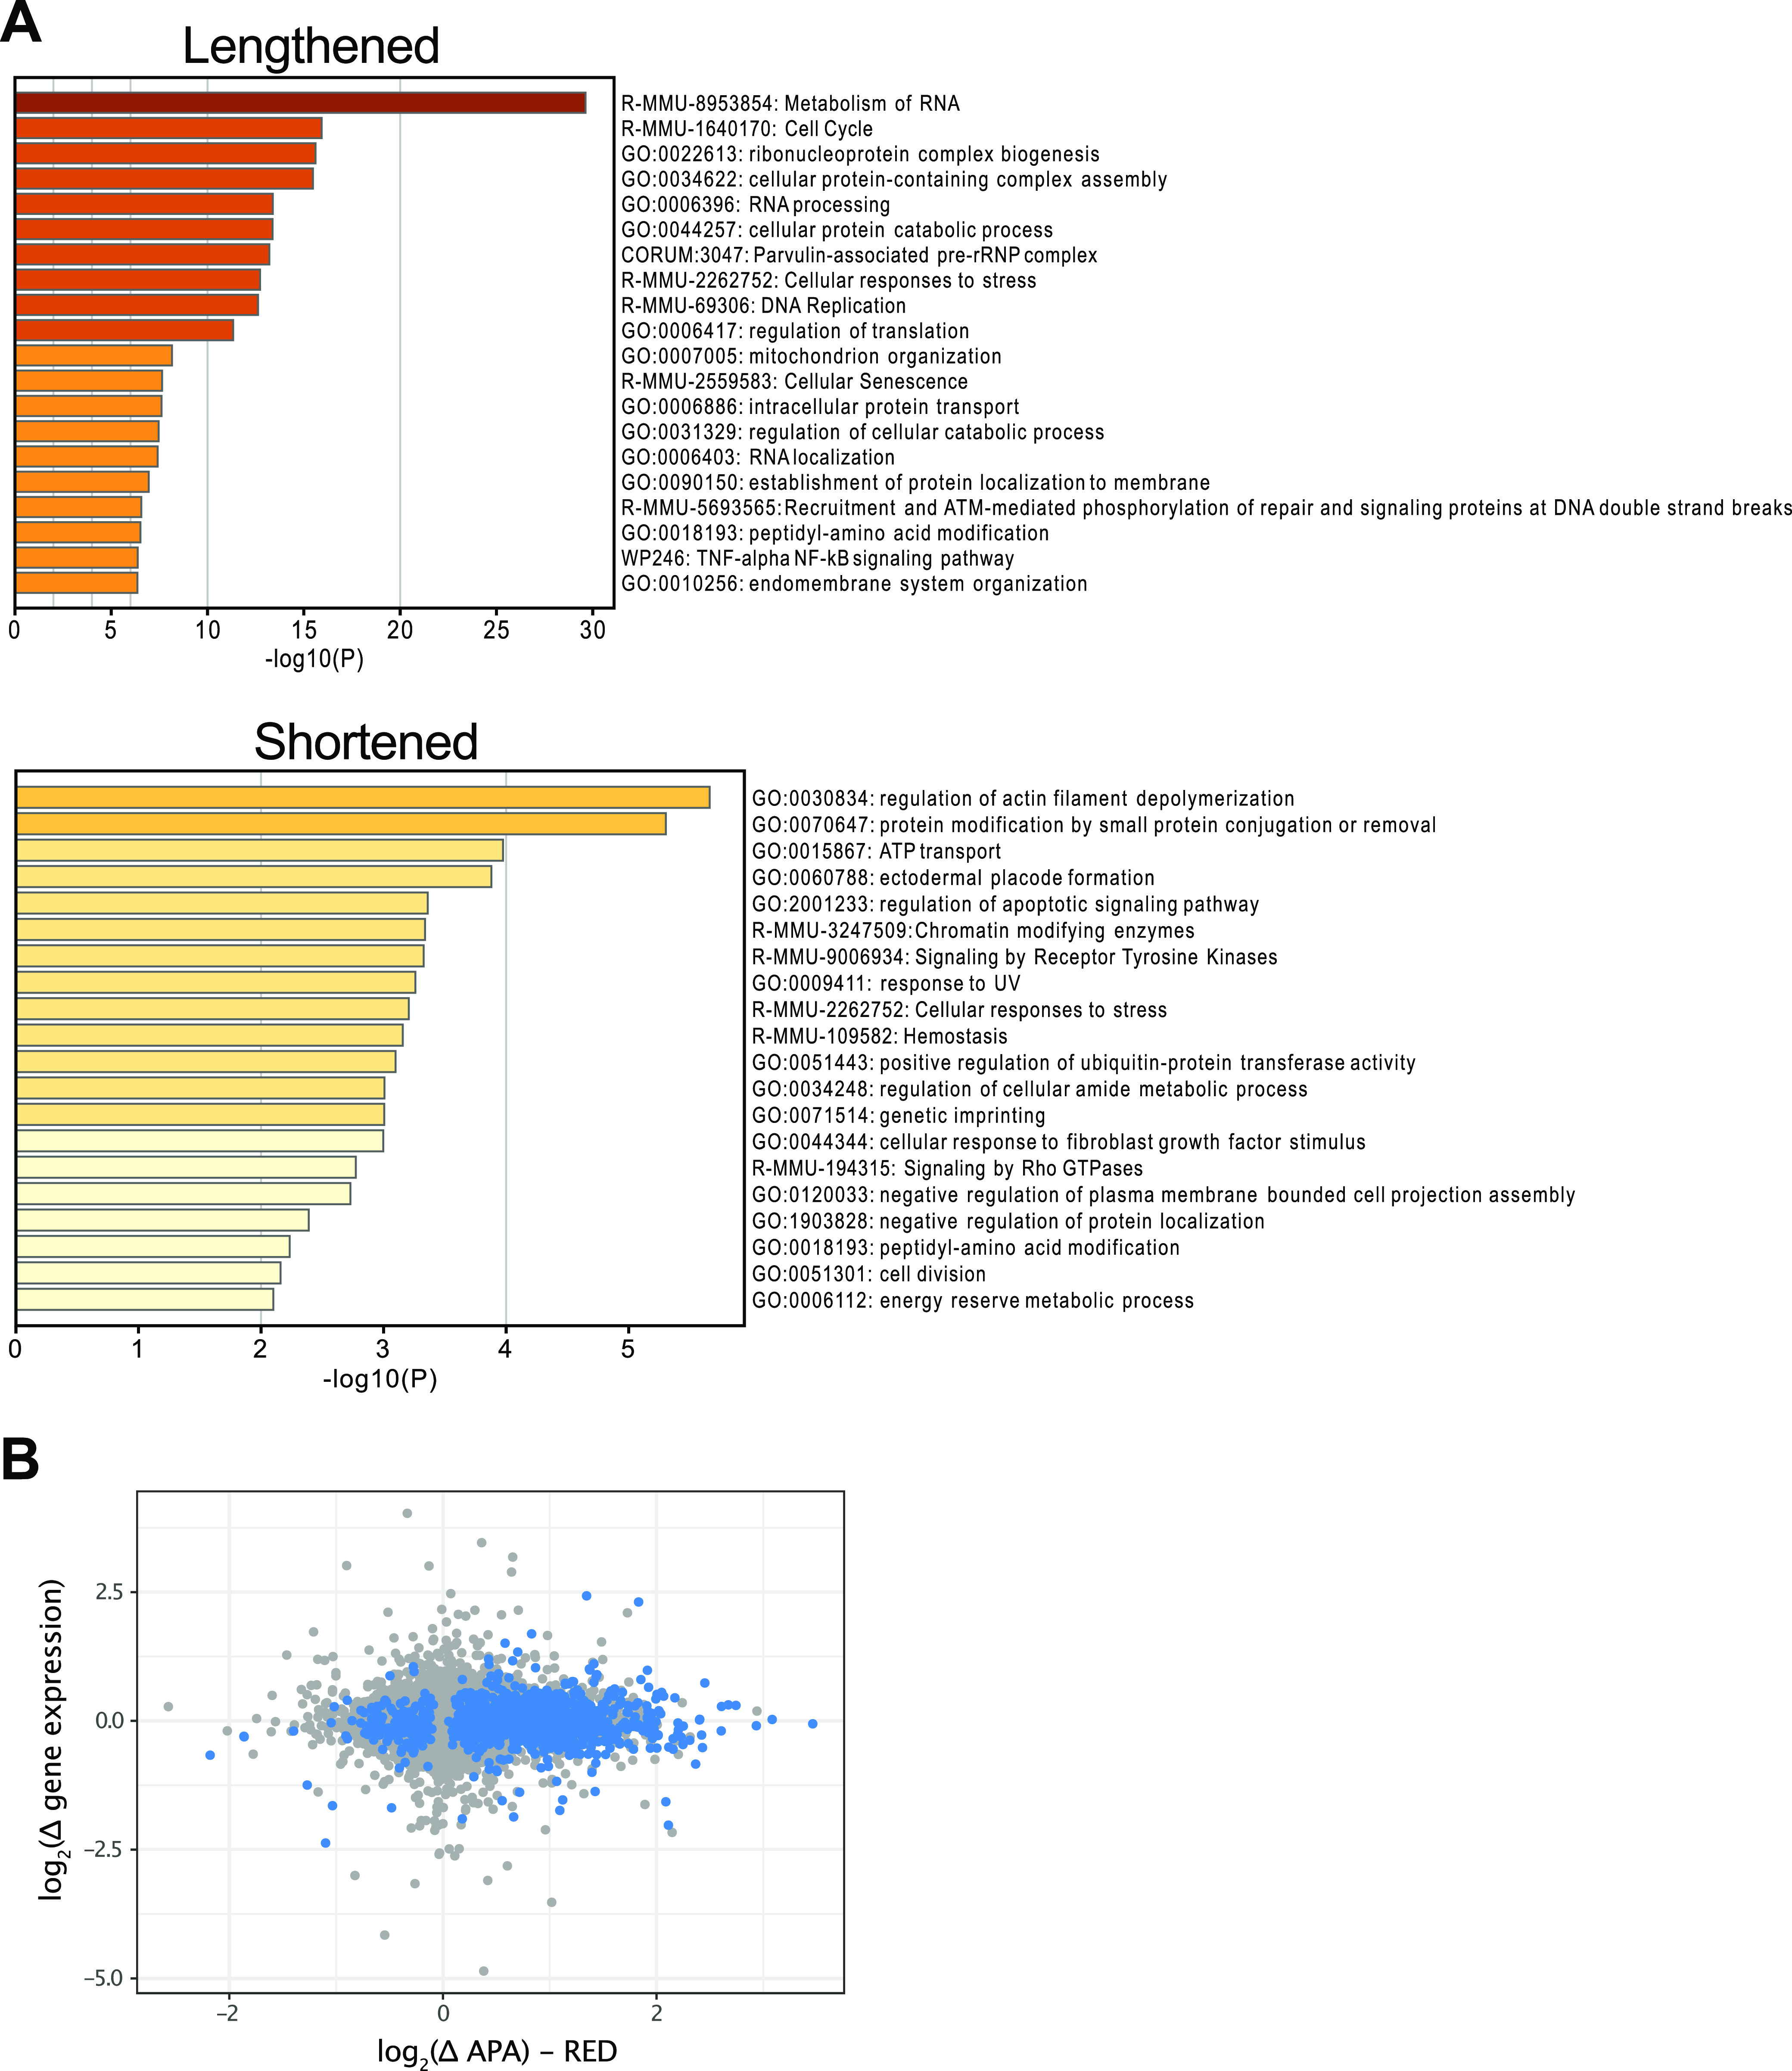
Analysis of ontology enrichment for genes with altered poly(A) site use and the relationship to changes in gene expression. (A) GO term enrichment of genes whose mRNAs were lengthened or shortened in the Ube3d-KO cells. Gene sets were uploaded to Metascape and analyzed for enrichment using gene lists from PaGenBase. Enriched gene lists with greater than 3 terms in the uploaded set, P values of <0.01, and an enrichment factor of >1.5 were clustered based on membership similarity and graphed according to P value. (B) Alternative polyadenylation (quantified by APAlyzer RED score) is not correlated with gene expression changes. Log2-transformed difference in RED or gene expression between KO and WT cells are graphed on the x and y axis, respectively. Genes with RED P values of <0.05 are highlighted in blue.
UBE3D loss alters the 3T3-L1 adipocyte-committed state.
Regarding gene expression changes in the Ube3d-KO cells, we found 478 significantly upregulated genes and 419 significantly downregulated genes in Ube3d-KO cells compared to WT (Fig. 7A), with downregulated genes showing an overall greater reduction in expression. GO term enrichment analysis showed that downregulated genes were enriched for ontology terms related to lipid and steroid biosynthesis, which are characteristic of adipocyte metabolic pathways (Fig. 7B). Upregulated genes were enriched for GO terms related to neurogenesis and axonogenesis (Fig. 7C). The list of downregulated genes is enriched for genes annotated as specific to both mouse embryonic fibroblasts and 3T3-L1 cells, and the upregulated gene set is enriched for a brain-specific signature (Fig. 7D). These results suggest that Ube3d-KO cells are displaying a dysregulated differentiation program where genes involved in adipocyte biology are downregulated and neuronal-lineage genes are being inappropriately expressed.
FIG 7.

RNA-seq shows an altered gene expression profile and dysregulated gene signatures. (A) Volcano plot showing genes with increased expression (right quadrant, magenta) and decreased expression (left quadrant, teal). (B) GO term enrichment of downregulated genes. (C) GO term enrichment for upregulated genes. In panels B and C, enrichment maps were generated using the R packages clusterProfiler and enrichplot. Nodes represent enriched GO terms (colored by adjusted P value), and edges represent the Jaccard similarity coefficient between two nodes. Representative terms are labeled from each cluster. (D) Enrichment for tissue- and cell-specific gene lists in downregulated genes (top) and upregulated genes (bottom). Gene sets were uploaded to Metascape and analyzed for enrichment using gene lists from PaGenBase. Enriched gene lists with greater than 3 terms in the uploaded set, a P value of <0.01, and an enrichment factor of >1.5 were clustered based on membership similarity and graphed according to P value.
3T3-L1 cells represent committed adipocyte precursor cells, and previous work has identified genes that define this lineage commitment (38). We analyzed the list of genes enriched in adipogenic 3T3 cells reported by Gupta et al. (38) and found that many are also downregulated in Ube3d-KO cells (Fig. 8A). Expression of the critical regulator of preadipocyte commitment Zfp423 is also significantly decreased in Ube3d-KO cells, as well as expression of two genes with documented roles during adipocyte differentiation (38, 39), Ebf2 and Cebpd (Fig. 6B). We confirmed that protein levels of several of these factors, including C/EBPδ, HGFɑ, GPRIN3, LPL, and EFEMP1, are also decreased in Ube3d-KO cells and that some of these (in particular, C/EBPδ, HGFɑ, LPL, and EFEMP1) are rescued by Ube3d or CPSF73 overexpression (Fig. 8C). SLPI and ZFP423 protein levels do not display a similar pattern despite having decreased mRNA expression in KO cells, indicating that additional regulatory mechanisms affecting translation and/or protein stability and degradation may be involved. In conclusion, we find that loss of UBE3D leads to decreased expression of markers known to indicate a committed preadipocyte state and that protein levels of many of these markers are correlated with the ability of the cells to differentiate into mature adipocytes.
FIG 8.

Ube3d KO cells exhibit decreased markers of committed adipocyte precursors. (A) A subset of genes shown by Gupta et al. (38) to be depleted in nonadipogenic 3T3 cells (reported fold change values in open circles) are also downregulated in Ube3d-KO cells [gray bars; genes with log2(fold change) of less than −0.5 and adjusted P value of <0.05 are marked with asterisks]. (B) Genes with known roles in the regulation of adipogenesis also exhibit decreased expression. (C) Some genes showing decreased RNA levels show decreased total protein levels in Ube3d-KO cells (C/EBPδ, HGFɑ, EFEMP1, and LPL), which are restored upon overexpression of UBE3D or CPSF73. Other genes do not show a similar change (ZFP423, SLPI, and GPRIN3). Representative Western blots are shown.
DISCUSSION
Advances over the last 2 decades have uncovered a variety of mechanisms governing the differentiation of adipogenic precursors into mature adipocytes (39, 40). Recent attention has been directed toward defining gene expression signatures for progenitor cell subtypes (41), but mRNA 3′-end processing has not been carefully examined as a possible regulatory mechanism. In this work, we show that UBE3D is necessary for the ability of 3T3-L1 cells to differentiate into mature adipocytes. We demonstrate that protein levels of its putative binding partner (42, 43), the highly conserved RNA endonuclease CPSF73, are significantly decreased in Ube3d-KO cells and that overexpression of CPSF73 can rescue the differentiation defect. Consistent with the loss of CPSF73, UBE3D depletion in 3T3-L1 cells leads to an overall shift to use of downstream poly(A) sites and increased readthrough transcription into intergenic regions. These effects are in agreement with our study of mutation of IPA1, the yeast UBE3D homolog, and of others on loss or inactivation of CPSF3 in mammalian cells (20, 21, 36). UBE3D depletion also caused gene expression changes indicating a shift away from the preadipogenic state. These data support a model where UBE3D is needed to maintain proper mRNA 3′-end processing capacity, which, in turn, is necessary for maintenance of committed adipocyte precursors.
Alternative polyadenylation (APA) has an increasingly appreciated role in regulating stem cell proliferation and commitment in other cellular contexts (6). Generally, highly proliferative stem cells tend to favor promoter-proximal poly(A) sites leading to shorter 3′ UTRs, while differentiation has been shown to lead to 3′ UTR lengthening in models of embryonic development, myogenesis, and neurogenesis. We find that the impairment in adipogenic differentiation and inappropriate expression of neuron-specific genes in Ube3d knockout cells is accompanied by an overall shift to use of downstream poly(A) sites. Loss of CPSF73 function has also previously been reported to induce readthrough transcription into intergenic regions (21, 36), and we see this effect in Ube3d-KO cells as well.
The shift to downstream poly(A) sites and the decrease in expression of many genes that we observe with UBE3D loss could be directly due to depletion of CPSF73. The decrease in processing capacity could disfavor upstream poly(A) sites that are thought to generally have weaker poly(A) signals (44). Lengthening of the gene's 3′ UTR may alter the stability or translation of mRNAs of pro- and antiadipogenic genes and thus affect the commitment of 3T3-L1 preadipocytes. Increased expression of downstream UTR sequences could also act as a sink for microRNAs (miRNAs), as has been shown in cancer models (45–47), leading to increased expression of antiadipogenic genes in competing endogenous RNA (ceRNA) networks regulated by specific miRNAs. The complex network of interactions between changes in poly(A) site use and trans-acting factors such as microRNAs and RNA binding proteins makes interpreting alternative polyadenylation shifts and predicting their effects on the transcriptome difficult (4). In our study, we do not find a correlation between APA changes and differences in gene expression between WT and Ube3d-KO cells (Fig. 6B), underscoring that cleavage and polyadenylation are just one of a wide array of regulatory mechanisms which affect mRNA steady-state levels. An alternative hypothesis for the effects of UBE3D on preadipocyte commitment is that the processing of the major poly(A) sites of critical genes may be uniquely susceptible to CPSF73 depletion, leading to insufficient steady-state levels of these mRNAs. Further studies will be needed to address these possibilities.
The importance of mRNA 3′-end processing for proper gene expression has contributed to interest in its use as a druggable process for various pathologies (35, 48), but the potential for negative consequences on critical physiological processes such as differentiation may prove to be a hurdle in developing small molecule inhibitors with minimal off-target effects in vivo. On the other hand, drugs which stimulate differentiation or regeneration of specific precursor cell populations by modifying APA profiles may be helpful (6). The proliferative activity of adipocyte precursor cells is critical for maintenance of adipose tissue plasticity, the loss of which has been associated with the functional decline in adipose tissue seen in obesity and aging (41). Further exploration of the role of 3′-end processing across different stages of adipogenesis is necessary to improve our understanding of how cells regulate gene expression during lineage commitment and differentiation.
MATERIALS AND METHODS
Cell culture.
3T3-L1 cells (ATCC CL-173) were cultured in Dulbecco’s modified Eagle medium (DMEM; high glucose; 4.5 g/L) supplemented with 10% fetal bovine serum (FBS) and antibiotics (100 U/mL penicillin, 100 μg/mL streptomycin). All cells were grown at 37°C with 5% CO2. Cells were subcultured every 2 to 3 days according to ATCC guidelines and never allowed to reach more than 80% confluence.
For differentiation experiments, 3T3-L1 cells were plated at a density of 1.0 × 10⁴ cells/cm2 and allowed to reach 100% confluence (day −2). The cells were maintained for an additional 2 days to allow for contact inhibition. On day 0, the cells were treated with freshly prepared methylisobutylxanthine, dexamethasone, and insulin (MDI) induction medium, which consisted of growth medium containing 0.5 mM 3-isobutyl-1-methylxanthine, 1 μM dexamethasone, 5 μg/mL insulin, and 1 μM rosiglitazone. On day 2, the MDI induction medium was replaced with insulin medium (growth medium containing 5 μg/mL insulin). On day 4, insulin medium was replaced with fresh medium (without additives).
Staining and immunofluorescence.
For Oil Red O staining, cells were washed briefly with phosphate-buffered saline (PBS) and then fixed with 4% formaldehyde in PBS for 1 h at room temperature. After fixing, the cells were washed once with PBS, then with 60% isopropanol, and then dried. A 0.5% (wt/vol) stock solution of Oil Red O (Sigma; catalog no. O0625) in isopropanol was prepared by stirring overnight and then underwent filtration through a 0.2-μm filter. Fresh working solution was prepared by diluting 6 parts of stock solution with 4 parts distilled water, incubating the solution for 20 min at room temperature, followed by an additional filtration. After incubation in working solution for 1 to 2 h, cells were washed extensively with filtered water, dried, and photographed.
For immunofluorescence staining, cells were plated on glass slides with removable plastic wells and cultured as described above, for three biological replicates. After 24 h, cells were washed with PBS, fixed in 10% formalin for 15 min at room temperature, and incubated in ice-cold methanol for 10 min. After three washes with PBS, slides were incubated in normal donkey block (NDB; 10% normal donkey serum [vol/vol], 5% nonfat powdered milk [wt/vol], 4% bovine serum albumin [wt/vol], and 0.1% Triton X-100 [vol/vol] in PBS) for 15 min at room temperature. Slides were incubated for 45 min in NDB containing primary antibodies diluted 1:200. The antibodies used were mouse anti-Ki-67, clone B56 (BD Pharmingen; catalog no. 556003), and anti-histone H3 (phospho S10) antibody (Abcam, ab47297). Slides were washed with PBS and then incubated in species-specific fluorophore-conjugated secondary antibodies diluted 1:250 in NDB for 45 min. After additional washes with PBS, cells were incubated in 1× DAPI (4′,6-diamidino-2-phenylindole) in PBS for 10 min and cover-slipped in NPG (0.5% N-propyl gallate in 90% glycerol) mounting media. Cells were imaged on a Zeiss LSM800 confocal microscope. The percentages of Ki-67—or pHH3—positive cells were quantified using CellProfiler.
CRISPR/Cas9 knockout.
Ube3d knockout in 3T3-L1 cells was performed using CRISPR/Cas9 according to the protocol by Ran et al. (49). Guide RNA sequences targeting mouse Ube3d (see Table S1 in the supplemental material) were designed using CHOPCHOP software (http://chopchop.cbu.uib.no/) and cloned into pSpCas9(BB)-2A-GFP, which was a gift from Feng Zhang (Addgene plasmid number 48138; http://n2t.net/addgene:48138; RRID Addgene_48138). After transfection, GFP-positive cells were flow-sorted and isolated into single-cell clones and then expanded and screened for successful disruption of the Ube3d gene using Sanger sequencing of genomic DNA, as well as Western blotting, to confirm the absence of UBE3D protein. Use of sgRNA mUBE3D Exon5_sgRNA yielded a CDS-disrupting indel in exon 5, in which the sequence AGTCATTTGTAAGCGTTGCAAGGTAACGTTGGGAGAGAC was altered to AGTCATTTGTAAGCGTTGCAAGGT-ACGTTGGGAGAGAC.
Plasmids, transfection, and overexpression.
pSBtet-GP was a gift from Eric Kowarz (Addgene plasmid number 60495; http://n2t.net/addgene:60495; RRID Addgene_60495). Mouse Ube3d (GenBank accession no. NM_027394) or human CPSF73 (GenBank accession no. NM_016207) were subcloned into pSBtet-GP following the strategy described by Kowarz et al. (30) to produce pSBtet-Ube3d and pSBtet-CPSF73, respectively. mCherry was subcloned from pLV[Exp]-Puro-EF1A>mCherry (vector ID VB900084-0158zxv; VectorBuilder; Chicago, IL) into pSBtet-GP to produce pSBtet-mCherry, which served as a control in overexpression experiments. pCMV(CAT)T7-SB100 was used as a helper vector to supply the Sleeping Beauty transposase. pCMV(CAT)T7-SB100 was a gift from Zsuzsanna Izsvak (Addgene plasmid number 34879; http://n2t.net/addgene:34879; RRID Addgene_34879). Each pSBtet plasmid was mixed 9:1 with helper plasmid in Opti-MEM (Gibco; catalog no. 31985062). Transfection was performed using Lipofectamine 3000 (Invitrogen; catalog no. L3000001) according to the manufacturer’s instructions.
Two days after transfection, selection for cells that had successfully integrated the Sleeping Beauty cassette was performed using puromycin (2 μg/mL in growth medium, replaced every other day for at least 6 days). Successful selection was confirmed by monitoring the percentage of green fluorescent protein (GFP)-positive cells. To induce overexpression, cells were cultured in fresh growth media with 1.5 μg/mL doxycycline for 4 days before the start of the differentiation protocol described above.
RT-qPCR.
The extraction and purification of total RNA were performed using Ambion TRIzol reagent (Invitrogen; catalog no. 15596018) according to the manufacturer’s protocol. RNA concentration and quality were determined using a NanoDrop 2000 spectrophotometer before downstream processing. Reverse transcription of isolated RNA was performed using SuperScript IV reverse transcriptase (Thermo Fisher Scientific; catalog no. 18090010) according to the manufacturer’s instructions. qPCR was performed on a CFX96 Touch real-time PCR detection system in 96-well plates with the primers listed in Table 1. cDNA was added to SsoAdvanced Universal SYBR green supermix (Bio-Rad; catalog no. 1725274) in a total reaction volume of 10 μL, and qPCR was carried out according to the manufacturer’s instructions. Target gene expression was normalized to that of mouse 18S rRNA. Comparative threshold cycle (ΔΔCT) methods were used for the quantification of qPCR results.
TABLE 1.
Oligonucleotide and antibody resources used in this study
| Resource | ID or catalog no. | Additional information (sequence or concn used) |
|---|---|---|
| sgRNA for Ube3d KO | mUBE3D Exon2_sgRNA | CGAGATCCGACTTCCAGCAGGGG |
| mUBE3D Exon5_sgRNA | TAAGCGTTGCAAGGTAACGTTGG | |
| Primers for genotype sequencing | mUBE3D-Exon 2-F | GCAAGCCCTGCCTGATCTAA |
| mUBE3D-Exon 5-F | TCAGCAATGCTAGGATTGCCA | |
| 18S qPCR primers | 18S_F | ACCGCAGCTAGGAATAATGGA |
| 18S_R | GCCTCAGTTCCGAAAACCA | |
| Ube3d qPCR primers | mUBE3D_F | GCAGAGTGCGCTGCTAATC |
| mUBE3D_R | CTGGAAGTCGGATCTCGGT | |
| PparγqPCR primers | PPARg_F | CTCCAAGAATACCAAAGTGCGA |
| PPARg_R | GCCTGATGCTTTATCCCCACA | |
| Cebpa primers | C/EBPa_F | TTGTTTGGCTTTATCTCGGC |
| C/EBPa_R | CCAAGAAGTCGGTGGACAAG | |
| Fabp4 primers | FABP4_F | AAGGTGAAGAGCATCATAACCCT |
| FABP4_R | TCACGCCTTTCATAACACATTCC | |
| Cfd (adipsin) primers | Adipsin_F | CATGCTCGGCCCTACATGG |
| Adipsin_R | CACAGAGTCGTCATCCGTCAC | |
| Adipoq (adiponectin) primers | Adiponectin_F | TGTTCCTCTTAATCCTGCCCA |
| Adiponectin_R | CCAACCTGCACAAGTTCCCTT | |
| Alpha-tubulin monoclonal antibody (YOL1/34) | MA1-80189 (PaGenBase) | 1:3,000 |
| Anti-A-FABP antibody (B-4) | sc-271529 (Santa Cruz) | 1:150 |
| Anti-C/EBP α antibody (D-5) | sc-365318 (Santa Cruz) | 1:100 |
| Anti-C/EBP δ antibody (D-1) | sc-515028 (Santa Cruz) | 1:100 |
| Anti-CPSF3 antibody (C-3) | sc-393001 (Santa Cruz) | 1:1,000 |
| Anti-fibulin-3 antibody (mab3-5) | sc-33722 (Santa Cruz) | 1:100 |
| Anti-HGFα antibody (H-10) | sc-374422 (Santa Cruz) | 1:100 |
| Anti-LPL antibody (F-1) | sc-373759 (Santa Cruz) | 1:100 |
| Anti-OAZ (E-6) mouse MAba | sc-393904 (Santa Cruz) | 1:150 |
| Anti-PPARγ antibody (E-8) | sc-7273 (Santa Cruz) | 1:500 |
| Anti-SLPI antibody (A-11) | sc-374575 (Santa Cruz) | 1:100 |
| GPRIN3-specific polyclonal antibody | 20212-1-AP (Proteintech) | 1:500 |
| Human/mouse EBF-2 antibody | AF7006 (R&D Systems) | 1:500 |
| UBE3D polyclonal antibody | PAB21883 (Abnova) | 1:250 |
MAb, monoclonal antibody.
Western blotting.
Cells were lysed with radioimmunoprecipitation assay (RIPA) buffer (150 mM sodium chloride, 50 mM Tris-HCl, pH 7.4, 1% Nonidet P-40, 0.1% SDS, 5 mM EDTA, and 0.1% sodium deoxycholate) supplemented with Halt protease inhibitor cocktail (Thermo Fisher Scientific; catalog no. 87786) and phosphatase inhibitors (1 mM dithiothreitol [DTT], 10 mM sodium fluoride, 200 μM sodium orthovanadate, 1 mM sodium pyrophosphate, and 10 mM β-glycerophosphate). The lysate was collected into a microcentrifuge tube, homogenized by brief vortexing, and cleared by centrifugation at 14,000 × g for 15 min at 4°C. Protein concentration was determined using the Pierce Rapid Gold bicinchoninic acid (BCA) protein assay kit (Thermo Scientific; catalog no. A53225). We added 6× SDS sample buffer (0.375 M Tris, pH 6.8, 0.12 g/mL SDS, 60% [vol/vol] glycerol, 2% [vol/vol] β-mercaptoethanol, and 0.6 mg/mL bromophenol blue), and the samples were subsequently heated to 95°C for 10 min.
Protein was resolved on a 10% Bis-Tris gel [0.33 M bis(2-hydroxyethyl)amino-tris(hydroxymethyl)methane, 10% acrylamide–bis-acrylamide] using MOPS running buffer (50 mM 3-morpholinopropane-1-sulfonic acid, 50 mM Tris base, 0.1% SDS, and 1 mM EDTA) and transferred to polyvinylidene difluoride (PVDF) membranes using the Trans-Blot Turbo transfer system (Bio-Rad, Hercules, CA). Total protein was assayed using the Revert total protein stain (LI-COR; catalog no. 926-11021) and imaged with the LI-COR Odyssey DLx imaging system. Blocking was performed using either 5% milk in Tris-buffered saline with Tween 20 (TBST) for 1 h, 5% bovine serum albumin (BSA) in TBST for 1 h, or EveryBlot blocking buffer (Bio-Rad; catalog no. 12010020) for 5 min, followed by incubation in primary antibody overnight at 4°C. Refer to Table S1 for a list of antibodies used. After 3 washes in TBST, membranes were incubated in species-specific horseradish peroxidase (HRP)-coupled secondary antibodies for 1 h at room temperature, washed, and incubated in SuperSignal West Pico Plus (Thermo Scientific; catalog no. 3457) for 5 min before imaging.
RNA sequencing.
RNA from log-phase cells was collected using the Quick-RNA miniprep kit (Zymo Research). Sample quality control (QC), library preparation, and sequencing were performed by the UCLA Technology Center for Genomics & Bioinformatics (Los Angeles, CA). All samples had a RINe of >9.6 (RNA ScreenTape analysis; Agilent). Library preparation was performed using a Kapa stranded RNA-seq kit with rRNA depletion and sequenced using a 2 × 150-bp paired-end protocol to up to 80 million reads per sample on an Illumina NovaSeq 6000.
Reads were aligned to the Mus musculus genome (mm10, GRCm38) using STAR (v2.6.1d) (50) and quantified using featureCounts (v1.6.3) (51). Differential gene expression analysis was performed in R: we used tidybulk (v1.2.1) as a framework for data exploration and analysis and employed DEseq2 (v1.30.1) (52) as the back-end algorithm for computing fold change values and associated statistics. Ontology enrichment analysis was performed using clusterProfiler (v3.16.1) (53) and Metascape (54). Enrichment maps were generated using enrichplot (v1.10.2). We performed APA analysis using APAlyzer (v1.5.5) (33), as well as with PAQR (34). DoG regions were defined using DoGFinder (1.0.1) (37). To determine changes in read counts in DoG regions between WT and KO conditions, we quantified reads mapping to each DoG using featureCounts and then calculated fold changes using DESeq2 with log2 fold change shrinkage using ashr (55).
Quantification and statistical analysis.
Data are presented as mean ± standard error of the mean (SEM) unless otherwise noted. All quantitative experiments were performed in biological triplicate. Quantification of Revert total protein stain signal was performed in ImageStudio Lite (v5.2.5, LI-COR). Statistical analysis and graphing were performed using GraphPad Prism Software version 9.3.1 for Mac (GraphPad Software, San Diego, California, USA; https://www.graphpad.com/).
Data availability.
RNA sequencing data from this study are available in the Gene Expression Omnibus (GEO) database under accession number GSE202310.
ACKNOWLEDGMENTS
We acknowledge the Tufts University High Performance Compute Cluster (https://it.tufts.edu/high-performance-computing), which was utilized for the research reported in this paper. We thank Rebecca E. Batorsky at Tufts Technology Services for the help of RNA-seq data processing and Joel Graber for thoughtful discussion regarding analysis of RNA-seq data, as well as implementation of the APAlyzer and PAQR platforms. Matthew Zunitch provided invaluable expertise and technical assistance with immunofluorescent staining and subsequent quantification, for which we are deeply grateful. We also thank all members of the Moore laboratory for discussions and comments on the manuscript.
This work was supported by grants from the National Institutes of Health, USA (5R01AI152337 to C.L.M.), and the National Science Foundation (MCB-1244043 to C.L.M.).
Contributions of the authors to this article using the Contributor Roles Taxonomy (CRediT) are as follows: Daniel Heller-Trulli, Conceptualization (supporting), Formal Analysis (lead), Investigation (equal), Software (lead), Visualization (lead), Writing – Original Draft Preparation (lead), and Writing – Review & Editing (supporting). Huiyun Liu, Conceptualization (lead), Investigation (equal), Visualization (supporting), and Writing – Review & Editing (supporting). Srimoyee Mukherjee, Investigation (supporting) and Writing – Review & Editing (supporting). Claire L. Moore, Conceptualization (supporting), Funding Acquisition (lead), Supervision (lead), and Writing – Review & Editing (lead).
REFERENCES
- 1.Tian B, Manley JL. 2017. Alternative polyadenylation of mRNA precursors. Nat Rev Mol Cell Biol 18:18–30. 10.1038/nrm.2016.116. [DOI] [PMC free article] [PubMed] [Google Scholar]
- 2.Neve J, Patel R, Wang Z, Louey A, Furger AM. 2017. Cleavage and polyadenylation: ending the message expands gene regulation. RNA Biol 14:865–890. 10.1080/15476286.2017.1306171. [DOI] [PMC free article] [PubMed] [Google Scholar]
- 3.Turner RE, Pattison AD, Beilharz TH. 2018. Alternative polyadenylation in the regulation and dysregulation of gene expression. Semin Cell Dev Biol 75:61–69. 10.1016/j.semcdb.2017.08.056. [DOI] [PubMed] [Google Scholar]
- 4.Ren F, Zhang N, Zhang L, Miller E, Pu JJ. 2020. Alternative polyadenylation: a new frontier in post transcriptional regulation. Biomark Res 8:67. 10.1186/s40364-020-00249-6. [DOI] [PMC free article] [PubMed] [Google Scholar]
- 5.Bentley DL. 2014. Coupling mRNA processing with transcription in time and space. Nat Rev Genet 15:163–175. 10.1038/nrg3662. [DOI] [PMC free article] [PubMed] [Google Scholar]
- 6.Sommerkamp P, Cabezas-Wallscheid N, Trumpp A. 2021. Alternative polyadenylation in stem cell self-renewal and differentiation. Trends Mol Med 27:660–672. 10.1016/j.molmed.2021.04.006. [DOI] [PubMed] [Google Scholar]
- 7.Sun Y, Hamilton K, Tong L. 2020. Recent molecular insights into canonical pre-mRNA 3′-end processing. Transcription 11:83–96. 10.1080/21541264.2020.1777047. [DOI] [PMC free article] [PubMed] [Google Scholar]
- 8.Kumar A, Clerici M, Muckenfuss LM, Passmore LA, Jinek M. 2019. Mechanistic insights into mRNA 3′-end processing. Curr Opin Struct Biol 59:143–150. 10.1016/j.sbi.2019.08.001. [DOI] [PMC free article] [PubMed] [Google Scholar]
- 9.Yoon Y, Shi Y. 2022. Human pre-mRNA 3′ end processing: reconstituting is believing. Genes Dev 36:106–107. 10.1101/gad.349453.122. [DOI] [PMC free article] [PubMed] [Google Scholar]
- 10.Batra R, Manchanda M, Swanson MS. 2015. Global insights into alternative polyadenylation regulation. RNA Biol 12:597–602. 10.1080/15476286.2015.1040974. [DOI] [PMC free article] [PubMed] [Google Scholar]
- 11.Costanzo M, VanderSluis B, Koch EN, Baryshnikova A, Pons C, Tan G, Wang W, Usaj M, Hanchard J, Lee SD, Pelechano V, Styles EB, Billmann M, van Leeuwen J, van Dyk N, Lin Z-Y, Kuzmin E, Nelson J, Piotrowski JS, Srikumar T, Bahr S, Chen Y, Deshpande R, Kurat CF, Li SC, Li Z, Usaj MM, Okada H, Pascoe N, San Luis B-J, Sharifpoor S, Shuteriqi E, Simpkins SW, Snider J, Suresh HG, Tan Y, Zhu H, Malod-Dognin N, Janjic V, Przulj N, Troyanskaya OG, Stagljar I, Xia T, Ohya Y, Gingras A-C, Raught B, Boutros M, Steinmetz LM, Moore CL, Rosebrock AP, et al. 2016. A global genetic interaction network maps a wiring diagram of cellular function. Science 353:aaf1420. 10.1126/science.aaf1420. [DOI] [PMC free article] [PubMed] [Google Scholar]
- 12.Pearson EL, Graber JH, Lee SD, Naggert KS, Moore CL. 2019. Ipa1 is an RNA polymerase II elongation factor that facilitates termination by maintaining levels of the poly(A) site endonuclease Ysh1. Cell Rep 26:1919–1933.e5. 10.1016/j.celrep.2019.01.051. [DOI] [PMC free article] [PubMed] [Google Scholar]
- 13.Lee SD, Liu H-Y, Graber JH, Heller-Trulli D, Kaczmarek Michaels K, Cerezo JF, Moore CL. 2020. Regulation of the Ysh1 endonuclease of the mRNA cleavage/polyadenylation complex by ubiquitin-mediated degradation. RNA Biology 17:689–702. 10.1080/15476286.2020.1724717. [DOI] [PMC free article] [PubMed] [Google Scholar]
- 14.Kobirumaki F, Miyauchi Y, Fukami K, Tanaka H. 2005. A novel UbcH10-binding protein facilitates the ubiquitinylation of cyclin B in vitro. J Biochem 137:133–139. 10.1093/jb/mvi026. [DOI] [PubMed] [Google Scholar]
- 15.Hundley FV, Sanvisens Delgado N, Marin HC, Carr KL, Tian R, Toczyski DP. 2021. A comprehensive phenotypic CRISPR-Cas9 screen of the ubiquitin pathway uncovers roles of ubiquitin ligases in mitosis. Mol Cell 81:1319–1336.e9. 10.1016/j.molcel.2021.01.014. [DOI] [PubMed] [Google Scholar]
- 16.Huang L-Z, Li Y-J, Xie X-F, Zhang J-J, Cheng C-Y, Yamashiro K, Chen L-J, Ma X-Y, Cheung CMG, Wang Y-S, Zhang C-F, Bai Y-J, Hou J, Chen X-L, Qi Y, Li S-S, Sun Y-Y, Mei J-P, Cheng Y, Yu W-Z, Hu X-B, Zhuang F-F, Fan L, Lu Y, Sun X-H, Zhu X-J, Shen D-F, Chan C-C, Zhao M-W, Yoshimura N, Pang CP, Wong TY, Khor CC, Zhang K, Zhou P, Li X-X. 2015. Whole-exome sequencing implicates UBE3D in age-related macular degeneration in East Asian populations. Nat Commun 6:6687. 10.1038/ncomms7687. [DOI] [PubMed] [Google Scholar]
- 17.Xia H, Zhang Q, Shen Y, Bai Y, Ma X, Zhang B, Qi Y, Zhang J, Hu Q, Du W, Zhu L, Zhou P, Wang B, Xu H, Huang L, Li X. 2020. ube3d, a new gene associated with age-related macular degeneration, induces functional changes in both in vivo and in vitro studies. Mol Ther Nucleic Acids 20:217–230. 10.1016/j.omtn.2020.02.010. [DOI] [PMC free article] [PubMed] [Google Scholar]
- 18.Offenbacher S, Divaris K, Barros SP, Moss KL, Marchesan JT, Morelli T, Zhang S, Kim S, Sun L, Beck JD, Laudes M, Munz M, Schaefer AS, North KE. 2016. Genome-wide association study of biologically informed periodontal complex traits offers novel insights into the genetic basis of periodontal disease. Hum Mol Genet 25:2113–2129. 10.1093/hmg/ddw069. [DOI] [PMC free article] [PubMed] [Google Scholar]
- 19.Rovadoscki GA, Pertile SFN, Alvarenga AB, Cesar ASM, Pértille F, Petrini J, Franzo V, Soares WVB, Morota G, Spangler ML, Pinto LFB, Carvalho GGP, Lanna DPD, Coutinho LL, Mourão GB. 2018. Estimates of genomic heritability and genome-wide association study for fatty acids profile in Santa Inês sheep. BMC Genomics 19:375. 10.1186/s12864-018-4777-8. [DOI] [PMC free article] [PubMed] [Google Scholar]
- 20.Liu H, Heller-Trulli D, Moore CL. 2022. Targeting the mRNA endonuclease CPSF73 inhibits breast cancer cell migration, invasion, and self-renewal. iScience 25:104804. 10.1016/j.isci.2022.104804. [DOI] [PMC free article] [PubMed] [Google Scholar]
- 21.Ross NT, Lohmann F, Carbonneau S, Fazal A, Weihofen WA, Gleim S, Salcius M, Sigoillot F, Henault M, Carl SH, Rodríguez-Molina JB, Miller HR, Brittain SM, Murphy J, Zambrowski M, Boynton G, Wang Y, Chen A, Molind GJ, Wilbertz JH, Artus-Revel CG, Jia M, Akinjiyan FA, Turner J, Knehr J, Carbone W, Schuierer S, Reece-Hoyes JS, Xie K, Saran C, Williams ET, Roma G, Spencer M, Jenkins J, George EL, Thomas JR, Michaud G, Schirle M, Tallarico J, Passmore LA, Chao JA, Beckwith REJ. 2020. CPSF3-dependent pre-mRNA processing as a druggable node in AML and Ewing’s sarcoma. Nat Chem Biol 16:50–59. 10.1038/s41589-019-0424-1. [DOI] [PMC free article] [PubMed] [Google Scholar]
- 22.Chen H-F, Hsu C-M, Huang Y-S. 2018. CPEB2-dependent translation of long 3′-UTR Ucp1 mRNA promotes thermogenesis in brown adipose tissue. EMBO J 37. 10.15252/embj.201899071. [DOI] [PMC free article] [PubMed] [Google Scholar]
- 23.Spangenberg L, Shigunov P, Abud APR, Cofré AR, Stimamiglio MA, Kuligovski C, Zych J, Schittini AV, Costa ADT, Rebelatto CK, Brofman PRS, Goldenberg S, Correa A, Naya H, Dallagiovanna B. 2013. Polysome profiling shows extensive posttranscriptional regulation during human adipocyte stem cell differentiation into adipocytes. Stem Cell Res 11:902–912. 10.1016/j.scr.2013.06.002. [DOI] [PubMed] [Google Scholar]
- 24.Li W, You B, Hoque M, Zheng D, Luo W, Ji Z, Park JY, Gunderson SI, Kalsotra A, Manley JL, Tian B. 2015. Systematic profiling of poly(A)+ transcripts modulated by core 3′ end processing and splicing factors reveals regulatory rules of alternative cleavage and polyadenylation. PLoS Genet 11:e1005166. 10.1371/journal.pgen.1005166. [DOI] [PMC free article] [PubMed] [Google Scholar]
- 25.Poulos SP, Dodson MV, Hausman GJ. 2010. Cell line models for differentiation: preadipocytes and adipocytes. Exp Biol Med (Maywood) 235:1185–1193. 10.1258/ebm.2010.010063. [DOI] [PubMed] [Google Scholar]
- 26.Zebisch K, Voigt V, Wabitsch M, Brandsch M. 2012. Protocol for effective differentiation of 3T3-L1 cells to adipocytes. Anal Biochem 425:88–90. 10.1016/j.ab.2012.03.005. [DOI] [PubMed] [Google Scholar]
- 27.Tang Q-Q, Otto TC, Lane MD. 2003. Mitotic clonal expansion: a synchronous process required for adipogenesis. Proc Natl Acad Sci USA 100:44–49. 10.1073/pnas.0137044100. [DOI] [PMC free article] [PubMed] [Google Scholar]
- 28.Li LT, Jiang G, Chen Q, Zheng JN. 2015. Ki67 is a promising molecular target in the diagnosis of cancer (review). Mol Med Rep 11:1566–1572. 10.3892/mmr.2014.2914. [DOI] [PubMed] [Google Scholar]
- 29.Juan G, Traganos F, James WM, Ray JM, Roberge M, Sauve DM, Anderson H, Darzynkiewicz Z. 1998. Histone H3 phosphorylation and expression of cyclins A and B1 measured in individual cells during their progression through G2 and mitosis. Cytometry 32:71–77. . [DOI] [PubMed] [Google Scholar]
- 30.Kowarz E, Löscher D, Marschalek R. 2015. Optimized Sleeping Beauty transposons rapidly generate stable transgenic cell lines. Biotechnol J 10:647–653. 10.1002/biot.201400821. [DOI] [PubMed] [Google Scholar]
- 31.Mátés L, Chuah MKL, Belay E, Jerchow B, Manoj N, Acosta-Sanchez A, Grzela DP, Schmitt A, Becker K, Matrai J, Ma L, Samara-Kuko E, Gysemans C, Pryputniewicz D, Miskey C, Fletcher B, VandenDriessche T, Ivics Z, Izsvák Z. 2009. Molecular evolution of a novel hyperactive Sleeping Beauty transposase enables robust stable gene transfer in vertebrates. Nat Genet 41:753–761. 10.1038/ng.343. [DOI] [PubMed] [Google Scholar]
- 32.Ma X, Wang D, Zhao W, Xu L. 2018. Deciphering the roles of PPARγ in adipocytes via dynamic change of transcription complex. Front Endocrinol (Lausanne) 9:473. 10.3389/fendo.2018.00473. [DOI] [PMC free article] [PubMed] [Google Scholar]
- 33.Wang R, Tian B. 2020. APAlyzer: a bioinformatics package for analysis of alternative polyadenylation isoforms. Bioinformatics 36:3907–3909. 10.1093/bioinformatics/btaa266. [DOI] [PMC free article] [PubMed] [Google Scholar]
- 34.Gruber AJ, Schmidt R, Ghosh S, Martin G, Gruber AR, van Nimwegen E, Zavolan M. 2018. Discovery of physiological and cancer-related regulators of 3′ UTR processing with KAPAC. Genome Biol 19:44. 10.1186/s13059-018-1415-3. [DOI] [PMC free article] [PubMed] [Google Scholar]
- 35.Liu H, Moore CL. 2021. On the cutting edge: regulation and therapeutic potential of the mRNA 3′ end nuclease. Trends Biochem Sci 46:772–784. 10.1016/j.tibs.2021.04.003. [DOI] [PMC free article] [PubMed] [Google Scholar]
- 36.Eaton JD, Davidson L, Bauer DLV, Natsume T, Kanemaki MT, West S. 2018. Xrn2 accelerates termination by RNA polymerase II, which is underpinned by CPSF73 activity. Genes Dev 32:127–139. 10.1101/gad.308528.117. [DOI] [PMC free article] [PubMed] [Google Scholar]
- 37.Wiesel Y, Sabath N, Shalgi R. 2018. DoGFinder: a software for the discovery and quantification of readthrough transcripts from RNA-seq. BMC Genomics 19:597. 10.1186/s12864-018-4983-4. [DOI] [PMC free article] [PubMed] [Google Scholar]
- 38.Gupta RK, Arany Z, Seale P, Mepani RJ, Ye L, Conroe HM, Roby YA, Kulaga H, Reed RR, Spiegelman BM. 2010. Transcriptional control of preadipocyte determination by Zfp423. Nature 464:619–623. 10.1038/nature08816. [DOI] [PMC free article] [PubMed] [Google Scholar]
- 39.Lowe CE, O'Rahilly S, Rochford JJ. 2011. Adipogenesis at a glance. J Cell Sci 124:2681–2686. 10.1242/jcs.079699. [DOI] [PubMed] [Google Scholar]
- 40.Cawthorn WP, Scheller EL, MacDougald OA. 2012. Adipose tissue stem cells meet preadipocyte commitment: going back to the future. J Lipid Res 53:227–246. 10.1194/jlr.R021089. [DOI] [PMC free article] [PubMed] [Google Scholar]
- 41.Sakers A, De Siqueira MK, Seale P, Villanueva CJ. 2022. Adipose-tissue plasticity in health and disease. Cell 185:419–446. 10.1016/j.cell.2021.12.016. [DOI] [PMC free article] [PubMed] [Google Scholar]
- 42.Huttlin EL, Bruckner RJ, Paulo JA, Cannon JR, Ting L, Baltier K, Colby G, Gebreab F, Gygi MP, Parzen H, Szpyt J, Tam S, Zarraga G, Pontano-Vaites L, Swarup S, White AE, Schweppe DK, Rad R, Erickson BK, Obar RA, Guruharsha KG, Li K, Artavanis-Tsakonas S, Gygi SP, Harper JW. 2017. Architecture of the human interactome defines protein communities and disease networks. Nature 545:505–509. 10.1038/nature22366. [DOI] [PMC free article] [PubMed] [Google Scholar]
- 43.Hein MY, Hubner NC, Poser I, Cox J, Nagaraj N, Toyoda Y, Gak IA, Weisswange I, Mansfeld J, Buchholz F, Hyman AA, Mann M. 2015. A human interactome in three quantitative dimensions organized by stoichiometries and abundances. Cell 163:712–723. 10.1016/j.cell.2015.09.053. [DOI] [PubMed] [Google Scholar]
- 44.Tian B, Hu J, Zhang H, Lutz CS. 2005. A large-scale analysis of mRNA polyadenylation of human and mouse genes. Nucleic Acids Res 33:201–212. 10.1093/nar/gki158. [DOI] [PMC free article] [PubMed] [Google Scholar]
- 45.Li L, Wang D, Xue M, Mi X, Liang Y, Wang P. 2014. 3′UTR shortening identifies high-risk cancers with targeted dysregulation of the ceRNA network. Sci Rep 4:5406. 10.1038/srep05406. [DOI] [PMC free article] [PubMed] [Google Scholar]
- 46.Park HJ, Ji P, Kim S, Xia Z, Rodriguez B, Li L, Su J, Chen K, Masamha CP, Baillat D, Fontes-Garfias CR, Shyu A-B, Neilson JR, Wagner EJ, Li W. 2018. 3′ UTR shortening represses tumor-suppressor genes in trans by disrupting ceRNA crosstalk. Nat Genet 50:783–789. 10.1038/s41588-018-0118-8. [DOI] [PMC free article] [PubMed] [Google Scholar]
- 47.Yuan F, Hankey W, Wagner EJ, Li W, Wang Q. 2021. Alternative polyadenylation of mRNA and its role in cancer. Genes Dis 8:61–72. 10.1016/j.gendis.2019.10.011. [DOI] [PMC free article] [PubMed] [Google Scholar]
- 48.Nourse J, Spada S, Danckwardt S. 2020. Emerging roles of RNA 3′-end cleavage and polyadenylation in pathogenesis, diagnosis and therapy of human disorders. Biomolecules 10:915. 10.3390/biom10060915. [DOI] [PMC free article] [PubMed] [Google Scholar]
- 49.Ran FA, Hsu PD, Wright J, Agarwala V, Scott DA, Zhang F. 2013. Genome engineering using the CRISPR-Cas9 system. Nat Protoc 8:2281–2308. 10.1038/nprot.2013.143. [DOI] [PMC free article] [PubMed] [Google Scholar]
- 50.Dobin A, Davis CA, Schlesinger F, Drenkow J, Zaleski C, Jha S, Batut P, Chaisson M, Gingeras TR. 2013. STAR: ultrafast universal RNA-seq aligner. Bioinformatics 29:15–21. 10.1093/bioinformatics/bts635. [DOI] [PMC free article] [PubMed] [Google Scholar]
- 51.Liao Y, Smyth GK, Shi W. 2014. featureCounts: an efficient general purpose program for assigning sequence reads to genomic features. Bioinformatics 30:923–930. 10.1093/bioinformatics/btt656. [DOI] [PubMed] [Google Scholar]
- 52.Love MI, Huber W, Anders S. 2014. Moderated estimation of fold change and dispersion for RNA-seq data with DESeq2. Genome Biol 15:550. 10.1186/s13059-014-0550-8. [DOI] [PMC free article] [PubMed] [Google Scholar]
- 53.Yu G, Wang L-G, Han Y, He Q-Y. 2012. clusterProfiler: an R package for comparing biological themes among gene clusters. Omics 16:284–287. 10.1089/omi.2011.0118. [DOI] [PMC free article] [PubMed] [Google Scholar]
- 54.Zhou Y, Zhou B, Pache L, Chang M, Khodabakhshi AH, Tanaseichuk O, Benner C, Chanda SK. 2019. Metascape provides a biologist-oriented resource for the analysis of systems-level datasets. Nat Commun 10:1523. 10.1038/s41467-019-09234-6. [DOI] [PMC free article] [PubMed] [Google Scholar]
- 55.Stephens M. 2017. False discovery rates: a new deal. Biostatistics 18:275–294. 10.1093/biostatistics/kxw041. [DOI] [PMC free article] [PubMed] [Google Scholar]
Associated Data
This section collects any data citations, data availability statements, or supplementary materials included in this article.
Data Availability Statement
RNA sequencing data from this study are available in the Gene Expression Omnibus (GEO) database under accession number GSE202310.