
Figure 3:
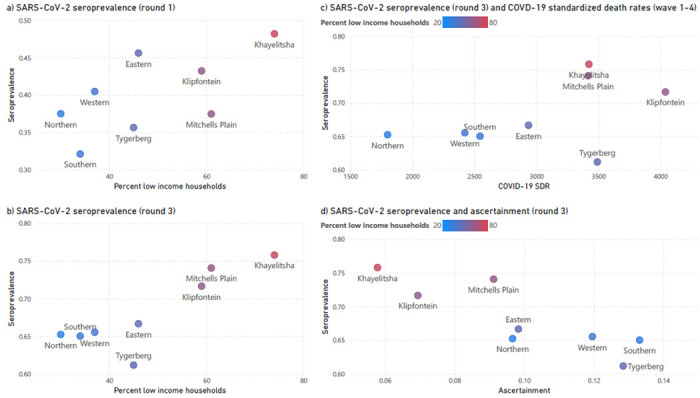
Anti-N seroprevalence scatter plots describing the association between (a) seroprevalence in serology round 1 (August – November 2020) with proportion of low-income households, (b) as above but for serology round 3 (September – November 2021), (c) seroprevalence in round 3 and age and sex-standardized COVID-19 deaths rates(SDR), combined for waves 1-4, and (d) seroprevalence in round 3 compared to the case ascertainment rate. In all the scatter plots, subdistrict is the unit of measurement, and is colour coded according to proportion of low-income households.