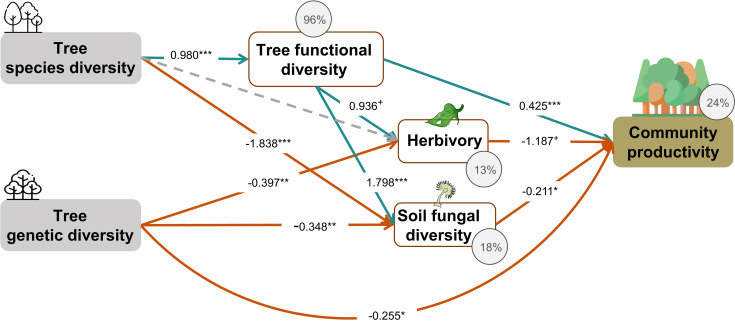
Appendix 3—figure 1. Effects of tree diversity on higher trophic levels and tree community productivity without the path between genetic diversity and functional diversity (global Fisher’s C = 16.766, DF = 6, p = 0.01).
Positive and negative paths are indicated in green and orange, respectively. The standardized path coefficients are indicated by the numbers, statistical significance is indicated by asterisks (*** p < 0.0001, ** p < 0.001, * p < 0.05, and + p <0.1), and the explained variance of dependent variables is indicated by the percentage values. The gray dashed line indicates a nonsignificant (p > 0.1) pathway in the final model. To allow comparison, the same structural equation model (SEM) as for Figure 4 was used except excluding the path between genetic diversity and functional diversity.

