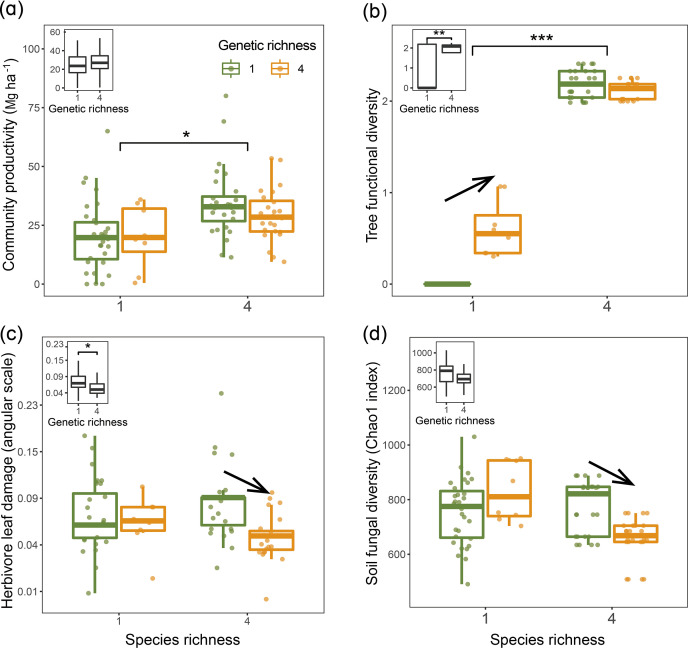
Figure 2. Tree community productivity, tree functional diversity, and trophic interactions in tree communities of low vs. high species and genetic richness.
The following effects were tested in linear mixed-effects models (LMMs) (n=92): species richness main effect (left vs. right pair of bars in each panel), genetic richness main effect (inset on upper left in each panel), genetic richness effect within each species richness level (arrows between bars within pairs). (a) tree community productivity, (b) tree functional diversity, (c) herbivore leaf damage, and (d) soil fungal diversity. The lower and upper hinges of the bars correspond to the first and third quartiles (the 25th and 75th percentiles); the lower and upper whisker extends from the hinge correspond to 1.5 * interquartile range (third quartiles - first quartiles). Asterisks indicate statistical significance (*** p<0.0001, ** p<0.001, * p<0.05); solid arrow indicates (p<0.05, without arrow indicates p>0.1). Details of the fitted models are given in Appendix 2—table 1.
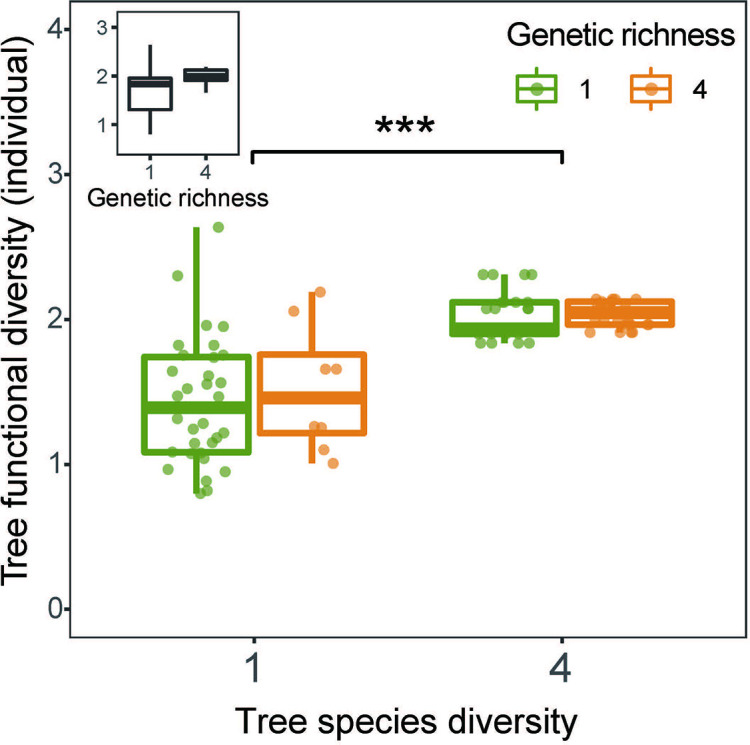
Figure 2—figure supplement 1. Effects of tree species diversity and genetic diversity on tree functional diversity calculated from traits measured on individual trees.


