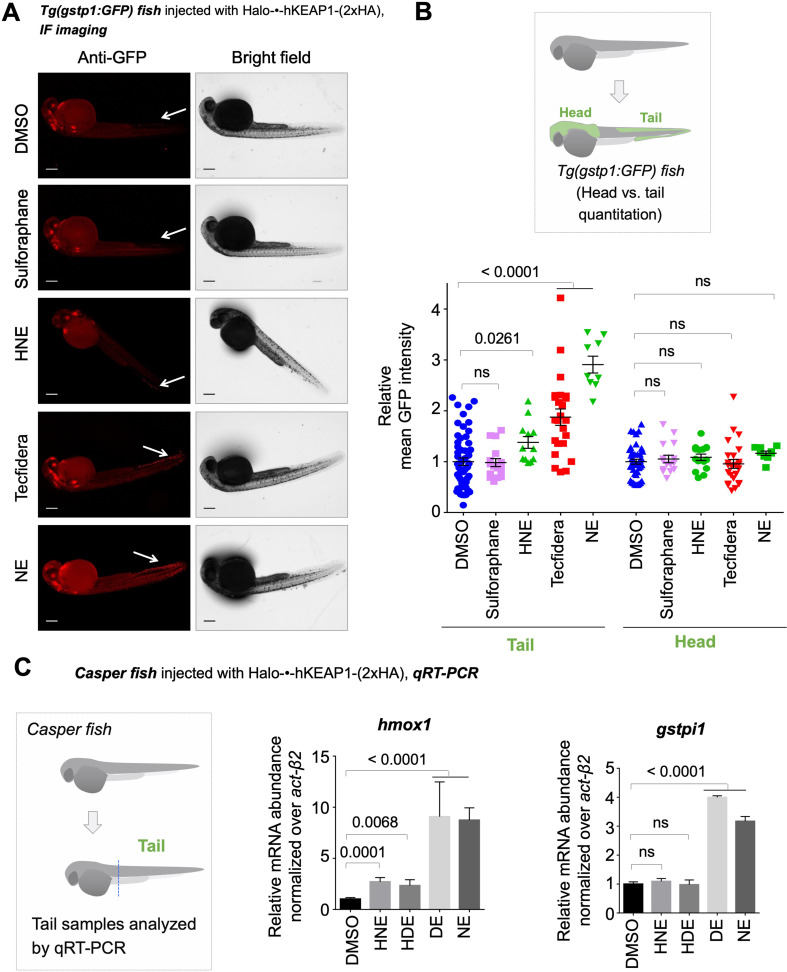
Figure 5. Bolus dosing with different LDEs or reactive covalent electrophilic drugs elicits complex AR responses.
Also see Figure 6, Figure 3—figure supplements 1 and 4 and 5E, Figure 4—figure supplement 1, and Figure 5—figure supplement 1. (A) Representative IF images of Tg(gstp1:GFP) fish expressing Halo-•-hKeap1-(2xHA), following bolus exposure to indicated electrophiles. (B) Quantitation of data in (A). Image quantitation was performed on the head/tail-regions as illustrated. No. embryos analyzed: Tail, DMSO (55), Sulforaphane (16), HNE (12), Tecfidera (24), NE (9); Head, DMSO (43), Sulforaphane (16), HNE (15), Tecfidera (24), NE (9). Sulforaphane and HNE elicit non-significant and 1.5-fold AR upregulation, respectively. Tecfidera gives medium (~2-fold) AR response and NE elicits the strongest AR upregulation (~3-fold) in tail. Consistent with data elsewhere (e.g., Figure 3A and C-E), head is not responsive. (C) qRT-PCR analysis of endogenous AR-responsive genes following bolus exposure of native reactive LDEs to whole fish similarly shows mixed responses. Whole-head/-tail separation was performed as indicated in inset (left), prior to RNA isolation selectively from the tails. 2 hr post Z-REX, embryos were euthanized, and RNA was isolated separately from tail (see inset, left). Data are presented as mean ± sem. n>3 independent biological replicates and two technical repeats for each sample. All numerical data present mean ± sem. Numbers above the bars represent analysis by two-tailed t-tests.


