Abstract
Background and Objectives
Perivascular spaces (PVS) visible on MRI scans may represent key aspects in the pathophysiology of stroke and dementia, including cerebral small vessel disease and glymphatic dysfunction. This study aimed to determine the association between MRI-visible PVS burden and the risk of incident dementia.
Methods
This study included community-dwelling Framingham Heart Study Original and Offspring cohort participants with available brain MRI-PVS ratings, free of stroke and dementia. Multivariable Cox proportional hazard regression was used to obtain hazard ratios (HRs) and 95% CIs of the association between MRI-visible PVS and incident dementia. PVS were rated using validated methods in the basal ganglia (BG) and centrum semiovale (CSO). The outcomes included all-cause dementia, Alzheimer dementia (AD), and vascular dementia (VaD).
Results
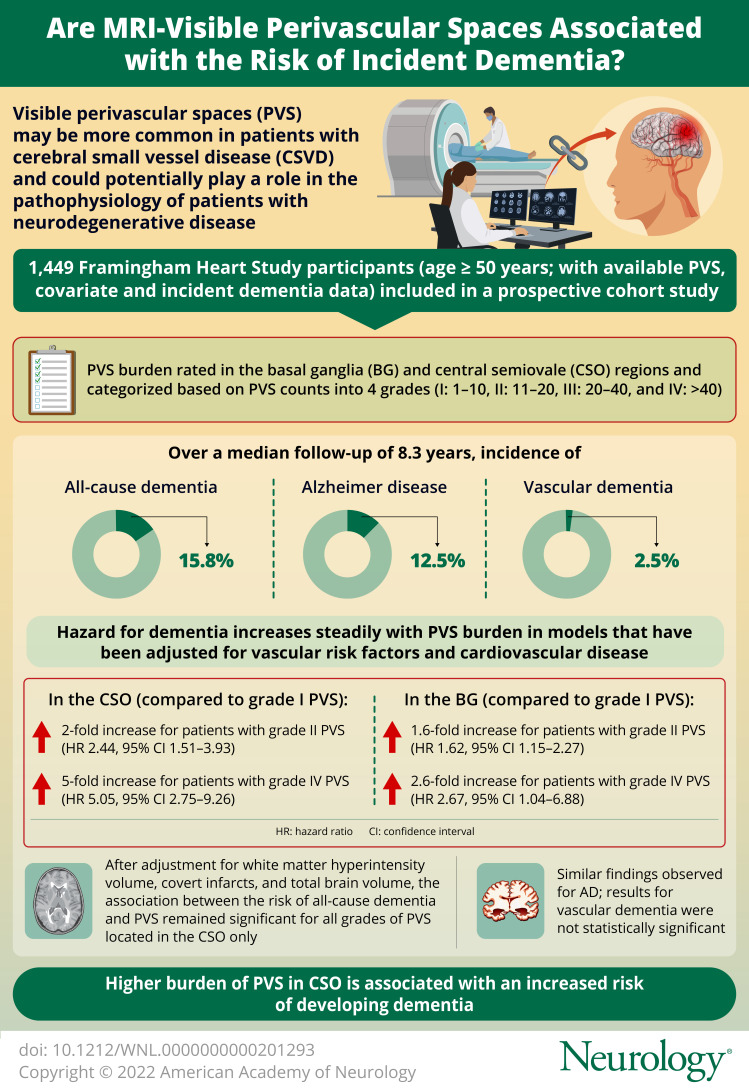
One thousand four hundred forty-nine participants 50 years or older (46% male) were included. Over a median follow-up period of 8.3 years, the incidence of all-cause dementia, AD, and VaD was 15.8%, 12.5%, and 2.5%, respectively. In models that adjusted for vascular risk factors and cardiovascular disease, the hazard for dementia increased steadily as PVS burden increased, rising 2-fold for those with grade II PVS (HR 2.44, 95% CI 1.51–3.93) to 5-fold in participants with grade IV (HR 5.05, 95% CI 2.75–9.26) compared with grade I PVS in CSO. In the BG, hazards increased 1.6-fold (HR 1.62, 95% CI 1.15–2.27) for grade II to 2.6-fold (HR 2.67, 95% CI 1.04–6.88) for grade IV compared with grade I PVS. The association remained significant for CSO but not for BG, after adjustment for white matter hyperintensity volume (WMHV), covert infarcts, and total brain volume. Similar findings were observed for AD, but VaD, limited by a small number of events, was not statistically significant.
Discussion
Higher burden of PVS in CSO was associated with increased risk of developing dementia, independent of vascular risk factors, total brain volume, WMHVs, and covert infarcts. This finding supports a role for PVS as a subclinical MRI marker to identify individuals in subclinical stages at high risk of developing dementia who may benefit from early intervention.
Dementia devastates individuals and families and has reached epidemic proportions with over 5 million individuals affected in the United States,1 43.8 million worldwide,2 and its prevalence is expected to rise over the short term.1,2 Impairment of perivascular drainage (glymphatic dysfunction) and cerebral small vessel disease (CSVD) may play a mechanistic role in cognitive disorders ranging from cognitive impairment to dementia.3,4 Neuronal function is closely linked to cerebrovascular health; thus, neurovascular unit (i.e. neuron, glia, and vessel) dysfunction5 in brain disease is likely to be intimately related to dysfunction of vascular supply. Perivascular spaces (PVS) are one of the components linking neurovascular units with larger cerebral vessels, located in the interface between small vessels and neurons, and serve as routes for clearance of metabolites such as beta amyloid (Aβ).6
Animal studies have suggested that as arterioles transition toward the cerebral microcirculation, PVS surrounding the larger arterioles transition to virtual spaces7 that at the microcirculation level are enriched in aquaporin 4 channels,8,9 forming part of the blood-brain barrier and participating in the fluid and metabolite exchange with the interstitial brain parenchymal compartment. Reduced perivascular aquaporin-4 has been found in individuals with AD and associated with increased Aβ deposition and Braak stage.10 Additional animal studies using confocal microscopy have shown visualization of perivascular flow in vivo and further suggest that perivascular flow may be impaired because of hypertension,11 suggesting that dysfunction of perivascular flow may be related to adverse effects of vascular risk factors such as hypertension.
Perivascular spaces visible on MRI can be quantified and may reflect CSVD and dysfunction of the metabolite clearance routes (i.e. glymphatic dysfunction).12,13 Perivascular drainage dysfunction and CSVD in asymptomatic individuals likely develop gradually over many years. Thus, detection and quantification of visible PVS on MRI may serve as subclinical markers of vascular risk and neurodegeneration and may be a useful tool for early risk stratification of individuals at risk of dementia. However, prior meta-analyses have found conflicting evidence in the relation of PVS and cognitive disorders with significant heterogeneity between studies and variability in methods, calling for additional studies to help determine potential pathophysiologic involvement of PVS in neurodegenerative disorders.14,15 In view of the epidemic proportions of dementia in the United States and worldwide, early detection of individuals at heightened risk becomes an essential task and early risk stratification, in turn, is essential for delineation and implementation of effective preventive measures for dementia.
In addition to a potential role as early marker of dementia risk, PVS may reflect the effects of the most common forms of sporadic CSVD: hypertensive arteriopathy (predominantly affecting deep brain regions) and cerebral amyloid angiopathy (CAA, affecting lobar brain regions), with mixed distribution representing an interplay of both or advanced hypertensive vascular injury.16,17 The prevalence of these arteriopathies in autopsy studies is around 10%–30% of older persons and 35%–90% of all persons with dementia.18-20 Thus, PVS may represent a subclinical biomarker of high relevance, reflecting key aspects in the pathophysiology of dementia. The aim of this study was to assess the association of PVS with incident dementia in a large sample of community-dwelling individuals and evaluate differences in this association according to the brain topography of PVS.
Methods
Sample
The Framingham Heart Study (FHS) Original and Offspring cohorts were included in this study. The Original cohort (Gen 1, N = 5,209) comprised two-thirds of all adult men and women residing at that time in the town of Framingham, MA, and was examined every 2 years 32 times. The Offspring cohort (Gen 2, N = 5,124) started enrollment in 1971 and comprised children of the Original cohort and the spouses of these children. They have been examined every 4 years and are now in the 10th examination cycle.
FHS participants were eligible for this study if they had available PVS, covariate, and incident dementia data. Participants were selected from the Original and Offspring cohorts, were older than 50 years and free of prevalent dementia, stroke, and other neurologic conditions known to affect brain MRI (such as tumor, multiple sclerosis, and head trauma).
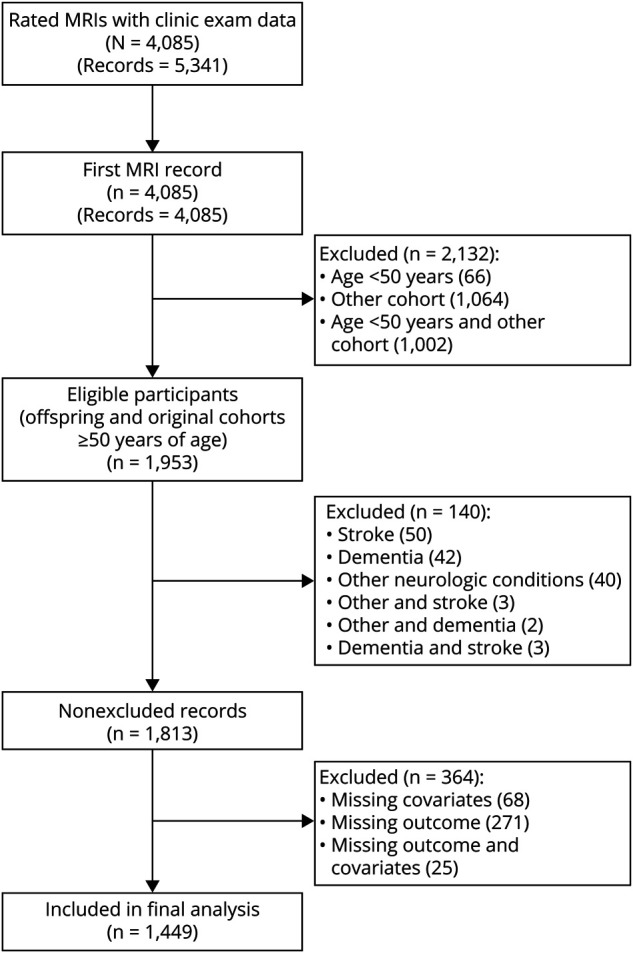
There were a total of 5,341 PVS rated MRI records from 4,085 FHS participants with corresponding clinic examination data. For subjects who had more than one PVS rating, we used the first available record. Of these 4,085 participants, 1,953 were from the Original and Offspring Cohorts and were 50 years or older at the time of the MRI scan. One hundred forty participants were excluded because of prevalent stroke or dementia or other neurologic conditions, and an additional 364 participants were excluded because of missing outcome or covariate data, yielding a study sample of 1,449 participants. The sample selection is shown in Figure 1.
Figure 1. Sample Selection.
The Original and Offspring cohorts of the Framingham Heart Study participants are of predominant White race (91%).
Standard Protocol Approvals, Registrations, and Patient Consents
The Institutional Review Board of Boston University Medical Center approved the study protocol, and informed consent was obtained from all subjects.
Brain MRI
Brain MRI acquisition measures and image processing methods have been described in detail.21,22 Participants were imaged on a 1T (1999–2005) or 1.5T (after 2005) Magnetom scanner (Siemens Medical, Erlangen, Germany). The 1.5T scanner MRI protocol included a T2-weighted double spin-echo coronal imaging sequence of 3-mm contiguous slices from nasion to occiput with a repetition time of 3,300 ms, echo time (TE) of TE1 20/TE2 99 ms, echo train length 7, field of view 24 cm, and an acquisition matrix of 228 × 256 interpolated to 456 × 512 with one excitation. The 1T scanner MRI protocol included a T2-weighted double spin-echo coronal imaging sequence of 4-mm contiguous slices from nasion to occiput with a repetition time of 2,420 ms, TE of TE1 20/TE2 90 ms, echo train length 8 ms, field of view 22 cm, and an acquisition matrix of 182 × 256 interpolated to 256 × 256 with 1 excitation.
PVS Ratings
We used consensus criteria by the Standards for Reporting Vascular Changes on Neuroimaging Criteria (STRIVE consortium)23 to determine MRI characteristics of enlarged perivascular spaces. In brief, PVS met the following criteria: signal intensity similar to CSF on all sequences, adherence to the course of penetrating vessels, linear (parallel to the penetrating vessel) or round/ovoid (perpendicular to the penetrating vessel), and a diameter smaller than 3 mm.
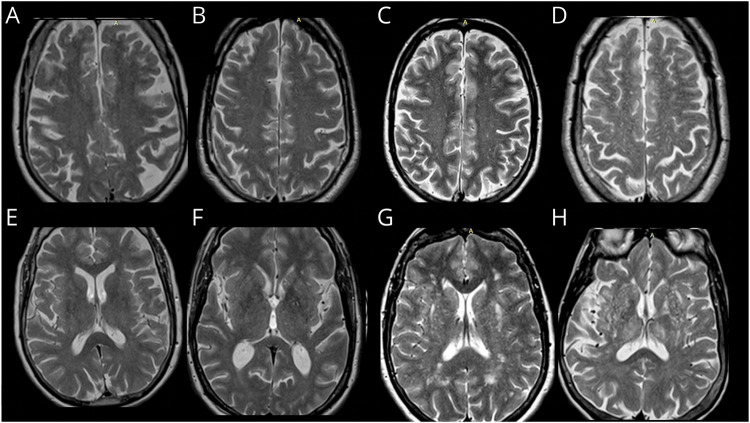
MRI scans were rated by 3 experienced investigators (neuroradiologist, vascular neurologist, and a well-trained research assistant) blinded to the subjects' demographic, clinical, and outcome information. When available, PVS ratings were performed on T2-weighted axial MRI sequences using a validated method that grouped PVS according to their brain topography into centrum semiovale (CSO) and basal ganglia (BG).15 The burden of PVS was categorized into grades based on PVS counts: I (1–10), II (11–20), III (20–40), and IV (>40). A representative example is shown in Figure 2.
Figure 2. Example of PVS Categories by Brain Topography in FHS Participants.
Upper row centrum semiovale: (A) grade I (1–10 PVS counts), (B) grade II (11–20 PVS counts), (C) grade III (21–40 PVS counts), and (D) grade IV (>40 PVS counts). Bottom row basal ganglia region: (E) grade I (1–10 PVS counts), (F) grade II (11–20 PVS counts), (G) grade III (21–40 PVS counts), and (H) grade IV (>40 PVS counts). PVS = perivascular spaces, FHS = Framingham Heart Study.
A large subset of scans (legacy scans from the older MRI dataset above) were rated using coronal acquisitions because of the higher resolution in this sequence than in the axial views, with a method similar to axial scan ratings that we recently validated, further presented in eFigure 1 (links.lww.com/WNL/C371) in the Supplement. Scans with available axial and coronal views with good resolution showed that PVS ratings in BG and CSO were highly correlated in both sequences (intraclass correlation coefficient [ICC] = 0.90). Scans with discrepancies and questions regarding the PVS category or differentiation from mimics were resolved by consensus.
PVS Rating Reliability Measures
Intrarater reproducibility was assessed for each rater, using 200 scans or 20 scans (depending on the rater), on 2 separate occasions 2–4 weeks apart. The smaller number of scans to test reproducibility was considered sufficient after extensive training of the rater. The order of scans was changed randomly between the 2 reading sessions. Inter-rater reproducibility measures were compared between the primary rater and secondary raters using 200 scans and 20 scans. The intrarater reliability was good to excellent (ICC BG 0.76–0.81, CSO 0.76–0.83). Interrater reliability comparing 2 independent readers was excellent (ICC BG 0.81–0.86, CSO 0.80–0.81).
Additional CSVD Markers on Brain MRI
We evaluated whether the relation of PVS with incident dementia was independent of additional brain MRI markers of CSVD: existent ratings of cerebral microbleeds (CMBs) and covert brain infarcts (CBIs), white matter hyperintensity volume (WMHV), and total brain volume, a marker of neurodegeneration. The presence of CMB was performed using T2*weighted sequences following the published guidelines.24 The presence of CBI was assessed following the Standards for Reporting Vascular Changes on Neuroimaging (STRIVE) criteria.23 Details of volumetric analyses for total brain volume are detailed elsewhere25; we used the ratio of total cranial to brain volume (TCBVr) to account for differences in head size. WMHVs were measured using previously described methods as noted, on the same MRI with available appropriate sequences (fluid attenuated inversion recovery or dual spin-echo) that PVS were assessed.
Assessment of Incident Dementia
Dementia is defined using the DSM IV criteria.28 A diagnosis of clinical Alzheimer dementia (AD) was based on the criteria of the National Institute of Neurologic and Communicative Disorders and Stroke and the AD and Related Disorders Association for definite, probable, or possible AD.29 The diagnosis of vascular dementia (VaD) was based on the National Institute of Neurologic Disorders and Stroke-Association Internationale pour la Recherche et l'Enseignement en Neurosciences criteria.30 Participants with evidence of both clinical AD and VaD were classified as having both diseases. All-cause dementia included dementia cases of any type, including AD and VaD.
Detailed description of the methods for surveillance of incident dementia in the Framingham Heart Study is published elsewhere.26,27 In brief, ongoing surveillance for dementia is carried through Framingham Heart Study clinic evaluations, biennial questionnaires, annual telephone health history updates, and reporting by participants or their relatives or care providers. A concern of cognitive symptoms can be raised by the participant, family member, or Framingham Heart Study staff or physician and is assessed by a drop in Mini-Mental State Examination of >3 points in sequential visits, >5 points across all visits, or a score below an education-specific cut point. Such concerns trigger further detailed evaluation including review of all records, comprehensive neurologic assessment and neuropsychological evaluation including a comprehensive battery of cognitive testing, interview of family members, and in some cases review of autopsy data when available. Potential incident dementia cases are then adjudicated by a panel including at least 1 neurologist and 1 neuropsychologist.
The follow-up interval spans from entry to this study (time of MRI: March 1999–August 2015) until December 31, 2019. Participants who did not develop dementia during follow-up (including those who died during follow-up) were censored at the date last known to be dementia free.
Covariates and Other Study Variables
Systolic (SBP) and diastolic (DBP) blood pressures were each taken as the average of the Framingham clinic physician's 2 measurements. Hypertension was defined by the JNC-7 classification (systolic ≥140 mm Hg and/or diastolic ≥90 mm Hg or use of antihypertensive medications). Current cigarette smoking was defined as self-reported use in the year before the examination. We defined diabetes as a random blood glucose ≥200 mg/dL (≥11.1 mmol/L) for the Original cohort, fasting glucose ≥126 mg/dL (≥7 mmol/L) for the Offspring cohort, or use of insulin or oral hypoglycemic medications for either cohort. Prevalent cardiovascular disease (CVD) included stroke, transient ischemic attack, coronary heart disease, heart failure, and peripheral arterial disease.
Medication use was assessed by self-report. APOE genotype status was determined in 1991 by DNA amplification techniques and restriction isotyping.31 APOE-ε4 status was analyzed using any ε4 allele vs none, based on previously reported stronger association of this allele with risk dementia32 and CAA.33 Educational-level information is collected at each examination cycle and is categorized as no high school degree, high school degree, some college, or college degree.
Statistical Analysis
Baseline characteristics of study participants, overall and by PVS topography, were summarized as frequencies and percentages for categorical variables and as means and standard deviations for continuous variables. Incidence rates (per 1,000 person-years), stratified by PVS topography, were calculated for each type of event (all-cause dementia, AD, and VaD) by dividing the total number of events by the total follow-up time and multiplying by 1,000. We used multivariable Cox proportional hazard regression analyses to obtain hazard ratios (HRs) and 95% CIs for all-cause dementia and dementia subtype. CSO and BG PVS (grades I-IV) were each treated as categorical predictors with grade I as the reference group. In addition, we created a categorical CSO-BG mixed score reflecting high burden (grade III or IV PVS) in neither region, strictly in the CSO, strictly in the BG, or both regions (0 = none, 1 = BG region only, 2 = CSO region only, or 3 = both regions), with score 0 as the reference group.
Multivariable Cox regression models evaluated included: model 1 adjusted for age and sex; model 2 additionally adjusted for FHS cohort, interval between examination cycle and MRI, and educational level; and model 3 additionally adjusted for vascular risk factors (diabetes, smoking status, and hypertension) and prevalent CVD. Exploratory analyses stratified by age, sex, and APOE ε4 allele presence were also performed to assess potential effect modification. We also evaluated age quartiles and quadratic terms for age in our models to explore nonlinear effects of age. Additional exploratory models were performed to assess the independent association of PVS with dementia from other CSVD or neurodegeneration markers while also adjusting for the covariates in model 3: model 4 adjusted for WMHV, model 5 adjusted for CBI, model 6 adjusted for total cranial to brain volume ratio (TCBVr), and model 7 adjusted for lobar CMB.
Based on the above models, adjusted survival probabilities for each region were calculated and plotted for each outcome over follow-up time. In addition, the proportional hazards assumption was assessed by testing time interaction terms with PVS grades and using complementary log-log plots. HRs did not vary significantly with time.
All statistical analyses were performed using SAS version 9.4 (SAS Institute, Cary, NC), and a p value < 0.05 was considered statistically significant.
Data Availability
Data from this manuscript may be shared with qualified investigators following FHS data sharing procedures outlined at Ref. 34.
Results
Descriptive Statistics
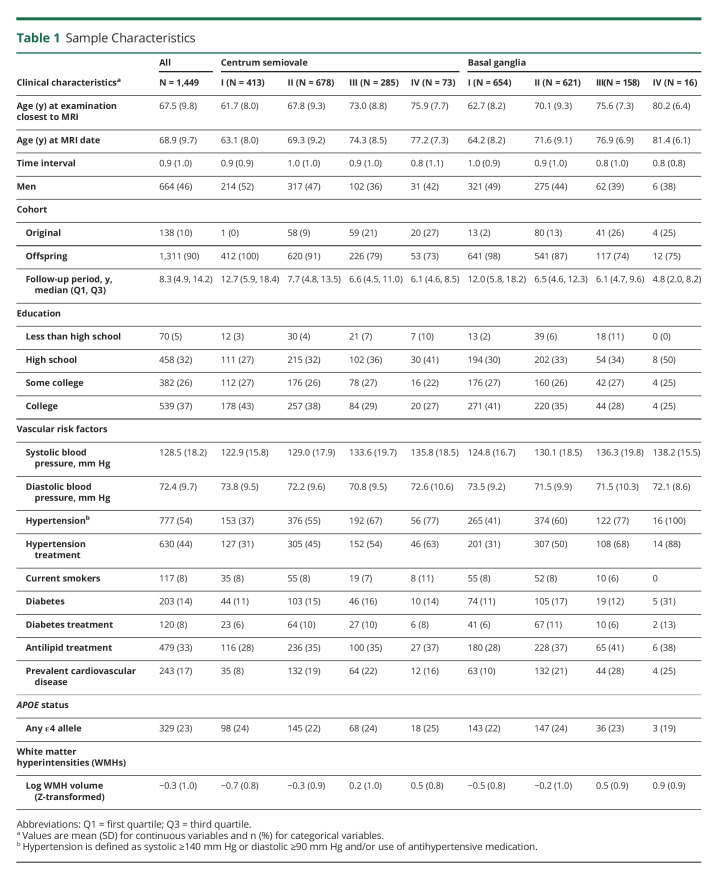
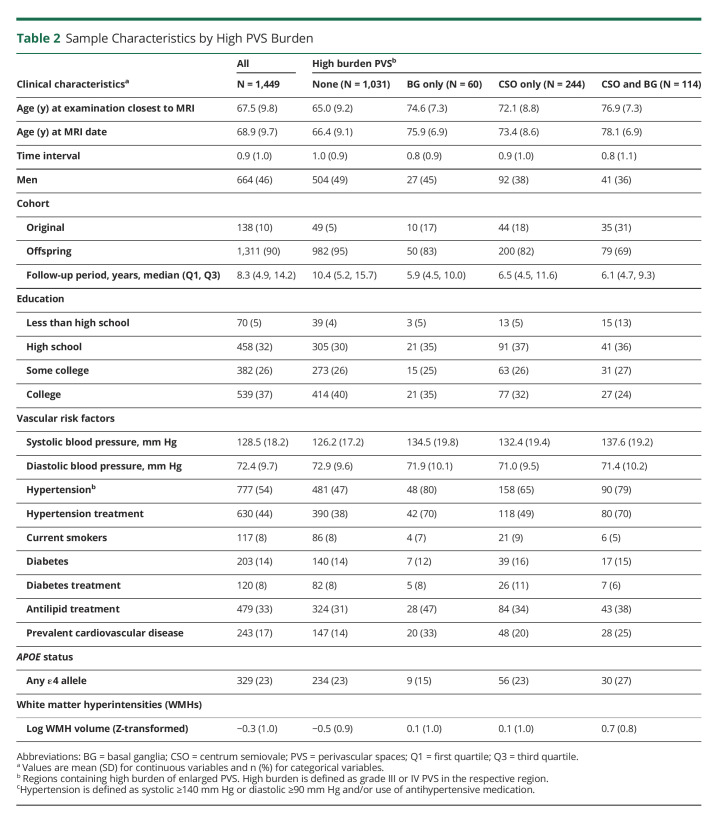
Our analysis included 1,449 subjects who met all inclusion criteria (Figure 1 and Tables 1 and 2). We observed PVS in all participants, 5% had highest burden (grade IV) in the CSO and 1.1% in the BG. Baseline characteristics are presented in Tables 1 and 2. Participants with higher burden of PVS in either or both brain regions were older and more likely to have hypertension. They were also more likely to have increased prevalence of other CSVD measures including higher WMHV, CBI, and presence of CMBs. Participants excluded from this study (n = 364) were slightly older and had similar prevalence of vascular risk factors (additional data are listed in eTable 1).
Table 1.
Sample Characteristics
Table 2.
Sample Characteristics by High PVS Burden
Dementia Incidence and Incidence Rates
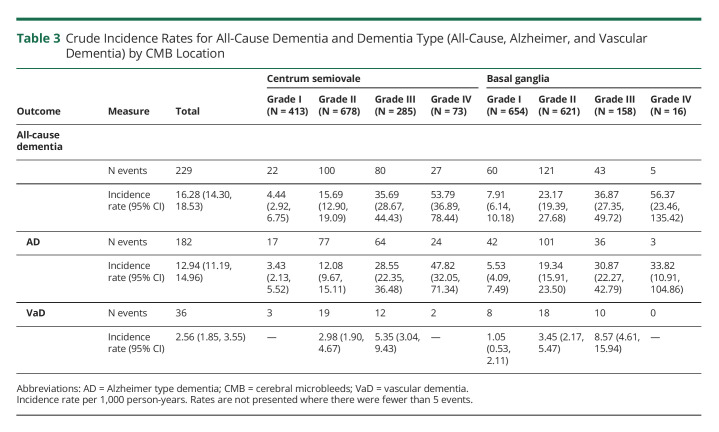
We observed 229 dementia cases (15.8%) of any cause over the follow-up period (median period of 8.3 [interquartile range 9.3 years]), 182 (12.5%) AD-type dementia and 36 (2.5%) VaD. Crude incidence rates increased as PVS burden increased in both the CSO and BG regions and were highest among persons with grade IV PVS burden for any dementia, AD, and VaD subtypes (Table 3).
Table 3.
Crude Incidence Rates for All-Cause Dementia and Dementia Type (All-Cause, Alzheimer, and Vascular Dementia) by CMB Location
Multivariable Analyses
All-Cause Dementia
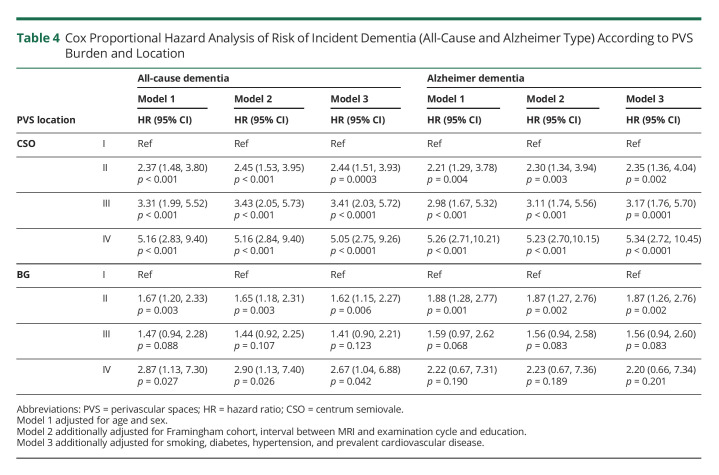
We observed that the hazard of all-cause dementia was significant, increased steadily as the burden of PVS increased, and was independent of vascular risk factors and prevalent CVD (Table 3). After adjusting for age, sex, FHS cohort, time between MRI and examination cycle, education, vascular risk factors, and CVD (model 3), the hazard for all-cause dementia increased more than 2-fold for those with PVS grade II (HR 2.44, 95% CI 1.51–3.93) and 5-fold in participants with PVS grade IV (HR 5.05, 95% CI 2.75–9.26) compared with grade I in the CSO. Similar results were observed in our minimally adjusted model (model 1) (Table 4).
Table 4.
Cox Proportional Hazard Analysis of Risk of Incident Dementia (All-Cause and Alzheimer Type) According to PVS Burden and Location
Similar findings were also observed in relation to BG PVS, where hazard increased 1.6-fold (HR 1.62, 95% CI 1.15–2.27) for grade II PVS and 2.6-fold (HR 2.67, 95% CI 1.04–6.88) for grade IV ePVS compared with grade I (model 3). Models exploring nonlinear effects of age did not change associations in either CSO or BG.
We further evaluated whether PVS are associated with dementia, independent from other markers of CSVD. In models additionally adjusting for WMHV (model 4), we observed slight attenuation of the associations between CSO PVS burden and incident dementia, but remained strong and significant (Table 4). By contrast, the associations of PVS burden in the BG region with incident dementia were no longer significant. Analyses assessing the mixed PVS score showed significant associations of high PVS burden with incident all-cause dementia driven by CSO PVS, but not BG. In analyses stratified by age, sex, or APOE-ɛ4 genotype, the observed associations were similar among subgroups.
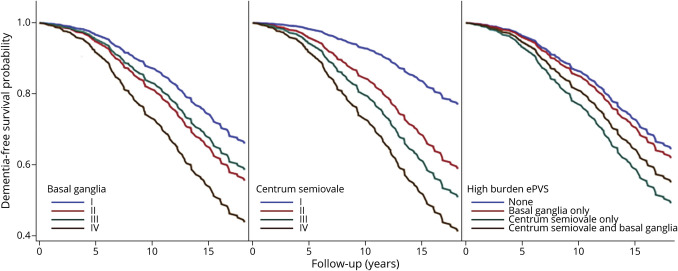
Figure 3 shows survival functions from model 3 comparing survival experience across PVS groups. The survival curves, which represent the probability that an individual remains dementia-free beyond specific years of follow-up, clearly show group differences for both CSO and BG. Differences were particularly notable after approximately 4 to 5 years of follow-up and were more prominent for participants with high CSO PVS burden. The probability for dementia-free survival beyond 5 years of follow-up was 98% for grade I compared with 92% for grade IV CSO PVS. At 10 years of follow-up, these estimates were 93% and 73%, respectively.
Figure 3. Adjusted All-Cause Dementia Survival Curves by PVS Category and Topography.
PVS = perivascular space. *Adjusted for age, sex, and time interval between MRI and examination cycle, cohort, education, smoking, diabetes, hypertension, and prevalent cardiovascular disease.
Alzheimer Dementia
Given that most of the incident dementia cases were AD type, we observed similar results compared with all-cause dementia as expected. The hazard for AD significantly increased as CSO PVS burden increased, independent of vascular risk factors, prevalent CVD, and WMHV. BG PVS burden was also associated with higher AD hazard independent of vascular risk factors and prevalent CVD, but associations were attenuated and no longer significant after adjustment for WMHV. Analyses assessing the mixed PVS score showed significant associations of high PVS burden with incident AD driven by CSO PVS, but not BG.
VaD
Although we observed increasing incidence rates of VaD with higher PVS grades, we were unable to conduct multivariable analyses because of the small number of VaD events in subgroups of PVS burden (N = 36).
Multivariable Analyses Adjusted for CSVD and Neurodegeneration Measures
Measurements of CBI, TCBVr, and WMHV were available in the full sample with ePVS data. However, CMB ratings were only available in a much smaller subset of participants (n = 285), thus limiting interpretation of results as noted in the discussion section (additional data are listed in eTable 2, links.lww.com/WNL/C371). We conducted separate analyses using model 3 additionally adjusted for WMHV, CBI, TCBVr, or CMB (additional data are listed in eTable 2, links.lww.com/WNL/C371, in the Supplement). In analyses adjusted for CBI, no significant changes were observed. Adjustment for WMHV, CBI, or TCBVr attenuated the results remaining significant only for CSO PVS.
Clinical characteristics of the overall sample and the smaller sample with CMB data (N = 285) were similar. In the small sample with available CMB data, associations were attenuated. Effect sizes decreased toward the null and had large CIs, but as noted, this smaller sample does not represent the full sample included in the remaining analyses and should be interpreted with caution.
Discussion
In our population-based cohort study of asymptomatic individuals, we found that PVS burden was associated with increased risk of all-cause dementia and AD. The hazard increased as the burden of PVS increased and was independent of vascular risk factors and prevalent CVD. Nearly 16% of participants developed incident dementia over a median follow-up period of over 8 years and up to approximately 19 years and those with higher PVS burden had between 2-fold (for grade II) and 5-fold (for grade IV) higher risk. The associations of CSO PVS and incident dementia were independent of ischemic CSVD measures (represented by WMHV and CBI) and neurodegeneration (represented by TCBVr) but not for BG PVS. CMB data were only available in a subset of participants, in whom lobar CMB seemed to attenuate the relations, but need to be interpreted with caution given the much smaller sample studied.
If indeed PVS prove to represent glymphatic dysfunction, in addition to being considered a marker of CSVD, our results would support a role for both of these processes in the risk of dementia, with a dose-effect relation where increasing PVS burden was related to higher incident dementia.
Our results are consistent with several previous studies including smaller samples where PVS burden was associated with prevalent dementia,35,36 incident dementia,37,38 and 2 previous population-based studies.39 The effect sizes observed in ours and other studies suggest strong associations with higher burden PVS, despite differences in methodology used to rate PVS presence and burden. However, prior meta-analyses have found conflicting evidence in the relation of PVS and cognitive disorders. Heterogeneity most likely arises from differences in PVS rating methods and differences in sample characteristics. Our results suggest that the role of PVS burden as a subclinical marker of heightened dementia risk needs to be reconsidered, but further studies using automated, reliable quantitative methods of PVS measurements are needed to confirm our observations and affirm our hypothesis.
Our study expands previous studies by including a larger sample, a broader age range starting from middle age, and a longer follow-up period. The latter provides a clinically relevant observation as studies with short follow-up periods may not be able to detect incident dementia outcomes. Examination of survival analysis curves suggests that risk begins to diverge after around 4–5 years of follow-up, and the differences between PVS groups become more pronounced beyond 10 years. This observation suggests a long window of opportunity for potential preventive interventions for dementia after identification of high PVS burden. However, whether PVS burden may serve as surrogate marker and treatment target for dementia needs to be evaluated further in the context of clinical trials.
The underlying molecular mechanisms explaining the association of glymphatic dysfunction and CSVD with incident dementia remain to be fully elucidated, but some studies suggest that at least in some cases, it may involve pathways unrelated to Aβ.40 We speculate that possible mechanisms linking impaired vascular and perivascular function with dementia are complex and may invoke key processes in microvascular dysfunction such as endothelial dysfunction,41 blood-brain barrier dysfunction,42 impaired vasoreactivity,43 vessel stiffening, dysfunctional blood flow and interstitial fluid drainage,44 microvascular ischemia,45 and inflammation,46 many of which are likely to interact and lead to secondary neurodegeneration.
Our study has several strengths including its prospective cohort design, inclusion of a large sample with thorough characterization of confounders, inclusion of brain MRI markers of ischemic cerebrovascular disease to assess the independent role of PVS in dementia risk, and careful and accurate ascertainment of incident dementia over a long period. Brain MRI measurements were reliable and blinded to clinical and demographic characteristics and outcome ascertainment.
The study has some limitations. Selection of participants into this study was based on the availability of MRI. Participants included where generally healthier than those excluded as noted in supplementary Table 1 (links.lww.com/WNL/C371), potentially biasing our results toward lower risk. Although we used different MRI sequences to rate PVS using validated methods, we found that adjustment in the statistical models for MRI sequence (axial or coronal view) did not change the results. Finally, our results are mostly based on Framingham Heart Study participants of European ancestry, thus preventing generalization of results to other ethnic or racial groups.
In this large prospective cohort study of community-dwelling individuals free of stroke and dementia, higher burden of PVS, particularly in the CSO, was related to higher rates of incident dementia. The association showed a dose-effect relation and was independent of vascular risk factors. These findings suggest that PVS burden may be useful to identify individuals at increased risk of dementia in subclinical stages.
Glossary
- Aβ
beta amyloid
- AD
Alzheimer dementia
- BG
basal ganglia
- CAA
cerebral amyloid angiopathy
- CBI
covert brain infarcts
- CMB
cerebral microbleeds
- CSO
centrum semiovale
- CVD
cardiovascular disease
- CVSD
cerebral small vessel disease
- DBP
diastolic blood pressure
- DSM IV
Diagnostic and Statistical Manual of Mental Disorders, 4th edition
- HR
hazard ratio
- ICC
intraclass correlation coefficient
- FHS
Framingham Heart Study
- PVS
perivascular spaces
- SBP
systolic blood pressure
- TCBVr
total cranial to brain volume
- TE
echo time
- VaD
vascular dementia
- WMHV
white matter hyperintensity volume
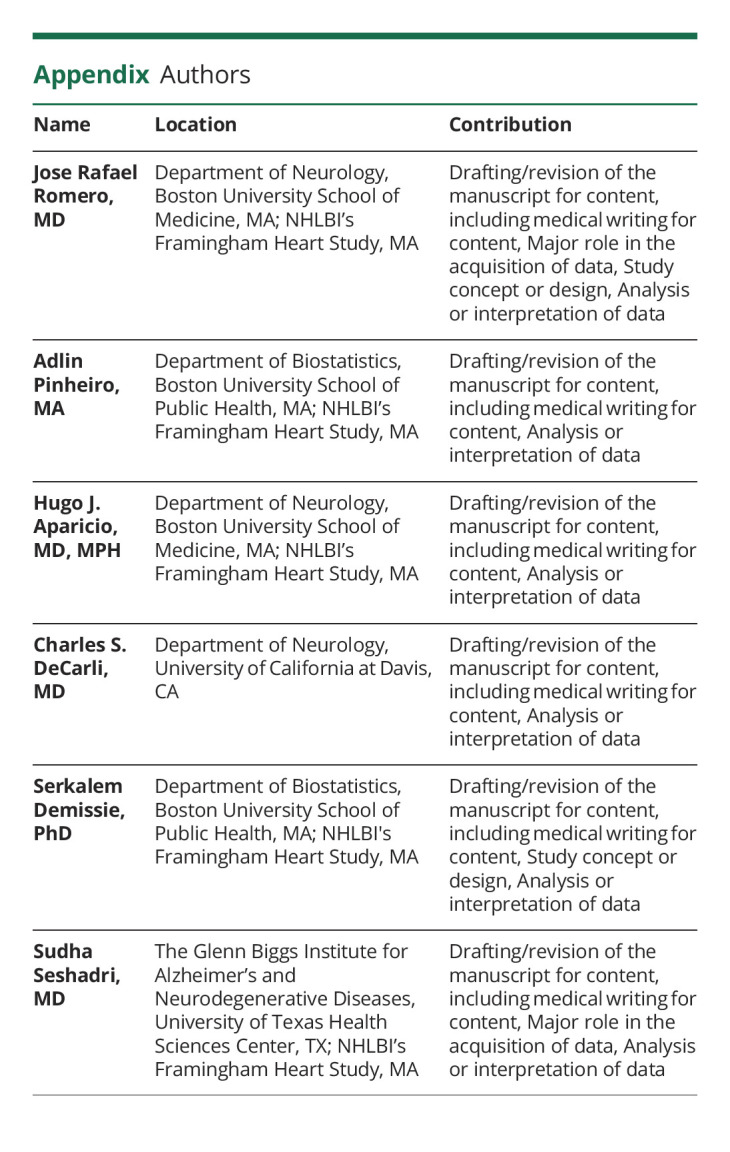
Appendix. Authors
Footnotes
Study Funding
This work (design and conduct of the study, collection and management of the data) was supported by the Framingham Heart Study's National Heart, Lung, and Blood Institute contract (N01-HC-25195, HHSN268201500001I) and by grants from the National Institute of Neurologic Disorders and Stroke (R01-NS017950-37), the National Institute on Aging (R01 AG059725, AG008122, AG054076, K23AG038444, R03 AG048180-01A1, AG033193), NIH grant (P30 AG010129).
Disclosure
The authors report no relevant disclosures. Go to Neurology.org/N for full disclosures.
References
- 1.Matthews KA, Xu W, Gaglioti AH, et al. Racial and ethnic estimates of Alzheimer's disease and related dementias in the United States (2015-2060) in adults aged >/=65 years. Alzheimers Dement. 2019;15(1):17-24. [DOI] [PMC free article] [PubMed] [Google Scholar]
- 2.Collaborators GBDD. Global, regional, and national burden of Alzheimer's disease and other dementias, 1990-2016: a systematic analysis for the Global Burden of Disease Study 2016. Lancet Neurol. 2019;18(1):88-106. [DOI] [PMC free article] [PubMed] [Google Scholar]
- 3.Benveniste H, Liu X, Koundal S, Sanggaard S, Lee H, Wardlaw J. The glymphatic system and waste clearance with brain aging: a review. Gerontology. 2019;65(2):106-119. [DOI] [PMC free article] [PubMed] [Google Scholar]
- 4.Jiang Y, Wang Y, Yuan Z, et al. Total cerebral small vessel disease burden is related to worse performance on the mini-mental state examination and incident dementia: a prospective 5-year follow-up. J Alzheimers Dis. 2019;69(1):253-262. [DOI] [PubMed] [Google Scholar]
- 5.Iadecola C. The neurovascular unit coming of age: a journey through neurovascular coupling in health and disease. Neuron. 2017;96(1):17-42. [DOI] [PMC free article] [PubMed] [Google Scholar]
- 6.Iliff JJ, Wang M, Liao Y, et al. A paravascular pathway facilitates CSF flow through the brain parenchyma and the clearance of interstitial solutes, including amyloid beta. Sci Transl Med. 2012;4(147):147ra111. [DOI] [PMC free article] [PubMed] [Google Scholar]
- 7.Pollock H, Hutchings M, Weller RO, Zhang ET. Perivascular spaces in the basal ganglia of the human brain: their relationship to lacunes. J Anat. 1997;191(Pt 3):337-346. [DOI] [PMC free article] [PubMed] [Google Scholar]
- 8.Rauch SM, Huen K, Miller MC, et al. Changes in brain beta-amyloid deposition and aquaporin 4 levels in response to altered agrin expression in mice. J Neuropathol Exp Neurol. 2011;70(12):1124-1137. [DOI] [PMC free article] [PubMed] [Google Scholar]
- 9.Hoddevik EH, Khan FH, Rahmani S, Ottersen OP, Boldt HB, Amiry-Moghaddam M. Factors determining the density of AQP4 water channel molecules at the brain-blood interface. Brain Struct Funct. 2017;222(4):1753-1766. [DOI] [PMC free article] [PubMed] [Google Scholar]
- 10.Zeppenfeld DM, Simon M, Haswell JD, et al. Association of perivascular localization of aquaporin-4 with cognition and Alzheimer disease in aging brains. JAMA Neurol. 2017;74(1):91-99. [DOI] [PubMed] [Google Scholar]
- 11.Mestre H, Tithof J, Du T, et al. Flow of cerebrospinal fluid is driven by arterial pulsations and is reduced in hypertension. Nat Commun. 2018;9(1):4878. [DOI] [PMC free article] [PubMed] [Google Scholar]
- 12.Wardlaw JM, Benveniste H, Nedergaard M, et al. Perivascular spaces in the brain: anatomy, physiology and pathology. Nat Rev Neurol. 2020;16(3):137-153. [DOI] [PubMed] [Google Scholar]
- 13.Doubal FN, MacLullich AM, Ferguson KJ, Dennis MS, Wardlaw JM. Enlarged perivascular spaces on MRI are a feature of cerebral small vessel disease. Stroke. 2010;41(3):450-454. [DOI] [PubMed] [Google Scholar]
- 14.Smeijer D, Ikram MK, Hilal S. Enlarged perivascular spaces and dementia: a systematic review. J Alzheimers Dis. 2019;72(1):247-256. [DOI] [PMC free article] [PubMed] [Google Scholar]
- 15.Francis F, Ballerini L, Wardlaw JM. Perivascular spaces and their associations with risk factors, clinical disorders and neuroimaging features: a systematic review and meta-analysis. Int J Stroke. 2019;14(4):359-371. [DOI] [PubMed] [Google Scholar]
- 16.Charidimou A, Meegahage R, Fox Z, et al. Enlarged perivascular spaces as a marker of underlying arteriopathy in intracerebral haemorrhage: a multicentre MRI cohort study. J Neurol Neurosurg Psychiatry. 2013;84(6):624-629. [DOI] [PMC free article] [PubMed] [Google Scholar]
- 17.Charidimou A, Boulouis G, Pasi M, et al. MRI-visible perivascular spaces in cerebral amyloid angiopathy and hypertensive arteriopathy. Neurology. 2017;88(12):1157-1164. [DOI] [PMC free article] [PubMed] [Google Scholar]
- 18.Rensink AA, de Waal RM, Kremer B, Verbeek MM. Pathogenesis of cerebral amyloid angiopathy. Brain Res Brain Res Rev. 2003;43(2):207-223. [DOI] [PubMed] [Google Scholar]
- 19.Jellinger KA. Alzheimer disease and cerebrovascular pathology: an update. J Neural Transm. 2002;109(5-6):813-836. [DOI] [PubMed] [Google Scholar]
- 20.Toledo JB, Arnold SE, Raible K, et al. Contribution of cerebrovascular disease in autopsy confirmed neurodegenerative disease cases in the National Alzheimer's Coordinating Centre. Brain. 2013;136(Pt 9):2697-2706. [DOI] [PMC free article] [PubMed] [Google Scholar]
- 21.DeCarli C, Massaro J, Harvey D, et al. Measures of brain morphology and infarction in the framingham heart study: establishing what is normal. Neurobiol Aging. 2005;26(4):491-510. [DOI] [PubMed] [Google Scholar]
- 22.Sarnowski C, Satizabal CL, DeCarli C, et al. Whole genome sequence analyses of brain imaging measures in the Framingham Study. Neurology. 2018;90(3):e188-e196. [DOI] [PMC free article] [PubMed] [Google Scholar]
- 23.Wardlaw JM, Smith EE, Biessels GJ, et al. Neuroimaging standards for research into small vessel disease and its contribution to ageing and neurodegeneration. Lancet Neurol. 2013;12(8):822-838. [DOI] [PMC free article] [PubMed] [Google Scholar]
- 24.Greenberg SM, Vernooij MW, Cordonnier C, et al. Cerebral microbleeds: a guide to detection and interpretation. Lancet Neurol. 2009;8(2):165-174. [DOI] [PMC free article] [PubMed] [Google Scholar]
- 25.Jefferson AL, Massaro JM, Wolf PA, et al. Inflammatory biomarkers are associated with total brain volume: the Framingham Heart Study. Neurology. 2007;68(13):1032-1038. [DOI] [PMC free article] [PubMed] [Google Scholar]
- 26.Seshadri S, Beiser A, Au R, et al. Operationalizing diagnostic criteria for Alzheimer's disease and other age-related cognitive impairment-Part 2. Alzheimer's Dement. 2011;7(1):35-52. [DOI] [PMC free article] [PubMed] [Google Scholar]
- 27.Seshadri S, Wolf PA, Beiser A, et al. Lifetime risk of dementia and Alzheimer's disease. The impact of mortality on risk estimates in the Framingham Study. Neurology. 1997;49(6):1498-1504. [DOI] [PubMed] [Google Scholar]
- 28.American-Psychatric-Association. Diagnostic and Statistical Manual of Mental Disorders, 4th ed ed; 2000. [Google Scholar]
- 29.McKhann G, Drachman D, Folstein M, Katzman R, Price D, Stadlan EM. Clinical diagnosis of Alzheimer's disease: report of the NINCDS-ADRDA work group under the auspices of department of health and human services task force on Alzheimer's disease. Neurology. 1984;34(7):939-944. [DOI] [PubMed] [Google Scholar]
- 30.Roman GC, Tatemichi TK, Erkinjuntti T, et al. Vascular dementia: diagnostic criteria for research studies. Report of the NINDS-AIREN International Workshop. Neurology. 1993;43(2:250-260. [DOI] [PubMed] [Google Scholar]
- 31.Elosua R, Ordovas JM, Cupples LA, et al. Association of APOE genotype with carotid atherosclerosis in men and women: the Framingham Heart Study. J Lipid Res. 2004;45(10):1868-1875. [DOI] [PubMed] [Google Scholar]
- 32.Raber J, Huang Y, Ashford JW. ApoE genotype accounts for the vast majority of AD risk and AD pathology. Neurobiol Aging. 2004;25(5):641-650. [DOI] [PubMed] [Google Scholar]
- 33.Maxwell SS, Jackson CA, Paternoster L, et al. Genetic associations with brain microbleeds: systematic review and meta-analyses. Neurology. 2011;77(2):158-167. [DOI] [PMC free article] [PubMed] [Google Scholar]
- 34.Framingham Heart Study. Three Generations of Dedication. [online]. Accessed October 7, 2022. Available at: https://www.framinghamheartstudy.org/.
- 35.Hansen TP, Cain J, Thomas O, Jackson A. Dilated perivascular spaces in the Basal Ganglia are a biomarker of small-vessel disease in a very elderly population with dementia. AJNR Am J Neuroradiol. 2015;36(5):893-898. [DOI] [PMC free article] [PubMed] [Google Scholar]
- 36.Ramirez J, Berezuk C, McNeely AA, Scott CJ, Gao F, Black SE. Visible Virchow-Robin spaces on magnetic resonance imaging of Alzheimer's disease patients and normal elderly from the Sunnybrook Dementia Study. J Alzheimers Dis. 2015;43(2):415-424. [DOI] [PubMed] [Google Scholar]
- 37.Rensma SP, van Sloten TT, Launer LJ, Stehouwer CDA. Cerebral small vessel disease and risk of incident stroke, dementia and depression, and all-cause mortality: a systematic review and meta-analysis. Neurosci Biobehav Rev. 2018;90:164-173. [DOI] [PMC free article] [PubMed] [Google Scholar]
- 38.Paradise M, Crawford JD, Lam BCP, et al. Association of dilated perivascular spaces with cognitive decline and incident dementia. Neurology. 2021;96(11):e1501-e1511. [DOI] [PMC free article] [PubMed] [Google Scholar]
- 39.Zhu YC, Dufouil C, Soumare A, Mazoyer B, Chabriat H, Tzourio C. High degree of dilated Virchow-Robin spaces on MRI is associated with increased risk of dementia. J Alzheimers Dis. 2010;22(2):663-672. [DOI] [PubMed] [Google Scholar]
- 40.Banerjee G, Kim HJ, Fox Z, et al. MRI-visible perivascular space location is associated with Alzheimer's disease independently of amyloid burden. Brain. 2017;140(4):1107-1116. [DOI] [PubMed] [Google Scholar]
- 41.Wang F, Cao Y, Ma L, Pei H, Rausch WD, Li H. Dysfunction of cerebrovascular endothelial cells: prelude to vascular dementia. Front Aging Neurosci. 2018;10:376. [DOI] [PMC free article] [PubMed] [Google Scholar]
- 42.Cai Z, Qiao PF, Wan CQ, Cai M, Zhou NK, Li Q. Role of blood-brain barrier in Alzheimer's disease. J Alzheimers Dis. 2018;63(4):1223-1234. [DOI] [PubMed] [Google Scholar]
- 43.Alwatban M, Murman DL, Bashford G. Cerebrovascular reactivity impairment in preclinical Alzheimer's disease. J Neuroimaging. 2019;29(4):493-498. [DOI] [PubMed] [Google Scholar]
- 44.Wardlaw JM, Smith C, Dichgans M. Small vessel disease: mechanisms and clinical implications. Lancet Neurol. 2019;18(7):684-696. [DOI] [PubMed] [Google Scholar]
- 45.Mast H, Tatemichi TK, Mohr JP. Chronic brain ischemia: the contributions of Otto Binswanger and Alois Alzheimer to the mechanisms of vascular dementia. J Neurol Sci. 1995;132(1):4-10. [DOI] [PubMed] [Google Scholar]
- 46.Hakim AM. A proposed hypothesis on dementia: inflammation, small vessel disease, and hypoperfusion is the sequence that links all harmful lifestyles to cognitive impairment. Front Aging Neurosci. 2021;13:679837. [DOI] [PMC free article] [PubMed] [Google Scholar]
Associated Data
This section collects any data citations, data availability statements, or supplementary materials included in this article.
Data Availability Statement
Data from this manuscript may be shared with qualified investigators following FHS data sharing procedures outlined at Ref. 34.


