

Abstract
The structure of a 23 nt RNA sequence, rGGACCCGGGCUCAACCUGGGUCC, was elucidated using homonuclear NMR, distance geometry and restrained molecular dynamics. This RNA is analogous to residues 612–628 of the Escherichia coli 16S rRNA. The structure of the RNA reveals the presence of a pentaloop closed by a duplex stem in typical A-form conformation. The loop does not form a U-turn motif, as previously predicted. A non-planar A·C·A triple base interaction (hydrogen bonds A13 NH6–C10 O2 and C10 N3–A14 NH6) stabilizing the loop structure is inferred from structure calculations. The CUCAA loop structure is asymmetrical, characterized by a reversal of the phosphodiester backbone at the UC step (hydrogen bond C12 NH4–C10 O2′) and 3′-stacking within the CAA segment. Loop base U11 is oriented towards the major groove and the consecutive adenosines on the 3′-end of the loop are well stacked, exposing their reactive functional groups in the minor groove defined by the duplex stem. The solution structure of the loop resembles that seen in the 3.3 Å X-ray structure of the entire 30S subunit, where the analogous loop interacts with a ribosomal protein and a receptor RNA helix.
INTRODUCTION
RNA hairpin loops are frequently highly structured and can play a pivotal role by acting as nucleation sites for the three-dimensional folding of the entire molecule (1). RNA loops frequently contain non-canonical mismatch pairs and base–phosphate, base–sugar and base stacking interactions (2). Mismatch pairs vary in geometry (3), facilitating exposure of reactive exocyclic functional groups to the major or the minor groove by the base participants, where they can be easily accessed by ligands (4–6). These potential hydrogen bond donor and acceptor groups are available for long-range tertiary interactions involving other RNA helices and proteins.
One such case (Fig. 1) is the CUCAA terminal pentaloop of helix 21 (positions 618–622) in the central domain of 16S rRNA near the binding site of ribosomal protein S8 (7). Analysis of 8513 homologous 16S rRNA sequences (Table 1) clearly shows that the CUCAA loop is the most conserved among the four terminal pentaloops in 16S rRNA. Recently, the structure of this loop has been determined by X-ray crystallography at 3.0 and 3.3 Å resolution within the context of the entire 30S ribosomal subunit by two different groups (8,9). These two structures differ significantly from one another. However, in both structures nucleotides A621 and A622 are well stacked and expose their reactive functional groups in the minor groove, which facilitates interactions with other RNA helices in the 16S rRNA. Moreover, there is evidence for base-specific hydrogen bonds between specific loop residues and ribosomal protein S4.
Figure 1.
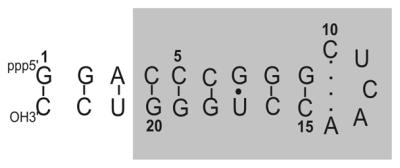
Secondary structure of the pentaloop containing a putative C·A mismatch. The shaded region corresponds to nucleotides that occur in E.coli 16S rRNA.
Table 1. Conservation statistics of pentaloops, along with the closing pairs occurring in 16S rRNA.
| Position | Sequencea | Conservation statisticsb |
|---|---|---|
| 617–623 | 5′-GCUCAAC-3′ | G99C99U97C62A97A99C99 |
| 840–846 | 5′-CCUUGAG-3′ | C32U23U73U49C29A54G36 |
| 1134–1140 | 5′-GUCCGGC-3′ | G22U89C20C12G50G58C21 |
| 1165–1171 | 5′-UGAUAAA-3′ | U56G97A59U44A97A99A41 |
aThe bold sequences represent the terminal pentaloops.
bThe suffix values indicate the percentage conservation (obtained from http://www.rna.icmb.utexas.edu/).
These studies are also in conflict with the earlier prediction that nucleotides C618 and A622 would form a non-canonical mismatch pair (10) to stabilize a U-turn motif (11). This common motif is characterized by cross-loop interactions stabilized by non-canonical hydrogen bonds and specific backbone torsion angle adjustments from the canonical value and has been observed in several RNAs, including the anticodon and the TψC loops of tRNA (12), stem–loop IIa of U2 small RNA (13), stable UNCG tetraloops (14) and hexaloops of 23S rRNA (15). The loop consensus sequence is NUNRN (N, any nucleotide; R, purine nucleotide). It is not clear whether the failure to form the expected U-turn is inherent in the particular sequence of the pentaloop or a consequence of interactions with other components of the ribosome. If the latter were the case, then the structural transitions required might be important to the assembly process. In order to resolve this issue and to better understand the significance of the differences between the two crystal structures we have re-examined this pentaloop in solution.
We herein describe the solution structure of a RNA hairpin containing the CUCAA loop. The hairpin sequence used is highly analogous to the 612–628 region of the intact Escherichia coli 16S rRNA. Homonuclear NMR, distance geometry (DG) and restrained molecular dynamics (rMD) were used to determine its three-dimensional structure. Sufficient distance and dihedral angle restraints were obtained from the NMR experiments to determine a unique structure. The CUCAA loop exhibits many common features of RNA hairpins. Consistent with the expected secondary structure, the stem region folds into a typical A-form helix with eight Watson–Crick base pairs and one G·U wobble pair. The loop region is closed by a non-canonical three base (A·C·A) interaction and is stabilized by 3′ base stacking. Despite the presence of the appropriate consensus sequence, U-turn folding does not occur in solution. This new RNA hairpin structure provides insight into the details of the 16S rRNA building blocks and facilitates an understanding of the versatile functions of rRNAs. The overall structural features of the CUCAA loop are compared to tetraloops, other RNA loops and the two crystal structures of the analogous sequence found in the 30S subunit.
MATERIALS AND METHODS
RNA sample preparation
The RNA oligonucleotide was synthesized enzymatically by T7 run-off transcription (16). The transcripts were precipitated in anhydrous ethanol at –80°C and purified on preparative denaturing 20% (w/v) polyacrylamide (19:1 acrylamide:bisacrylamide) gels. Gel bands were visualized by UV shadowing using fluorescent thin layer chromatography plates (Whatman) and that corresponding to the full-length product was collected and eluted from the gel using 0.5 M NH4OAC and 0.1 mM EDTA as the elution buffer. The sample was desalted using a Sep-pak column (Waters Inc.) as explained elsewhere (17). The sample was then extensively dialyzed against buffer containing 10 mM NaH2PO4/Na2HPO4, 0.1 mM EDTA, pH 6.5, (NMR buffer) using an Amicon-3 concentrator (Millipore). The dialyzed sample was lyophilized to dryness and then dissolved in 310 µl of either 90% H2O:10% D2O or 99.96% D2O (Cambridge Isotope Laboratories, Inc.) for NMR studies. The final sample concentration was 0.8 mM.
UV melting experiment
Thermal melting curves were recorded at 260 nm on a Cary 3E spectrophotometer (varian) equipped with a Peltier 12 cell holder capable of varying the temperature from 5 to 95°C. UV samples were transferred directly from the NMR sample (0.8 mM) and diluted to 1 ml using NMR buffer adjusted to pH 5.0, 6.5 or 7.0 to a final concentration of ∼3 µM. The samples were degassed by a brief sonication or under vacuum and covered with a drop of mineral oil (Sigma-Aldrich) to prevent buffer evaporation at high temperatures. The NMR buffer alone was used to reference the spectrophotometer. The temperature was increased at a rate of 0.5°C/min and the corresponding absorbance was monitored at 260 nm. All melting experiments were repeated at least three times. The melting temperature was derived from the hyperchromicity curves (see Supplementary Material). ΔG37°C under three different pH conditions was derived from a two-state analysis of the melting profiles using the MeltWin program (18) and/or a similar approach using Excel software. The reported Tm and thermodynamic parameter values are averages of three experimental data sets (see Supplementary Material).
NMR methods
All NMR experiments were carried out using a Bruker AMX-II 600 MHz NMR spectrometer. The sample was analyzed in 90% H2O:10% D2O to observe exchangeable protons and 99.96% D2O to observe non-exchangeable protons. All two-dimensional (2D) data were processed using the UXNMR program (Bruker Instruments) and FELIX98 (Biosym/Molecular Simulations). Exchangeable protons were assigned using a combination of one-dimensional (1D) melting profiles and 2D nuclear Overhauser effect spectroscopy (NOESY) spectra in 90% H2O:10% D2O using a jump–return pulse sequence for water suppression (19). Non-exchangeable proton resonances were assigned from 2D NOESY spectra (50, 100, 160, 250 and 500 ms) recorded in the temperature range 7–35°C (4–5.0 s repetition delay, 9 p.p.m. spectral width, 4096 t2 and 512 t1 data points) and from double quantum filtered spectroscopy (DQF-COSY), total correlation spectroscopy (TOCSY) (80 ms) and correlation spectroscopy (COSY35) (20). Translational diffusion constants of the RNA oligomer and a reference DNA oligomer (DT) were determined with pulsed field gradient (PFG) NMR experiments (21–24) by incorporating the peak intensities of the aromatic resonances in the equation ln(A′) = –(γδg)2(Δ – δ/3)DT + ln(A0). In this equation, A′ and A0 are the intensities with and without the PFG, γ is the gyromagnetic ratio (rad T–1 S–1), δ is the pulse duration, and Δ is the delay time between the two PFG pulses. Backbone phosphorous assignments were obtained by using a combination of 31P 1D and proton detected 1H-31P hetero-nuclear correlation spectroscopy (HETCOR) spectra (sweep width 3012 Hz in the proton and 1814 Hz in the phosphorous dimensions and a repetition delay of 2 s) recorded at 25°C (25).
Structural restraints
The majority of 1H assignments were obtained from the NOESY spectra recorded at 25°C (500 ms, non-exchangeable protons). NOE cross-peaks were integrated using FELIX98 software (Biosym/MSI, Inc.). Distance restraints were derived from NOE assignments of the non-exchangeable and exchangeable proton resonances. The cross-peak volumes obtained from three mixing times (50, 100 and 250 ms) were converted to distances iteratively using the MARDIGRAS program as described previously (26). NOESY cross-peaks that were medium to strong in the 50 ms spectra were assigned a distance of 2.4 ± 0.6 Å. Peaks that were medium to strong in the 100 ms spectra but absent or weak in the 50 ms spectra were assigned a distance of 3.0 ± 1 Å. Peaks that were weak to medium in the 250 ms spectra were assigned a distance of 4.0 ± 1 Å.
A total of 123 experimentally derived distance restraints were used to determine the structure of the loop. This included 36 sequential inter-residue distances and 87 intra-residue distances. Since the NMR spectral features of the stem region are indicative of a standard A-form RNA duplex, the A-form geometry of the stem region was maintained using experimental restraints (258 distances derived using MARDIGRAS) in combination with restraints from an A-form model duplex (304 inter-residue and 356 intra-residue distances) generated using Quanta98. An additional 50 restraints were included to maintain the Watson–Crick geometry between the stem residues.
Sugar pucker (δ) conformations were derived from the H1′–H2′ scalar coupling and the backbone torsion angle values were estimated from the 1H-31P correlations. Analysis of DQF-COSY and COSY35 spectra recorded at 25°C yielded coupling constant values for the H1′–H2′ cross-peaks (Table 3). Residues with 3JH1′ – H2′ couplings <3 Hz and 3JH3′ – H4′ couplings >7–8 Hz were restrained to the C3′-endo conformation (80° ± 20°). Residues with 3JH1′ – H2′ couplings >7–8 Hz and 3JH3′ – H4′ couplings, clearly absent from the DQF-COSY spectra, were restrained to the C2′-endo conformation corresponding to a δ torsion angle of 140° ± 20°. Residues with large 3JH1′ – H2′ and 3JH3′ – H4′ couplings were left unrestrained, to allow conformational averaging between the C2′-endo and C3′-endo conformations. The backbone torsion angles of the stem residues were constrained to A-form values (α = –68° ± 15°, β = 178° ± 15°, γ = 54° ± 15°, ɛ = –153° ± 15°, ζ = –71° ± 15°). For the loop residues all the torsion angles were left unconstrained except ɛ, which was loosely constrained (–120° ± 120°) to exclude the gauche+ conformation.
Table 3. Proton–proton coupling constants for the loop region, estimated from the high resolution DQF-COSY and COSY35 spectra recorded at 25°C.
| Name | H1′–H2′ | H2′–H3′ | H3′–H4′ |
|---|---|---|---|
| G9 | <3 | a | a |
| C10 | ∼4 | a | 7.2 |
| U11 | 8.2 | a | b |
| C12 | 8.0 | 6 | a |
| A13 | 7.5c | 10.0c | 8.3c |
| A14 | 5.7c | a | a |
| C15 | <3 | a | a |
aCoupling constant values could not be deteremined due to severe overlap.
bJ couplings clearly absent from the spectra.
cCoupling constant values were estimated from the DQF-COSY spectra recorded at 35°C.
Structure calculations
All structure calculations were performed using XPLOR 3.1 (27) (DG and rMD methods), incorporating the distance and torsion angle restraints obtained from the NMR data. Structure calculations were initiated with DG embedding. A total of 300 DG structures were calculated without using the dihedral restraints from a linear single-stranded A-form RNA as template. A simulated annealing protocol was used to regularize the DG structures. These structures were visualized using Quanta98 and those with acceptable global folds were selected based on visualization, least NOE violations and minimum energy criteria. Subsequent refinement was carried out using rMD simulations. Typical rMD simulations started with 1000 steps of Powell energy minimization with dihedral angle restraints. Subsequently, the structures were heated from 27°C (300 K) to 727°C (1000 K) and subjected to Verlet MD simulations over a period of 15 ps with a 0.5 fs time step and equilibrated at 727°C for 0.5 ps. The force constants of the distance and dihedral restraints were scaled up to 40 kcal/(mol Å2). The structures were then cooled to 27°C (300 K) over 8 ps with a 0.5 fs time step and further minimized for 400 steps.
In the first stage of rMD simulations, 33 structures were selected based on their total minimum energies, loop base and the closing stem base pair conformations. At each stage of the structure calculation the resulting structures were analyzed for chirality, torsion angle and NOE violations. A final round of rMD simulations of the 33 structures yielded the 10 best convergent structures. The statistics for the final 10 convergent structures are presented in Table 4. The structure and torsion angle statistics were generated using appropriate XPLOR scripts. These final structures all have satisfactory bond and angle geometries and are in good agreement with experimental data. A simulated NOESY spectrum was generated from the average structure (see Supplementary Material). Comparison of the simulated and experimental data sets shows a very good agreement in the base–sugar regions.
Table 4. Statistics of the pentaloop structure calculationa.
| Distance restraints | |||
| Loop intra-residue | 87 | ||
| Loop inter-residue | 36 | ||
| Stem region (A-form) | 918 | ||
| WC | 50 | ||
| Violationsb | |||
| NOE | |||
| Stem (>0.4 Å) | 0 | ||
| Loop (>0.4 Å) | 0 | ||
| WC (>0.4 Å) | 0 | ||
| Bond (>0.10 Å) | 0 | ||
| Improper (>15°) | 0 | ||
| Angle (>5°) | 1 | ||
| Dihedral (>10°) | 0 | ||
| RMSD of residues relative to mean structurec | |||
| All residues | |||
| All atoms | 0.577 ± 0.10 | ||
| Non-hydrogen atoms | 0.599 ± 0.11 | ||
| Loop residues | |||
| All atoms | 1.34 ± 0.40 | ||
| Non-hydrogen atoms | 0.60 ± 0.10 | ||
| Angle | 0.73 ± 0.007 | ||
| Improper | 0.38 ± 0.01 | ||
| Dihedral | 1.00 ± 0.30 |
a Parameters were derived from the final 10 structures.
bValues in parentheses are violation thresholds.
cThese values were generated upon comparison with an average structure.
RESULTS
Hairpin characterization
The sequence of the RNA hairpin used in this study is shown in Figure 1. The nucleotides that appear within the shaded region specifically correspond to the 612–628 region of the E.coli 16S rRNA. To establish unimolecular folding of the RNA molecule, PFG experiments were carried out in a parallel fashion on the RNA and a standard DNA sample (16mer duplex) under similar experimental conditions. From the PFG experiments, the translational diffusion constant (DT) of the pentaloop was estimated to be 0.562 × 10⁻⁶ cm2/s (see Supplementary Material). The Dmonomer:Ddimer ratio was determined to be 1.37, which is close to the value reported for monomeric hairpin molecules in the literature (24). This finding is also supported by the observation of a single melting transition (pH 6.5) in the optical melting studies carried out under the same buffer conditions as that for the NMR sample (see Supplementary Material). Similar observations were previously made for CUUG (28) and UGAA (29) tetraloops, in which RNA samples with concentrations <1 mM folded into a monomeric hairpin loop under low salt conditions. A single H5–H6 cross-peak for the 12 pyrimidines in the RNA further confirmed the conformational homogeneity of the NMR sample (data not shown). From these three experiments it was concluded that under NMR conditions the pentaloop folded into a monomeric hairpin.
Chemical shift assignments
Nearly complete resonance assignments were obtained, particularly for the loop residues (Table 2). A combination of 1D melting profiles and 2D NMR spectra recorded at 0°C in 90% H2O was used to assign the imino protons of the Watson–Crick base pairs in the stem region (Figs 2 and 3). The imino proton resonances of base pairs in the stem region were observed as well-resolved peaks. The A3–U21 pair in the stem region was identified by the characteristic downfield imino resonance of the U and an intense cross-peak between the imino proton of U21 and the H2 of A3. The G7·U17 wobble pair was identified by the strong cross-peak between the two imino protons, observed in the imino–imino region of the 2D spectra (30). These assignments established a starting point for assignment of the imino protons of other stem residues, identified by their characteristic sequential connectivities (as observed in the exchangeable 2D NOESY spectra). There are five guanines on the 5′-side and three guanines and two uridines on the 3′-side of the pentaloop. The sequential walk in the imino region was initiated by identification of the most downfield shifted imino proton of U21, which forms a Watson–Crick pair with A3. This proton gives a NOE cross-peak to the imino proton of the neighboring G20. Identification of the imino protons of G8 and G18 was facilitated by the NOE cross-peaks between the imino protons of these two residues and the imino protons of the G7·U17 wobble pair, which had been assigned previously without ambiguity. The imino proton of G9 was identified by its cross-peak with that of G8 and this assignment was further confirmed by its correlation to amino/H5 of C15, its base pairing partner. The imino proton of G19 was identified by the network of cross-peaks established between this proton and the amino/H5 correlation of C5, its base pair partner. Clear correlation between the amino/imino region of G20 and G19 further confirmed these assignments. The imino proton of G2 showed clear cross-peak correlation to the amino protons of C22, which in turn had cross-peaks to its own H5 proton. The only imino proton left which did not have any correlations to any other peaks was assigned to G1. The imino proton of the loop U11 could not be assigned due to lack of a peak in the 1D NMR spectra, indicating that this base is solvent-accessible. The characteristic connectivities between imino protons of guanines and amino protons and H5 protons of cytidines observed in the imino–amino/base proton regions of the H2O NOESY spectrum (Fig. 3) were in agreement with the assignments of H5 protons established in the non-exchangeable proton spectra.
Table 2. Proton and phosphorous chemical shifts of the pentaloopa.
| Residue | NH | NH2,b/NH2,nb | H6/H8 | H5/H2 | H1′ | H2′ | H3′ | H4′ | H5′/H5″ | 31P |
|---|---|---|---|---|---|---|---|---|---|---|
| aChemical shift assignments (p.p.m.) were obtained from the 2D NOESY spectra recorded at 0°C (for exchangeable protons), 25°C (for non-exchangeable protons) and 1H-31P HETCOR spectra at 25°C. | ||||||||||
| G1 | 12.93 | 8.12 | 5.77 | 4.89 | 4.73 | 4.51 | 4.25 | |||
| G2 | 12.58 | 7.59 | 5.85 | 4.62 | 4.59 | 4.54 | 4.46 | –3.65 | ||
| A3 | 8.25/6.62 | 7.87 | 7.80 | 5.99 | 4.55 | 4.55 | 4.14 | –3.86 | ||
| C4 | 8.65/7.04 | 7.36 | 5.21 | 5.35 | 4.25 | 4.00 | 4.38 | –3.67 | ||
| C5 | 8.31/7.18 | 7.72 | 5.45 | 5.45 | 4.34 | |||||
| C6 | 8.32/6.87 | 7.69 | 5.49 | 5.56 | 4.56 | |||||
| G7 | 10.22 | 7.49 | 5.68 | 4.75 | 4.23 | 4.04/4.28 | ||||
| G8 | 12.71 | 7.14 | 5.71 | 4.58 | 4.22 | –3.85 | ||||
| G9 | 12.19 | 7.06 | 5.73 | 4.51 | 4.34 | 4.01 | ||||
| C10 | 7.70 | 5.48 | 5.65 | 4.08 | 4.51 | 4.39 | –4.29 | |||
| U11 | 7.90 | 5.87 | 5.94 | 4.46 | 4.37 | 4.17 | 4.08/4.01 | –3.40 | ||
| C12 | 7.51 | 5.76 | 5.48 | 3.95 | 4.37 | 3.82 | 3.44/3.64 | -3.96 | ||
| A13 | 8.30 | 8.13 | 6.00 | 4.82 | 4.93 | 4.51 | 3.91/4.02 | –3.31 | ||
| A14 | 8.55 | 8.17 | 6.00 | 4.82 | 4.65 | 4.26 | 3.91/4.20 | –3.45 | ||
| C15 | 8.22/6.83 | 7.60 | 5.48 | 5.38 | 4.30 | 4.20 | 4.43 | –3.66 | ||
| C16 | 7.66 | 5.45 | 5.68 | 4.55 | 4.30 | –3.34 | ||||
| U17 | 11.65 | 7.74 | 5.68 | 5.64 | 4.30 | |||||
| G18 | 12.71 | 7.84 | 5.72 | 4.66 | 4.10 | |||||
| G19 | 7.21 | 5.74 | 4.54 | 4.43 | 4.05 | |||||
| G20 | 13.28 | 7.18 | 5.75 | 4.47 | –3.98 | |||||
| U21 | 14.40 | 8.48/7.03 | 7.74 | 5.05 | 5.57 | 4.52 | 4.47 | |||
| C22 | 7.86 | 5.65 | 5.58 | 4.23 | 4.43 | 4.32 | 4.05/4.52 | –3.85 | ||
| C23 | 7.66 | 5.51 | 5.70 | 3.95 | 4.13 | 4.11 | 4.46/3.99 | |||
Figure 2.

Imino proton spectrum of the RNA hairpin (0°C). Imino protons involved in Watson–Crick pairs and the G·U wobble pair are shown.
Figure 3.

Expanded 2D NOESY spectrum in H2O representing the imino (F2) and amino/base (F1) proton connectivities. Imino proton assignments are displayed in the top half of the figure; the vertical lines indicate resonances of amino and base protons of the pairs in the helical stem.
The non-exchangeable proton resonances were assigned using a combination of 2D NOESY, DQF-COSY, COSY35 and TOCSY spectra. Figure 4 shows the expanded 2D NOESY spectra (500 ms) collected at 25°C representing correlations between the base and H1′/H5 regions. The H5–H6 cross-peaks of the cytidines and uridines were assigned by the intense scalar couplings observed between these sets of protons in the DQF-COSY, COSY35 and TOCSY spectra, and were confirmed by the inter- and intra-residue NOEs associated with these resonances. As mentioned previously, a single H5–H6 cross-peak for each of the 12 pyrimidine residues confirmed the conformational homogeneity of the NMR sample. The complete base–H1′ connectivities were obtained using the 2D NOESY spectra recorded at 25 and 35°C.
Figure 4.

Expanded 2D NOESY spectra (500 ms) recorded at 25°C in D2O. NOE connectivities from base (F1) to sugar (F2) protons are displayed. Residue numbers indicate intra-residue NOEs and sequential NOEs are traced by solid lines. Pyrimidine H5–H6 cross-peaks are marked with *. NOEs related to AH2 protons are indicated by dotted lines. The base–H1′ sequential walk is traced in blue on the 5′-half (G1–G9), green on the 3′-half (C15–C23) and red in the loop region (C10–A14). The arrows indicate weak interactions between H2 protons of A13 and A14 and H1′ protons of C10 and U11.
In Figure 4 the aromatic/anomeric sequential walk on the 5′-half (G1–G9) is shown in blue and the 3′-half (C15–C23) is shown in green. The sequential connectivities of the loop residues (C10–A14) are shown in red. The connectivity between C12 and A13 was observed only as a weak peak in the lower mixing time data. The H1′ protons of A13 and A14 overlapped in the 2D NOESY recorded at 25°C, whereas at 35°C they were clearly separated (see Supplementary Material). The intensities of the base–H1′ connectivities of all residues were much weaker than the H5–H6 cross-peaks of the pyrimidines observed in the short mixing time 2D NOESY spectra, verifying that the glycosidic angles of all residues are in the anti range. The proton and phosphorous chemical shifts are summarized in Table 2.
The H2 resonance of three adenosines in the pentaloop were identified from their long T1 values as compared to other protons in an inversion recovery experiment. The H2 resonance of A3 had previously been assigned in the exchangeable 2D NOESY experiment by its correlation with the imino proton of U21, its base pair partner. This assignment was further confirmed by the intense cross-peak between this proton and the H1′ protons of C4 and C22, as is normally observed in an A-form helix. The H2 resonances of A13 and A14 were distinguished from their H8 resonances based on an inversion recovery experiment. The A14 H2 resonance has an intense cross-peak to C15 H1′ and very weak cross-peaks to U11 H1′ and C10 H1′, both of which were only observed in the 500 ms NOESY spectra.
The H2′ protons were distinguished from the H3′ protons by the intense H1′–H2′ cross-peaks observed in the lower mixing time (50 ms) NOESY spectra, where spin diffusion is minimal. In an A-form helix the sugar conformations are C3′-endo, corresponding to a small 3JH1′ – H2′ coupling constant (<3 Hz). Consistent with the A-form geometry, all the stem residues, except the terminal G1 and C23, exhibited 3JH1′ – H2′ values <3 Hz, based on absence of the corresponding correlations in the DQF-COSY spectra (see Supplementary Material). These assignments were further confirmed by the intense cross-peaks between H6/H8(i + 1) and H2′i observed in the 2D NOESY spectra, which are characteristics of an A-form helix. Sequential connectivities between H6/H8(i + 1) and H2′i were also observed for stem residues.
The loop residues exhibited 3JH1′ – H2′ coupling constants in the range 4–8 Hz (Table 3). Residue C10 had a 3JH1′ – H2′ coupling constant of 4 Hz, indicating an intermediate sugar pucker. Residues U11 and C12 have large 3JH1′ – H2′ (∼8 Hz) and small 3JH3′ – H4′ (<3 Hz) scalar coupling values, indicative of a C2′-endo sugar conformer. The 3JH1′ – H2′ coupling constants of A13 and A14 could not be estimated with confidence due to the complexity of the peak shape. Based on the absence of intense H1′–H4′ cross-peaks for all residues in the lower mixing time 2D NOESY spectra, the O4′-endo sugar conformation was excluded.
The H3′(i) and 31P(i + 1) correlations were determined from the 1H-31P HETCOR spectra recorded at 25°C (Fig. 5). These assignments were further confirmed by the intense intra-residue H6/H8–H3′ cross-peaks. The 31P resonances of the pentaloop are clustered into two distinct sets. One set of 31P resonances resonate between –3.5 and –4.5 p.p.m., corresponding to stem residues. The other set, resonating between –3.2 and –3.5 p.p.m., arise primarily from the loop residues. Of the four resonances in the second set, only three could be unambiguously assigned. The peaks at –3.45, –3.40 and –3.31 p.p.m. were assigned to the A13pA14, C10pU11 and C12pA13 steps, respectively. Although, by a process of elimination, one can assign the remaining correlation to that of U11pC12, H3′ of U11, which was tentatively assigned in the non-exchangeable proton spectra, did not match with that in the 1H-31P HETCOR spectra. In order to address this ambiguity, the α and the ζ torsion angles (associated with the location of 31P resonances) of all the loop residues were left unconstrained.
Figure 5.

1H-31P correlation spectra recorded at 25°C representing H3′(i) (F2) and 31P(i + 1) (F1) connectivities. Cross-peaks assigned to the loop residues are labeled.
Spectral features at lower temperature and pH
In order to explore the effects of temperature and pH on the structure of the pentaloop, 2D NOESY spectra were recorded at 7°C and pH 5.0 (25°C). The spectra recorded at 7°C showed NOE patterns (stem region) similar to those recorded at room temperature, implying similarity of the overall stem structure at both temperatures. Except for A13 and A14, the other loop residues showed similar NOE patterns in both spectra. However, the H8 resonances of both A13 and A14 completely disappeared in the spectra recorded at 7°C (data not shown). These results indicate that at lower temperature the loop structure undergoes local dynamics, in particular the region involving A13 and A14.
Protonation of N1 of adenosine residues at lower pH has been observed in several RNA structures (31). In these structures the adenosines are often involved in the formation of a A+·C wobble mismatch. When this occurs the resonances associated with the adenosines sharpen upon lowering of the pH. The ideal candidates for such protonation in the CUCAA loop are A13 and A14. Upon lowering the pH to 5.0, resonances associated with the non-exchangeable protons of the loop region undergo line broadening, indicative of structural dynamics. The 2D NOESY spectra of the exchangeable protons recorded at 0°C had additional peaks other than the imino protons associated with the stem residues. This indicates the possibility of other minor conformations at lower pH. In fact, the profile variation of the UV melting transition at lower pH and its concentration dependence are suggestive of preferred self-duplex formation (data not shown). The broadening of resonances associated with the loop residues at pH 5.0 thus bears a direct correlation with a multimeric conformational exchange on a slow time scale.
Structural features inferred from NMR data
The stem region folds into a typical A-form double helix, as indicated by several characteristic features observed in the NMR spectra. The imino–amino/base connectivities and the sequential imino proton connectivities observed in the water NOESY spectra confirmed the presence of nine base pairs in the stem region. NOE connectivities of non-exchangeable proton resonances associated with the stem residues also supported A-form duplex formation. For the stem residues, the inter-residue NOEs between H6/H8i + 1 and H2′i were found to be more intense than NOEs between the intra-residue H6/H8i and H2′i. The absence of H1′–H2′ coupling in the DQF-COSY spectra indicates a small 3JH1′ – H2′ and hence a C3′-endo sugar pucker for all stem residues except the terminal residues. The terminal residues G1 and C23 exhibit a very small proportion of C2′-endo character, as is normally expected. In the light of this overwhelming experimental evidence that the stem region folds into a right-handed A-form duplex, standard A-form distances were used in conjunction with experimentally derived distances in elucidating the global fold.
The NOEs connecting the G9–C10 and A14–C15 steps (G9 H2′–C10 H6 and A14 H2′–C15 H6) indicate preservation of the A-form geometry at these steps, with residues C10 and A14 stacked above G9 and C15, respectively. The A H2 proton points into the minor groove of the A-form helix and has characteristic cross-peaks to the H1′ proton of the 3′ residues. This pattern of interaction is observed in the loop region, as indicated by an intense cross-peak between A14 H2 and C15 H1′. Very weak cross-peaks between A14 H2/U11 H1′ and A14 H2/C10 H1′ were observed in the longer mixing time 2D NOESY spectra (250 and 500 ms), consistent with the minor groove orientation of AH2.
The A-form character of the RNA diminishes at the C10–U11 step. Due to the overlapping nature of the C10 H1′ and C22 H5 resonances, the sequential connectivity at this step is not clearly defined. This indicates that U11 is not stacked in a helical stem. As a result, the U11 imino proton undergoes fast exchange with the solvent and is not observed in the 1D spectrum. Destacking of the U11 base is also supported by the downfield shift of the H6 resonance (7.90 p.p.m.) as compared to other U residues in the RNA (H6 of U17 and U21 resonate at 7.74 p.p.m.). At the U11–C12 step the sequential connectivity is well defined, even in the 100 ms spectra. This connectivity reflects the onset of 3′ base stacking. Weak long-range NOEs were observed between C10 H2′ and C12 H5/H6 in the 160, 250 and 500 ms spectra. These specific NOEs define the orientation of the C12 base in the minor groove.
Structure analysis
Initial structure calculations produced a variety of structures, all of which had C10 and A14 stacked on G9 and C15. These structures were readily divided into four families by examining the location of the loop bases (U11, C12 and A13) with respect to the major (M) and minor (m) grooves. Structures from all four families were subject to rMD calculations. Thirty-three structures belonging to the Mmm family had minimum energies (60–80 kcal/mol) and no NOE violations (see Materials and Methods). Structures from the other families were clearly not in agreement with the experimental data. Analysis of the best 33 structures allowed re-examination of the experimental data, which resulted in the identification of additional distances in the loop region. Final refinement of the 33 structures with the additional distances produced 10 convergent structures (Fig. 6A). The converged structures satisfied several criteria, including least NOE and chirality violations, minimum deviation from the ideal bond and angle geometry, low root-mean-square standard deviation (RMSD) and minimum total energies (Table 4). An average structure was used to generate a simulated NOESY spectrum (see Supplementary Material). This simulated NOESY spectrum is in excellent agreement with the experimental data, validating the calculated structures.
Figure 6.

High resolution structures of the pentaloop generated by distance geometry and restrained molecular dynamics. (A) Superimposition of 10 convergent structures with the lowest energy. Only non-hydrogen atoms are displayed for clarity. (B) A stereo view of the energy minimized average structure of the pentaloop along with the closing G9–C15 base pair. The closing G9–C15 base pair is shown in blue. The loop residues are shown in different colors. (C) Close up view of the A·C·A interaction observed in all structures. The amino proton of A13 is hydrogen bonded to the carbonyl group of C10 and N3 of C10 is hydrogen bonded to the amino proton of A14.
In accordance with the secondary structure and the experimental data, the stem region, including residues G1–G9 and C15–C23, folds into a canonical A-form helix and the loop residues smoothly finish the turn. The loop region is defined by a C10·A14 mismatch, which stacks above the closing Watson–Crick base pair, G9–C15. In addition, C12 and A13 stack on top of each other and above A14. U11 is slightly destacked above C10 and remains exposed to the solution.
In contrast to the A-form stem, the loop residues are flexible in the sugar pucker conformation. Except for C10, the 3JH1′ – H2′ coupling constant values of other loop residues indicate conformational flexibility (Table 3). Hence, the δ torsion angle of C10 was restrained to 80° ± 20° and that of the remaining loop residues were left unconstrained. In all the calculated structures both C10 and A14 adopt the C3′-endo sugar conformation, based on the gauche+ range of the endocyclic torsion angle δ (Table 5). This maintains the C1′–C1′ distance close to A-form RNA (10.55 Å) and also positions C10 and A14 to be hydrogen bonded via a single hydrogen bond between C10 N3 and A14 NH6. Residue U11 has significant C2′-endo conformation. The change in the sugar conformation of this loop residue from the normal C3′- to the C2′-endo conformation extends the sugar–phosphate backbone by >3 Å, thereby bridging the gap between the opposite strands of the stem region.
Table 5. Backbone torsion angles of the loop regiona.
| Residue | χ | δ | P | α | β | γ | ɛ | ζ |
|---|---|---|---|---|---|---|---|---|
| G9 | 163 ± 1 | 82 ± 1 | 18 ± 2 | –62 ± 4 | 177 ± 1 | 47 ± 2 | –137 ± 5 | –70 ± 8 |
| C10 | 158 ± 5 | 85 ± 1 | 3 ± 2 | –83 ± 2 | 187 ± 5 | 45 ± 6 | –136 ± 7 | –65 ± 7 |
| 205 ± 22 | ||||||||
| U11 | 166 ± 12 | 130 ± 18 | 138 ± 41 | –58 ± 12 | 168 ± 10 | 82 ±10 | –69 ± 13 | 130 ± 12 |
| –180 ± 20 | ||||||||
| C12 | 120 ± 3 | 80 ± 2 | 29 ± 7 | –228 ± 13 | 140 ± 13 | 61 ± 15 | –106 ± 12 | –122 ± 15 |
| A13 | 154 ± 2 | 80 ± 1 | 22 ± 3 | –52 ± 13 | 114 ± 13 | 70 ± 4 | –158 ± 4 | –53 ± 4 |
| A14 | 162 ± 2 | 84 ± 1 | 8 ± 2 | –85 ± 6 | 166 ± 3 | 67 ± 6 | –165 ± 2 | –68 ± 2 |
| C15 | 162 ± 1 | 81 ± 1 | 15 ± 1 | –54 ± 2 | 164 ± 2 | 62 ± 2 | –157 ± 2 | –70 ± 2 |
| A-formb | –154 | 83 | 14 | –90 | –149 | 47 | 175 | –45 |
| B-formb | –98 | 156 | –147 | –46 | –147 | 36 | 155 | –96 |
aThe mean ± standard deviation values were derived from the final 10 structures.
bValues were measured from the structures generated using the QUANTA program.
The glycosidic angle χ of the loop residues was constrained within ±30° of the normal range in the structure calculations. Table 5 shows that the glycosidic angles of C10, U11, A13 and A14 fall in the normal anti range and that of C12 is in the low anti range. The interaction between the amino group of C12 and the 2′-O of C10 could be facilitated by the low anti range of the glycosidic angle of C12.
DISCUSSION
Overview of the RNA hairpin
Ten refined structures of the RNA hairpin loop exhibit a regular A-form double helix with little or no distortion at the G·U wobble pair in the stem region (Fig. 6A). Salient features of the loop structure include reversal of the phosphodiester backbone (Fig. 6B) at the U11–C12 step, a non-planar three-way interaction involving A13, C10 and A14 (Fig. 6C) and 3′ stacking interactions. Base–base stacking and specific hydrogen bonds observed in the loop region contribute to stability of the loop structure.
The putative C·A mismatch observed in all refined structures is defined by a single hydrogen bond between C10 N3 and A14 NH6. C10 O2 is also within hydrogen bonding distance of A13 NH6. At the stem–loop junction, the C10·A14 mismatch remains stacked above the closing G9–C15 base pair. Base U11 is located in the major groove and does not participate in any loop-specific hydrogen bonding. Rather, it points into the solution and remains in a slightly destacked conformation. The backbone changes direction at the U11–C12 step and this turn is reflected in unusual backbone torsion angles, which are accompanied by a C2′-endo conformation of the sugar of residue U11 (Table 5). Residues C12, A13 and A14 stack on top of each other and above C15 on the 3′ partition of the loop. The 3′ base stacking pattern is consistent with the stacking preference observed in several RNA loop structures (32–35).
The 5′-region of the loop is rigid while the 3′-region is more flexible, and the two regions are separated by C12. The sugar protons of residue C12 are located directly above the A13 base and this orientation is clearly supported by their upfield shifts in the NMR spectra, arising due to the shielding effect induced by base ring current (Table 2). NMR data suggests that A13 and A14 show a conformational equilibrium between C2′- and C3′-endo sugar puckering. In the final 10 structures A13 and A14 both adopt an increased C3′-endo conformation. The C3′-endo character of residues C10 and A14, which form a mismatch pair, preserves the A-form geometry at the stem–loop junction.
The A13·C10·A14 three-way interaction
The three-way non-planar A13·C10·A14 interaction is defined by two non-canonical hydrogen bonds (Fig. 6C). If the A·C·A interaction is viewed as two separate mismatch pairs, C10–A14 and C10–A13, their geometries are similar to those previously observed in anticodon loops of Thermus thermophilus tRNALys (36) and yeast tRNAPhe (12), respectively. The phosphate–phosphate distance observed in both mismatch pairs is shorter than the corresponding distance in the canonical Watson–Crick base pairs. The C10 2′-O is also within hydrogen bonding distance of C12 NH4. Since C12 is the least conserved among the five nucleotides, it is highly likely that this is a fortuitous interaction, caused primarily by the closeness of the two residues. The structural geometry of the three-way interaction is in excellent agreement with the phylogenetic conservation (Table 1) of the participating nucleotides. Moreover, there is no isosteric interaction that can potentially replace the proposed interaction (37). Nevertheless, the reader should appreciate that this three-way interaction has been inferred. Direct proof will require isotopic labeling.
Similarities and differences between the NMR and crystal structures of the pentaloop
The crystal structure of the 30S subunit of T.thermophilus was solved at 3.0 and 3.3 Å resolution by two groups (8,9). The X-ray coordinates deposited by these authors facilitated direct comparison between the NMR structure and their X-ray counterparts. The similarities between the NMR and crystal structures include the location and solvent accessibility of the second U11 residue and stabilization of the loop structure provided by the 3′ stacking interactions. Differences include the geometry of the C·A mismatch and the backbone torsion angle values.
The crystal structure solved at 3.0 Å resolution indicates that C10 and A14 form a reverse Hoogsteen mismatch (8). A similar mismatch is observed between C10 and A13 in the 3.3 Å resolution crystal structure (9). In both crystal structures, all loop residues adopt the C3′-endo conformation and the backbone torsion angles are modeled to have canonical A-form values. In contrast to the crystal structures, we have evidence of a C·A mismatch connected via a single hydrogen bond between C10 N3 and A14 NH6. C10 O2 is also within hydrogen bonding distance of A13 NH6. The geometry of this three-way base–base interaction is strongly supported by the presence of weak interactions between H2 of A13 and A14 and H1′ of C10 in the 2D NOESY spectra (Fig. 4). In our structure the backbone torsion angles, especially at the UC step, deviate from the A-form values (Table 5). The NMR structure, however, does resemble the analogous region in the crystal structure of the 30S subunit solved at 3.3 Å resolution (9). In this crystal structure the second loop residue (U) interacts with Arg131 and the third residue (C) interacts with Ser137 of ribosomal protein S4. The two consecutive adenosines in the 3′-half of the loop interact with helix 4 via the shallow minor groove. The location and orientation of the loop nucleotides in the NMR structure agree well with the 3.3 Å crystal structure (RMSD for positions 9–15, 2.34 Å). Differences between the NMR and crystal structures are not unexpected in view of the presence of nearby RNA and protein components in the ribosome. Significant differences were also observed when the NMR solution structure of E.coli loop A and the analogous loop in the crystal structure of the entire 50S ribosomal subunit were compared (38).
The pentaloop and U-turn motif
The U-turn is a common structural motif observed in several RNA structures and is primarily involved in tertiary interactions (39). Salient features of the U-turn motif include reversal of the phosphodiester backbone, following the pivotal U, and two specific cross-loop hydrogen bonds. The first hydrogen bond forms between the imino proton of the pivotal U and the non-bridging oxygen of the backbone phosphate of residue R at the n + 2 position. The second hydrogen bond forms between the 2′-OH of U and the N7 of residue R at the n + 2 position. The change in direction of the backbone following the pivotal U results in solvent accessibility of the Watson–Crick edges of the 3′-neighbor of U.
A schematic overview comparing the CUCAA loop and a U-turn observed in the analog of the initiator anticodon stem–loop (40) is presented in Figure 7. Although the CUCAA loop satisfies a canonical U-turn sequence consensus, none of the characteristic U-turn interactions are observed in the NMR structure. In the CUCAA loop structure the change in backbone direction is brought about at the UC step, where the torsion angles adopt non-A-form values. This turn is stabilized by the minor groove orientation of C12 and a specific hydrogen bond between C12 NH4 and C10 O2′. The CUCAA loop also lacks a stacking phosphate commonly observed in loops exhibiting U-turn folding (39). Predictions of a U-turn motif also failed in the case of the UGAA tetraloop, where, despite the presence of a U-turn consensus sequence, the loop had a novel fold (29). Thus, the consensus sequence is not always sufficient to reliably predict the presence of a U-turn motif.
Figure 7.

Illustration of the backbone features of the CUCAA loop and the anticodon loop analog of initiator tRNA. (A) Schematic illustration of the consensus U-turn loop. A break in the backbone of the U-turn loop indicates length variation of the loop. The U to n + 2 hydrogen bonds are depicted. (B) Schematic illustration of the CUCAA pentaloop. The closed rectangles represent the base–base stacking interactions. The dotted lines indicate hydrogen bonding between specific functional groups. The curved arrows indicate reversal of the backbone. The symbols used to denote functional groups are pentagon (sugar), open circles (phosphates), open rectangles (bases) and lines (backbone) and squiggles (backbone extensions). (C) Ribbon tracing of the tRNA anticodon (left) and CUCAA hairpin (right) loops. The characteristic chain reversal in the loop backbone of the two molecules is indicated by red arrows next to the phosphate and the black arrows indicate the chain direction.
GNRA motifs have conformational features isosteric to those of a U-turn (41). Interestingly, although the CUCAA loop does not exhibit a U-turn, its structural features are quite similar to GNRA tetraloops (42). The loop structure is asymmetrical, with C10 forming a 5′ stack, U11 exposed to solvent in a destacked conformation and the remaining CAA forming a 3′ stack. The first and last loop nucleotides form a putative mismatch pair and remain stacked above the closing base pair. The second loop base is located in the major groove and its conformation excludes it from participating in any loop-specific hydrogen bonds. However, its orientation makes it available for interactions with other RNA loops or ribosomal proteins. It is evident from these studies that non-canonical interactions, a sharp turn in the backbone associated with synergistic changes in torsion angles, and 3′ stacking interactions primarily contribute to stabilizing the terminal loops (2).
Biological significance of pentaloop structure
In the recently published crystal structure of the 50S ribosomal subunit (43) two or more consecutive adenosines located in terminal and internal loops frequently participate in tertiary interactions by docking with the minor grooves of receptor helices (44). In fact, ∼50% of the internal and terminal loop structures seen in 16S rRNA secondary structures have two consecutive adenosines (45). In the CUCAA loop structure A13 and A14 are well stacked and expose their reactive functional groups in the minor groove. This feature of the loop facilitates minor groove-mediated tertiary interactions with other RNA helices in the 16S rRNA molecule. Similar minor groove interactions involving adenosines are also observed in the P4–P6 domain of the group I intron (46). Thus, this appears likely to be a general RNA design principle governing long-range interactions. The 3′ stacking interactions with adenosine bases located in the minor groove, observed in the majority of stable RNA loops, might be a key factor in docking terminal loops into corresponding receptor helices (47). Finally, it should be noted that in the context of the entire ribosome the 16S rRNA analog of U11, which is located in the major groove, acts as a recognition element, interacting with specific amino acids of the S4 ribosomal protein, and the consecutive adenosines stacked on the 3′-end of the loop dock into helix 4, stabilized by minor groove-mediated associations.
SUPPLEMENTARY MATERIAL
Supplementary Material is available at NAR Online.
Acknowledgments
ACKNOWLEDGEMENTS
The 600 MHz NMR spectrometer at the University of Houston is funded by the W. M. Keck Foundation. Acknowledgment is made to the Institute of Molecular Design and the W. M. Keck Center for computer resource support. This research was supported by grants from NASA (NAG5-8140) and the Robert A. Welch Foundation (E-1451) to G.E.F and by NIH grant (GM49957) to X.G.
PDB accession no. 1K5I
REFERENCES
- 1.Uhlenbeck O.C. (1990) Tetraloops and RNA folding. Nature, 346, 613–614. [DOI] [PubMed] [Google Scholar]
- 2.Shen L.X., Cai,Z. and Tinoco,I.,Jr (1995) RNA structure at high resolution. FASEB J., 9, 1023–1033. [DOI] [PubMed] [Google Scholar]
- 3.Nagaswamy U., Voss,N., Zhang,Z. and Fox,G.E. (2000) Database of non-canonical base pairs found in known RNA structures. Nucleic Acids Res., 28, 375–376. [DOI] [PMC free article] [PubMed] [Google Scholar]
- 4.Fourmy D., Recht,M.I. and Puglisi,J.D. (1998) Binding of neomycin-class aminoglycoside antibiotics to the A-site of 16 S rRNA. J. Mol. Biol., 277, 347–362. [DOI] [PubMed] [Google Scholar]
- 5.Jiang F., Gorin,A., Hu,W., Majumdar,A., Baskerville,S., Xu,W., Ellington,A. and Patel,D.J. (1999) Anchoring an extended HTLV-1 Rex peptide within an RNA major groove containing junctional base triples. Struct. Fold Des., 7, 1461–1472. [DOI] [PubMed] [Google Scholar]
- 6.Jiang L., Majumdar,A., Hu,W., Jaishree,T.J., Xu,W. and Patel,D.J. (1999) Saccharide-RNA recognition in a complex formed between neomycin B and an RNA aptamer. Struct. Fold Des., 7, 817–827. [DOI] [PubMed] [Google Scholar]
- 7.Gutell R.R. (1993) Collection of small subunit (16S and 16S-like) ribosomal RNA structures. Nucleic Acids Res., 21, 3051–3054. [DOI] [PMC free article] [PubMed] [Google Scholar]
- 8.Wimberly B.T., Brodersen,D.E., Clemons,W.M.,Jr, Morgan-Warren,R.J., Carter,A.P., Vonrhein,C., Hartsch,T. and Ramakrishnan,V. (2000) Structure of the 30S ribosomal subunit. Nature, 407, 327–339. [DOI] [PubMed] [Google Scholar]
- 9.Schluenzen F., Tocilj,A., Zarivach,R., Harms,J., Gluehmann,M., Janell,D., Bashan,A., Bartels,H., Agmon,I., Franceschi,F. et al. (2000) Structure of functionally activated small ribosomal subunit at 3.3 Å resolution. Cell, 102, 615–623. [DOI] [PubMed] [Google Scholar]
- 10.Gutell R.R. (1996) Comparative sequence analysis and the structure of 16S and 23S rRNA. In Dahlberg,A.E. and Zimmermann,R.A. (eds), Ribosomal RNA:Structure, Evolution, Processing and Function in Protein Biosynthesis. CRC Press, Boca Raton, FL, pp. 111–128. [Google Scholar]
- 11.Gutell R.R., Cannone,J.J., Konings,D. and Gautheret,D. (2000) Predicting U-turns in ribosomal RNA with comparative sequence analysis. J. Mol. Biol., 300, 791–803. [DOI] [PubMed] [Google Scholar]
- 12.Quigley G.J. and Rich,A. (1976) Structural domains of transfer RNA molecules. Science, 194, 796–806. [DOI] [PubMed] [Google Scholar]
- 13.Stallings S.C. and Moore,P.B. (1997) The structure of an essential splicing element: stem loop IIa from yeast U2 snRNA. Structure, 5, 1173–1185. [DOI] [PubMed] [Google Scholar]
- 14.Varani G., Cheong,C. and Tinoco,I. (1991) Structure of an unusually stable RNA hairpin. Biochemistry, 30, 3280–3289. [DOI] [PubMed] [Google Scholar]
- 15.Fountain M.A., Serra,M.J., Krugh,T.R. and Turner,D.H. (1996) Structural features of a six-nucleotide RNA hairpin loop found in ribosomal RNA. Biochemistry, 35, 6539–6548. [DOI] [PubMed] [Google Scholar]
- 16.Milligan J.F. and Uhlenbeck,O.C. (1989) Synthesis of small RNAs using T7 RNA polymerase. Methods Enzymol., 180, 51–62. [DOI] [PubMed] [Google Scholar]
- 17.Wincott F., DiRenzo,A., Shaffer,C., Grimm,S., Tracz,D., Workman,C., Sweedler,D., Gonzalez,C., Scaringe,S. and Usman,N. (1995) Synthesis, deprotection, analysis and purification of RNA and ribozymes. Nucleic Acids Res., 23, 2677–2684. [DOI] [PMC free article] [PubMed] [Google Scholar]
- 18.Petersheim M. and Turner,D.H. (1983) Base-stacking and base-pairing contributions to helix stability: thermodynamics of double-helix formation with CCGG, CCGGp, CCGGAp, ACCGGp, CCGGUp and ACCGGUp. Biochemistry, 22, 256–263. [DOI] [PubMed] [Google Scholar]
- 19.Plateau P. and Gueron,M. (1982) Exchangeable proton NMR without base-line distorsion, using new strong-pulse sequences. J. Am. Chem. Soc., 104, 7310–7311. [Google Scholar]
- 20.Marion D. and Wuthrich,K. (1983) Application of phase sensitive two-dimensional correlated spectroscopy (COSY) for measurements of 1H-1H spin-spin coupling constants in proteins. Biochem. Biophys. Res. Commun., 113, 967–974. [DOI] [PubMed] [Google Scholar]
- 21.Yang X., Sanghvi,Y.S. and Gao,X. (1997) Conformational studies of antisense DNA by PFG NMR. J. Biomol. NMR, 10, 383–388. [DOI] [PubMed] [Google Scholar]
- 22.Stejskal E.O. and Tanner,J.E. (1965) Spin diffusion measurements: spin echoes in the presence of a time-dependent field gradient. J. Chem. Phys., 42, 288–292. [Google Scholar]
- 23.Gibbs S.J. and Jahnson,C.S.,Jr (1991) A PFG NMR experiment for accurate diffusion and flow studies in the presence of eddy currents. J. Magn. Reson., 93, 395–402. [Google Scholar]
- 24.Lapham J., Rife,J.P., Moore,P.B. and Crothers,D.M. (1997) Measurement of diffusion constants for nucleic acids by NMR. J. Biomol. NMR, 10, 255–262. [DOI] [PubMed] [Google Scholar]
- 25.Sklenar V., Miyashiro,H., Zon,G., Miles,H.T. and Bax,A. (1986) Assignment of the 31P and 1H resonances in oligonucleotides by two-dimensional NMR spectroscopy. FEBS Lett., 208, 94–98. [DOI] [PubMed] [Google Scholar]
- 26.Cross C.W., Rice,J.S. and Gao,X. (1997) Solution structure of an RNA × DNA hybrid duplex containing a 3′-thioformacetal linker and an RNA A-tract. Biochemistry, 36, 4096–4107. [DOI] [PubMed] [Google Scholar]
- 27.Brunger A.T. (1992) X-PLOR Manual Version 3.0. Yale University, New Haven, CT.
- 28.Jucker F.M. and Pardi,A. (1995) Solution structure of the CUUG hairpin loop: a novel RNA tetraloop motif. Biochemistry, 34, 14416–14427. [DOI] [PubMed] [Google Scholar]
- 29.Butcher S.E., Dieckmann,T. and Feigon,J. (1997) Solution structure of the conserved 16 S-like ribosomal RNA UGAA tetraloop. J. Mol. Biol., 268, 348–358. [DOI] [PubMed] [Google Scholar]
- 30.Wuthrich K. (1986) NMR of Proteins and Nucleic Acids. John Wiley & Sons, New York, NY.
- 31.Durant P.C. and Davis,D.R. (1999) Stabilization of the anticodon stem-loop of tRNALys,3 by an A+-C base-pair and by pseudouridine. J. Mol. Biol., 285, 115–131. [DOI] [PubMed] [Google Scholar]
- 32.Haasnoot C.A., Hilbers,C.W., van der Marel,G.A., van Boom,J.H., Singh,U.C., Pattabiraman,N. and Kollman,P.A. (1986) On loop folding in nucleic acid hairpin-type structures. J. Biomol. Struct. Dyn., 3, 843–857. [DOI] [PubMed] [Google Scholar]
- 33.Michnicka M.J., Harper,J.W. and King,G.C. (1993) Selective isotopic enrichment of synthetic RNA: application to the HIV-1 TAR element. Biochemistry, 32, 395–400. [DOI] [PubMed] [Google Scholar]
- 34.Jaeger J.A. and Tinoco,I.,Jr (1993) An NMR study of the HIV-1 TAR element hairpin. Biochemistry, 32, 12522–12530. [DOI] [PubMed] [Google Scholar]
- 35.Puglisi J.D., Wyatt,J.R. and Tinoco,I.,Jr (1990) Solution conformation of an RNA hairpin loop. Biochemistry, 29, 4215–4226. [DOI] [PubMed] [Google Scholar]
- 36.Cusack S., Yaremchuk,A. and Tukalo,M. (1996) The crystal structures of T.thermophilus lysyl-tRNA synthetase complexed with E.coli tRNA(Lys) and a T.thermophilus tRNA(Lys) transcript: anticodon recognition and conformational changes upon binding of a lysyl-adenylate analogue. EMBO J., 15, 6321–6334. [PMC free article] [PubMed] [Google Scholar]
- 37.Leontis N.B. and Westhof,E. (1998) Conserved geometrical base-pairing patterns in RNA. Q. Rev. Biophys., 31, 399–455. [DOI] [PubMed] [Google Scholar]
- 38.Blanchard S.C. and Puglisi,J.D. (2001) Solution structure of the A loop of 23S ribosomal RNA. Proc. Natl Acad. Sci. USA, 98, 3720–3725. [DOI] [PMC free article] [PubMed] [Google Scholar]
- 39.Moore P.B. (1999) Structural motifs in RNA. Annu. Rev. Biochem., 68, 287–300. [DOI] [PubMed] [Google Scholar]
- 40.Schweisguth D.C. and Moore,P.B. (1997) On the conformation of the anticodon loops of initiator and elongator methionine tRNAs. J. Mol. Biol., 267, 505–519. [DOI] [PubMed] [Google Scholar]
- 41.Jucker F.M. and Pardi,A. (1995) GNRA tetraloops make a U-turn. RNA, 1, 219–222. [PMC free article] [PubMed] [Google Scholar]
- 42.Heus H.A. and Pardi,A. (1991) Structural features that give rise to the unusual stability of RNA hairpins containing GNRA loops. Science, 253, 191–194. [DOI] [PubMed] [Google Scholar]
- 43.Ban N., Nissen,P., Hansen,J., Moore,P.B. and Steitz,T.A. (2000) The complete atomic structure of the large ribosomal subunit at 2.4 Å resolution. Science, 289, 905–920. [DOI] [PubMed] [Google Scholar]
- 44.Nissen P., Ippolito,J.A., Ban,N., Moore,P.B. and Steitz,T.A. (2001) RNA tertiary interactions in the large ribosomal subunit: the A-minor motif. Proc. Natl Acad. Sci. USA, 98, 4899–4903. [DOI] [PMC free article] [PubMed] [Google Scholar]
- 45.Gutell R.R., Cannone,J.J., Konings,D. and Gautheret,D. (2000) A story: unpaired adenosine bases in ribosomal RNAs. J. Mol. Biol., 304, 335–354. [DOI] [PubMed] [Google Scholar]
- 46.Doherty E.A., Batey,R.T., Masquida,B. and Doudna,J.A. (2001) A universal mode of helix packing in RNA. Nature Struct. Biol., 8, 339–343. [DOI] [PubMed] [Google Scholar]
- 47.Butcher S.E., Dieckmann,T. and Feigon,J. (1997) Solution structure of a GAAA tetraloop receptor RNA. EMBO J., 16, 7490–7499. [DOI] [PMC free article] [PubMed] [Google Scholar]
Associated Data
This section collects any data citations, data availability statements, or supplementary materials included in this article.