

Abstract
Thyroid hormone (T3) is essential for normal development, differentiation and metabolic balance. Only a limited number of T3-target genes have been identified so far and their complex regulation pattern is poorly understood. We performed cDNA expression array hybridisation to identify T3-regulated genes and to investigate their expression pattern after various time points in vivo. Radioactively labelled cDNA was prepared from hepatic RNA of hypothyroid and hyperthyroid rats 6, 24 and 48 h after the administration of T3. Labelled cDNA probes were hybridised to rat Atlas Arrays. Twenty-three of 588 genes were shown to be differentially regulated, 18 of which were previously not known to be regulated by T3. The expression of 19 genes was verified by independent northern blot hybridisation. Two different expression time courses of T3 expression were observed. In a first expression profile (‘early’ expression) the transcription level of the target genes rises within 6 h, drops by 24 h and increases again within 48 h after the administration of T3. In a second expression profile (‘late’ expression) the mRNA level rose in the first 6 h and rose further by 48 h, indicating an additional regulation mechanism. Nuclear respiratory factor (NRF)-1 and peroxisome proliferator-activated receptor gamma coactivator 1 (PGC-1), but not NRF-2, were up-regulated within 6 h after T3 adminstration, suggesting NRF-1 and/or PGC-1 as key regulators for mediating the ‘late’ expression pattern.
INTRODUCTION
Thyroid hormone (T3) has a profound influence on normal development, differentiation and metabolism (1,2). Genomic or nuclear effects of T3 are mediated by T3 receptors (TRs), ligand-regulated transcription factors. The TR belongs to a superfamily of nuclear receptors including the receptors for steroid hormone, retinoic acid, vitamin D, fatty acid, as well as many ‘orphan receptors’ with no identified ligands (3). The function of TR as a transcription factor is to regulate target gene expression directly through DNA response elements. TRs modulate gene activity through alternately silencing or activating transcription by recruitment of either co-repressor or co-activator complexes depending on the absence or presence of T3 (4,5).
After a single injection of T3 to hypothyroid rats, the metabolic rate remains unaffected for the first 20–30 h. After that period, the metabolic rate increases and reaches maximum levels between 48 and 72 h (6). This delayed response is surprising as the non-genomic effects of T3 are already detectable within minutes (7) and the genomic effects of T3 are typically detectable within hours (8). For many of the latter genes, functional T3 responsive elements (TREs) have been reported (9–12), indicating a direct mechanism via the binding of TR. However, some target genes are expressed ‘late’ (24–48 h) after the administration of T3 in vivo, including cytochrome c (13) and adenine nucleotide translocator 2 (14). Furthermore, no direct interaction of TR with these target genes has been observed. These observations suggest an indirect induction mechanism via the activation of an intermediate factor(s). Candidate proteins have been identified which probably serve as intermediate factors, e.g. the nuclear respiratory factors-1 and -2 (NRF-1 and NRF-2) (15) or the nuclear receptor co-activator PGC-1, which has been shown to interact with NRF-1 (16,17). Binding sites for NRF-1 and/or NRF-2 were detected in target genes (e.g. cytochrome c, cytochrome oxidase subunit IV, mitochondrial transcription factor A), which are known to be regulated by T3 at the transcriptional level, but no functional TRE has been identified in these genes so far (15). Moreover, these target genes are known to be regulated >12 h after the administration of T3 in vivo (8,13,18). This finding strengthens the argument for an indirect T3-activating mechanism via an intermediate factor(s) as this factor(s) needs to be synthesised before it can act. However, to date it is unclear if this candidate factor(s) is directly regulated by T3.
Recently, Feng et al. (19) reported the detection of differentially regulated hepatic genes, after the administration of T3 to hypothyroid mice, using DNA microarrays. DNA micro- and macroarrays are powerful tools to analyse differential gene expression (19–24). However, little is known about the time course of the T3 activation, the complex expression patterns and the underlying mechanisms. To clarify differences in the time courses of the differentially T3-regulated genes, we performed cDNA expression array hybridisations. We analysed the expression profiles in the liver of rats at four distinct time points before and at various time points after the administration of T3. Twenty-three of 588 genes were shown to be differentially regulated. Most of these genes had not previously been reported as regulated by T3. Nineteen of these differentially regulated genes were analysed in more detail and were distinguishable by their expression profiles. NRF-1 and PGC-1, but not NRF-2, were shown to be regulated by T3 within 6 h. This study is the first application of cDNA expression array technology to investigate the time course of hormonal regulation of target genes in vivo.
MATERIALS AND METHODS
Animals and treatments
Adult male Wistar rats (Charles River Wiga) were housed under controlled conditions (22°C, constant humidity, 12:12 h dark:light cycle); food and water were provided ad libitum. Rats were maintained in the animal care facility of the University Hospital Hamburg-Eppendorf according to the UKE animal care guidelines. Hypothyroidism was induced by i.p. injection of Na131I (Amersham Pharmacia) (250 µCi/100 g body weight) 28 days before the experiments. Hyperthyroidism was provoked by i.p. injection of T3 (50 µg/100 g body weight; Henning) which was repeated after 24 h. Hypothyroidism and hyperthyroidism were verified by measurements of serum T3, T4 and thyroid stimulating hormone (TSH) levels (hypothyroidism: T3 <0.4 µg/l; hyperthyroidism: T3 >6.5 µg/l). At 0, 6, 24 and 48 h after T3 injection, rats were killed by decapitation and the livers were isolated for RNA preparation.
RNA isolation
Total RNA was prepared from rat livers using RNA-Clean (Hybaid AGS), treated with DNase I (Clontech) (50 U, 30 min, 37°C) and further purified by Oligotex particles (Qiagen) following the manufacturer’s instructions.
cDNA expression arrays
Atlas rat cDNA expression arrays were purchased from Clontech (Heidelberg). These arrays consist of 588 rat cDNA fragments, organised into broad functional groups. A complete list of the genes included on the membranes is available on the Clontech web site (www.clontech.com). All cDNAs used for printing on the array have been sequence verified by the company. One microgram of poly(A)+ RNA (combined from identical amounts of RNA from three different animals) was reverse transcribed in the presence of [α-32P]dATP (3000 Ci/mmol; Amersham Pharmacia) using SuperScript II reverse transcriptase (200 U, 25 min, 50°C) (Life Technologies). The labelled probes were purified by spin-column centrifugation (Nucleo Spin, Clontech) and met or exceeded the manufacturer’s recommendation for specific activity. Array membranes were hybridised in ExpressHyb solution overnight at 68°C, washed four times (30 min with 2× SSC/1% SDS) and once with 0.1× SSC/0.5% SDS for 30 min at 68°C. The array membranes were exposed for varying periods of time to Kodak XAR autoradiographic film. All procedures for labelling and purifying the probes, hybridisation and washing of the membranes were according to the supplier’s recommendations.
Array exposures were normalised by equalising the intensity of the signals from a set of ‘housekeeping’ genes provided on the array. Following this normalisation step, the hybridisation signals of a particular gene were compared between the 0, 6, 24 and 48 h exposures.
Northern blotting
For northern blots, 10 µg of total RNA [either combined from identical amounts of three animals (see Fig. 2) or from a single individual animal (see Fig. 3)] were separated on 1% agarose/formaldehyde gels and transferred to Biodyne A transfer membranes (Pall) by vacuum blotting with a VacuGene XL apparatus (Pharmacia). After transfer, RNA was fixed by UV cross-linking, hybridised with [α-32P]dCTP-labelled cDNA probes and washed under high stringency conditions as described previously (14). The wash conditions were as follows: two times 15 min with 2× SSC/0.1% SDS at room temperature and 20 min at 65°C with 0.1× SSC/0.1% SDS. Membranes were exposed to Kodak XAR autoradiographic film and quantified by densitometric scanning. Fold increases were determined from hyperthyroid rat signal values (6, 24 and 48 h) divided by hypothyroid rat signal values within the same experiment ± SEM. Statistical analysis was performed using Student’s t-test. For hybridisation, cDNA probes of particular genes (200–300 bp in length) were generated by RT–PCR amplification, using primers designed to the sequences described in Table 1. The amplification products were gel-purified, ligated into pGEM T-easy (Promega) and verified by sequencing.
Figure 2.
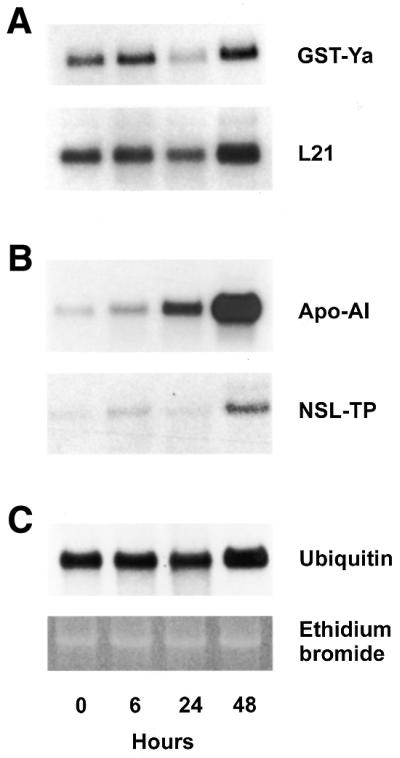
Northern blot analysis of total RNA from the liver of hypothyroid and hyperthyroid rats. Liver total RNA (10 µg), combined from three hypothyroid (0 h) and three hyperthyroid rats (6, 24 and 48 h after the administration of T3) per time point, was denatured and electrophoresed in formaldehyde-containing 1% agarose gels, blotted to nylon membranes and probed with the indicated cDNA probes (A) GST-Ya and ribosomal protein L21, (B) Apo-AI and NSL-TP and (C) ubiquitin. Also shown is a gel after staining with ethidium bromide.
Figure 3.

Northern blot analysis of total RNA from the livers of three individual hypothyroid and hyperthyroid rats per time point. Liver total RNA (10 µg), from three individual hypothyroid (0 h) and three hyperthyroid rats (6, 24 and 48 h after the administration of T3) per time point, was denatured and electrophoresed in formaldehyde-containing 1% agarose gels, blotted to nylon membranes and probed with the indicated cDNA probes (A) GST-Ya and ribosomal protein L21, (B) Apo-AI and NSL-TP and (C) ubiquitin. Also shown is a gel after staining with ethidium bromide.
Table 1. Evaluation of differentially regulated genes in hyperthyroid rats.

Differentially regulated genes were ordered into broad functional classes. Gene names and GenBank accession numbers are given. Fold increase data from three independent northern blot experiment (nos 1–19) or quantitative real-time PCR experiment (nos 20–23) are indicated. The values were calculated by comparing the 6, 24 and 48 h hyperthyroid signal intensities to the hypothyroid signal intensities (0 h) within the same experiment. Significant values, estimated by Student’s t-test, are given by asterisks (*P < 0.05; **P < 0.01; ***P < 0.001).
Quantitative PCR
For quantitative ‘real time’ RT–PCR, 1 µg total liver RNA (combined from identical amounts of RNA from three different animals) were mixed with 1 µg random hexamer primers and 1 µg oligo dT primers and reverse transcribed using 200 U SuperScript II reverse transcriptase (Life Technologies) according to the supplier’s recommendations. For PCR reactions, a 1.5 µl portion of the cDNA was mixed with each 300 nM primers and 3 mM MgCl2 using the LC-DNA Master SYBR Green Kit in a LightCycler (Roche) according the manufacturer’s instructions. PCR reactions were carried out in duplicates or triplicates with the following PCR primers: NRF-1 forward, 5′-aaattgggccacattacaggg-3′; NRF-1 reverse, 5′-gttgcatctcctgagaagcg-3′; NRF-2 β1 forward, 5′-ccttagctgaagcttctgcc-3′; NRF-2 β1 reverse, 5′-caatacttgctgtccatcgg-3′; ubiquitin forward, 5′-ggcggtttgttccttcatc-3′; ubiquitin reverse, 5′-cgggaatgcagactgaaga-3′; β-actin forward, 5′-acctctatgccaacacagtgc-3′; β-actin reverse, 5′-ctcatcgtactcctgcttgc-3′; S29 forward, 5′-tctgatccgtaaatacgggc-3′; S29 reverse, 5′-ctgtgtgcgcaaagactagc-3′; PGC-1 forward, 5′-cgcagagagtatgagaagcg-3′; PGC-1 reverse, 5′-aagcgtcacaggtgtaacgg-3′. Crossing points of target gene amplification products were normalised to the crossing points of ubiquitin or S29 amplification products. Fold increase of expression levels were determined from hyperthyroid rat signal values divided by hypothyroid rat signal values within the same experiment of at least three independent experiments ± SEM.
RESULTS
cDNA expression array analyses
The aim of this study was to identify novel T3-induced genes and to investigate their expression patterns using cDNA expression array analysis on 588 different genes (Atlas Array, Clontech). We induced hypothyroidism in male Wistar rats by injection with Na131I 28 days before the experiment was started and induced hyperthyroidism by injection of T3 6, 24 and 48 h before the animals were decapitated and the livers were prepared. Hypothyroidism and hyperthyroidism were verified by measurement of serum T3, T4 and TSH levels (data not shown). Poly(A)+ RNA from the liver of three animals per time point was prepared and used for cDNA expression array hybridisation [Fig. 1, 0 (hypo), 6 (hyper), 24 (hyper) and 48 h (hyper)]. The signal strengths were normalised to the signal intensities of the ‘housekeeping’ genes polyubiquitin (Fig. 1, no. 19) and 40S ribosomal protein S29 according to the supplier’s instructions. To minimise an animal-specific expression pattern, we combined equal amounts of RNA from three different animals and analysed six independent hybridisation signals from three different arrays per time point.
Figure 1.
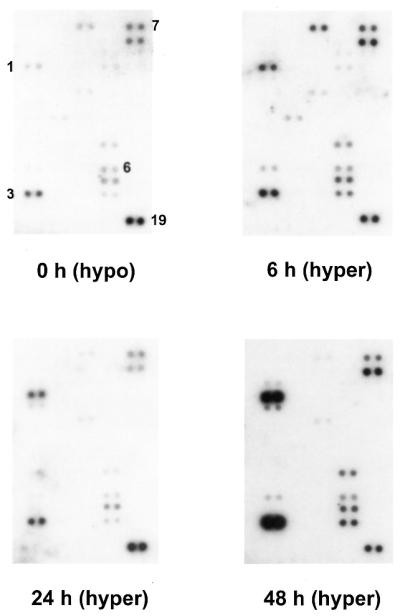
Representative cDNA expression array analyses. The cDNA hybridisation pattern from hypothyroid rats (0 h, hypo) and hyperthyroid rats 6 (6 h, hyper), 24 (24 h, hyper) and 48 h (48 h, hyper) after the administration of T3 in vivo are shown. Hepatic RNA probes from three animals per time point were combined, radioactively labelled and probed on Atlas Arrays. The signal strengths were normalised to the hybridisation signal of ubiquitin (no. 19). Numbers indicate the positions of differentially expressed genes: 1, Apo-AI; 3, liver fatty acid binding protein; 6, 60S ribosomal protein L21; 7, 40S ribosomal protein S12. Numbers are identical to those in Table 1.
Figure 1 shows a representative expression profile from a small portion of the cDNA expression array hybridisation. These arrays consist of 588 rat cDNA fragments, which were selected by the company and are not enriched in ‘classical’ T3-target genes. Twenty-three of 588 genes (3.9%) were shown to be reproducibly differentially regulated and 19 were selected for further characterisation (see Table 1, nos 1–19).
Northern blot analyses
To confirm a positive microarray expression signal, we performed northern blot hybridisation of 17 differentially expressed genes (plus two ‘housekeeping’ genes), which were identified by cDNA expression array analysis. In the first approach, we combined equal amounts of RNA from three different rats per time point. Identical amounts of total RNA (10 µg/lane) were loaded and verified by staining with ethidium bromide (Fig. 2C) and additionally by hybridisation with the ‘housekeeping’ genes polyubiquitin (Fig. 2C), β-actin or Gsα as described previously (14,18, data not shown). The hybridisation probes were generated by PCR amplification, verified by sequencing (see accession numbers in Table 1) and are not necessarily identical to the portion of the cDNA that was printed on the array. All hybridisation signals were of the expected length in nucleotides. With one exception (Table 1, no. 8, casein kinase II beta subunit) we were able to reproduce the cDNA expression array data by independent northern analysis. Figure 2A and B shows representative northern blot analyses of glutathione S-transferase Ya subunit (GST-Ya), 60S ribosomal protein L21, apolipoprotein AI (Apo-AI) and non-specific lipid transfer protein (NSL-TP).
We observed at least two different time courses of T3-mediated gene expression. In the first expression profile, the RNA levels of the regulated genes rise within 6 h after T3-injection and drop to or even drop below hypothyroid levels. The RNA levels are again regulated within 48 h after the first injection. GST and L21 are examples exhibiting such an expression pattern (Fig. 2A). It should be noted that the first increase in mRNA concentration is low (1.3-fold for L21) whereas the second increase is more pronounced (2.6-fold for L21). A second expression profile is shown in Figure 2B. Here, the RNA levels remain almost unaffected 6 h after injection, increase slightly within 24 h and reach maximal levels 48 h after T3 injection. Apo-AI and NSL-TP are examples showing such an expression profile (Fig. 2B). Maximal transcriptional regulation was observed for Apo-AI, which shows a 10.5-fold increase after 48 h. The most striking differences between the two expression profiles were observed 24 h after T3 administration. Whereas ‘early’ induced genes drop, the ‘late’ induced genes remain at higher expression levels.
The expression profiles were confirmed in a second series of northern blot analyses. In this approach we separated identical amounts of RNA from three individual animals per time point. The blots were again hybridised as indicated above. As shown in Figure 3, the expression level can differ, depending on the individual animal used for the analysis.
However, we were able to confirm the hybridisation signals of the northern analyses of the combined probes (Fig. 2) and thus verified the cDNA expression array hybridisation signals (Fig. 1).
The complete expression profiles of differentially T3-regulated genes are summarised in Table 1. The hyperthyroid expression levels 6, 24 and 48 h after T3 injection were normalised to hypothyroid expression levels (0 h) within the same experiments of a least three independent northern hybridisations. Significant values, estimated by Student’s t-test, are given by asterisks (*P < 0.05; **P < 0.01; ***P < 0.001).
Intermediate candidate factors NRF-1, NRF-2 and PGC-1
To improve the hypothesis if NRF-1, NRF-2 or PGC-1 may serve as an intermediate factor for T3 action, we analysed the expression levels of these proteins. As the expression levels were too low for suitable northern blot analyses in rat liver (16,25, data not shown), we performed quantitative ‘real time’ RT–PCR. The expression levels were again normalised to the expression levels of ubiquitin and S29, as described above. As shown in Figure 4A, NRF-1 expression levels were increased 2-fold 6 h after the administration of T3 and remains high for further 18 h. As shown in Figure 4C, PGC-1 expression levels were dramatically (13-fold) increased 6 h after administration and remains high for a further 42 h. In contrast, NRF-2 expression levels were almost unaffected within the first 24 h and were decreased to 0.5-fold after 48 h (Fig. 4B). The complete expression profiles are summarised in Table 1 (nos 21–23). NRF-1 and/or PGC-1, but not NRF-2, may therefore serve as an intermediate factor, as NRF-1 and PGC-1 are up-regulated ‘early’.
Figure 4.


Determination of NRF-1, NRF-2 and PGC-1 expression levels by quantitative PCR in rat liver. Liver total RNA, combined from three hypothyroid (0 h) and three hyperthyroid rats (6, 24 and 48 h after the administration of T3) per time point, were reverse transcribed. Expression levels of NRF-1 (A), NRF-2 (B) and PGC-1 (C) were analysed by quantitative PCR. Data are mean ± SEM of three independent real time PCR experiments and are normalised to the ubiquitin expression levels.
DISCUSSION
As T3 plays a profound role in metabolic control, we expected to identify many differentially regulated genes that play a central role in metabolic pathways. Indeed, we found a number of genes that are known to be involved in lipid/steroid metabolism and transport (Table 1, nos 1–5). Two of these proteins were already known to be regulated by T3. For Apo-AI, the major protein component of the serum high-density lipoprotein (HDL) particles, it was demonstrated that T3 responsiveness is regulated by a TRE (26). For liver fatty acid binding protein (L-FABP) it was shown that the binding activity of the protein is increased in hyperthyroidism (27). These results convinced us that our cDNA expression array screening was successful. An example of a gene that was previously not known to be regulated by T3 is that for NSL-TP (also known as sterol carrier protein 2, SCP2). NSL-TP is prominent in peroxisomes and plays a key role in peroxisomal β-oxidation of fatty acids (28), a process stimulated by T3. Furthermore, all these proteins are expressed ‘late’ by T3, indicating a common regulatory mechanism.
Surprisingly, the majority of the differentially regulated genes (78%) were not primarily involved in metabolic functions. Rather, these genes are associated with a wide variety of cellular functions; such as translation and protein turnover, they also encode apoptosis-associated proteins. Among the proteins investigated in this study, only the proteins α-1-antitrypsin (29), Cu-Zn-containing superoxide dismutase 1 (30) and GST (31) were formally known as regulated by T3.
Almost all investigated genes are positively regulated by T3, in contrast to a recent finding of T3-mediated gene expression in mice. Yen and co-workers (19) have demonstrated that within 2225 mouse genes the majority of 41 T3-regulated genes are negatively regulated, whereas the minority of 14 genes were positively regulated within 6 h after T3 administration. This finding is surprising but might reflect differences in the investigated species (mouse versus rat) or in the investigated expression time points after the administration of T3 (≤6 versus ≥6 h). Furthermore, the T3 concentration used for injection is surprisingly high (100 mg/100 g body weight) compared with the concentration that we used in our study (50 µg/100 g body weight). As it has recently been demonstrated that mouse cDNA clones, which were used for the printing of microarrays, are of questionable quality, candidate target genes should be confirmed by sequencing (32).
Interestingly, we detected a number of ribosomal proteins, which are regulated by T3. The ribosomal proteins L21 and S12 were investigated in further detail (Table 1, nos 6 and 7) and were shown to be differentially expressed within 6 h after the administration of T3, they are further inducible within 48 h. These observations raise a question concerning the viability of northern blot normalisation of T3 expression profiles with the ‘housekeeping’ gene ribosomal protein S29, as suggested by the suppliers of the arrays. As shown by northern blot analysis, S29 has a similar expression pattern to L21 and S12 and we therefore excluded S29 as a normalisation standard. Very similar expression profiles were observed for ribosomal proteins L19, L44, S11 and S17 on cDNA expression array analyses (data not shown), suggesting an unidentified common regulation process for ribosomal proteins. This observation may be connected with the well-known effects of T3 regulation on protein synthesis (33,34).
Among the newly identified T3-regulated genes, we observed an expression of MAP kinase kinase 2 (MAPKK 2) which phosphorylates the target protein MAP kinase, a key enzyme of the ERK MAP kinase signalling pathway. Interestingly, recent data show that T3 induces phosphorylation and the nuclear translocation of MAP kinase, which is not associated with transcriptional regulation of MAPK (35). In line with these observations, we were unable to detect a transcriptional regulation of MAP kinase in our cDNA expression array analyses (data not shown). However the ERK MAP kinase pathway seems to be regulated by at least two mechanisms: first via the post-translational regulation of MAPK and secondly via a transcriptional regulation of its upstream inducer MAPKK 2.
Calcium binding protein 2 (CaBP2), previously not known to be a T3 target, was identified as being regulated by T3 (see Table 1). CaBP2, a member of a family of calcium binding proteins that shows sequence similarity to calmodulin (36), serves as a stress response protein. CaBP2 is able to catalyse the renaturation of denatured proteins by the formation of disulfide bonds and protein disulfide isomerisation and is involved in the folding of nascent proteins (37).
Similar functions are probably performed by additional proteins that were identified in our study. We observed clusterin as an ‘early’ T3-induced protein, this accumulates in surviving cells adjacent to areas undergoing apoptosis (38). Clusterin has been shown to have potent chaperone-like activities and protects a wide variety of proteins from heat- or mercaptoethanol-induced denaturation. Of note, GST was identified as a preferential binding partner of clusterin (39). This observation provides a direct, functional link between two proteins independently identified in our study.
It is interesting to compare the T3-dependent gene expression pattern in rat with the T3-dependent gene expression pattern of amphibian metamorphosis. Metamorphosis in Xenopus laevis is characterised by a non-functional thyroid gland in embryos, which is converted into a functional thyroid gland during larval development. Serum T3 levels are detectable shortly after the formation of a functional thyroid gland and this triggers the initiation of metamorphosis (40,41). This scenario of X.laevis metamorphosis is very similar to the physiological situation in our study, where we introduced T3 to hypothyroid rats. Using a subtractive hybridisation approach Shi and co-workers identified T3-responsive genes that are differentially regulated during metamorphosis, and investigated the kinetics of their expression (42). They found at least three expression profiles: (i) mRNA levels rise by 4–12 h and remains high for a week; (ii) mRNA levels rise by 4 h, drop by 8–12 h and then increase again and (iii) mRNA levels rise by 4 h, drop by 8–24 h and then increase again (42). It is noteworthy that the expression profiles in Xenopus are very similar to the profiles that we have found in the rat, indicating an evolutionary conserved principle of T3 action.
Furthermore, we suggest NRF-1, and/or PGC-1, to be an intermediate factor of T3 action, as NRF-1 and PGC-1 are up-regulated already 6 h after T3 treatment (Fig. 4A and C). Interestingly, many T3-target genes seem not to contain a TRE but contain functional characterised NRF-1 binding sites (e.g. cytochrome c, cytochrome oxidase subunit Vb, mitochondrial transcription factor A; 15). Recently, it has been reported that interruption of the NRF-1 gene in mice leads to embryonic lethality associated with a markedly reduced level of mitochondria, indicating an essential function of NRF-1 in mitochondria biogenesis (43). PGC-1 has been shown to be a potent co-activator of many nuclear receptors and NRF-1 (16,17). Moreover, some of the effects of PGC-1 resemble those of T3 (e.g. activation of mitochondrial biogenesis, metabolic rate or adaptive thermogenesis), and two recent reports emphasised the significance for gluconeogenesis in liver (44,45). In contrast NRF-2 (also known as GA-binding protein, GABP) seems not to be such an intermediate factor as the expression levels remain almost unaffected within the first 24 h. After 48 h the mRNA levels drop (Fig. 4B), which may be connected to the down regulation of NRF-2 in response to oxidative stress (46,47).
In summary, using cDNA expression arrays we have determined that the T3-dependent expression pattern in rats is characterised by at least two expression profiles. We have also identified 18 novel T3-target genes that are involved in multiple cellular processes, as candidate genes with which to investigate T3 action at the molecular level. Regulation of the transcription factor NRF-1, probably synergistically in conjunction with its co-activator PGC-1, may, at least in part, be involved in mediating the ‘late’ expression pattern. Knockout strategies should provide an approach to address these questions.
However, our initial supposition that a direct activation via TR binding to a functional TRE is responsible for the ‘early’ expression, whereas the ‘late’ expression is initiated by an intermediate factor(s) which itself is/are regulated by T3 appears to be too simple, as Apo-AI (induced rather ‘late’) is regulated via a TRE. If one takes into account that several T3-mediated pre- and post-transcriptional variations additionally trigger T3 activation, the induction mechanisms appear even more complicated.
We have demonstrated the complex expression patterns of T3 in vivo and established the powerful technique of cDNA expression arrays for these investigations in living animals, which should be a great step forward in our goal to understand the complex patterns of T3 action in vivo.
Acknowledgments
ACKNOWLEDGEMENTS
We are indebted to Britta Schwarzloh for help with the LightCycler, Mark Darlison for critical reading the manuscript and to colleagues from our laboratory for helpful discussions. This work was supported by the Hamburgische Wissenschaftliche Stiftung.
REFERENCES
- 1.Lazar M.A. (1993) Thyroid hormone receptors: multiple forms, multiple possibilities. Endocrinol. Rev., 14, 184–193. [DOI] [PubMed] [Google Scholar]
- 2.Oppenheimer J.H. (1985) Thyroid hormone action at nuclear level. Annu. Intern. Med., 102, 374–384. [DOI] [PubMed] [Google Scholar]
- 3.Mangelsdorf D.J., Thummel,C., Beato,M., Herrlich,P., Schütz,G., Umesono,K., Blumberg,B., Kastner,P., Mark,M., Chambon,P. and Evans,R.M. (1995) The nuclear receptor superfamily: the second decade. Cell, 83, 835–839. [DOI] [PMC free article] [PubMed] [Google Scholar]
- 4.Zhang J. and Lazar,M.A. (2000) The mechanism of action of thyroid hormones. Annu. Rev. Physiol., 62, 439–466. [DOI] [PubMed] [Google Scholar]
- 5.Collingwood T.N., Urnov,F.D. and Wolffe,A.P. (1999) Nuclear receptors: coactivators, corepressors and chromatin remodeling in the control of transcription. J. Mol. Endocrinol., 23, 255–275. [DOI] [PubMed] [Google Scholar]
- 6.Tata J.R., Ernster,L., Lindberg,O., Arrhenius,E., Pedersen,S. and Hedman,R. (1963) The action of thyroid hormones at the cell level. Biochem. J., 86, 408–428. [DOI] [PMC free article] [PubMed] [Google Scholar]
- 7.Davis P.J. and Davis,F.B. (1996) Nongenomic actions of thyroid hormone. Thyroid, 6, 497–504. [DOI] [PubMed] [Google Scholar]
- 8.Pillar T.M. and Seitz,H.J. (1997) Thyroid hormone and gene expression in the regulation of mitochondrial respiratory function. Eur. J. Endocrinol., 136, 231–239. [DOI] [PubMed] [Google Scholar]
- 9.Zilz N.D., Murray,M.B. and Towle,H.C. (1990) Identification of multiple thyroid hormone response elements located far upstream from the rat S14 promoter. J. Biol. Chem., 265, 8136–8143. [PubMed] [Google Scholar]
- 10.Norman M.F., Lavin,T.N., Baxter,J.D. and West,B.L. (1989) The rat growth hormone gene contains multiple thyroid response elements. J. Biol. Chem., 264, 12063–12073. [PubMed] [Google Scholar]
- 11.Petty K.J., Desvergne,B., Mitsuhashi,T. and Nikodem,V.M. (1990) Identification of a thyroid hormone response element in the malic enzyme gene. J. Biol. Chem., 265, 7395–7400. [PubMed] [Google Scholar]
- 12.Weitzel J.M., Kutz,S., Radtke,C., Grott,S. and Seitz,H.J. (2001) Hormonal regulation of multiple promoters of the rat mitochondrial glycerol-3-phosphate dehydrogenase gene: identification of a complex hormone-response element in the ubiquitous promoter B. Eur. J. Biochem., 268, 4095–4103. [DOI] [PubMed] [Google Scholar]
- 13.Scarpulla R.C., Kilar,M.C. and Scarpulla,K.M. (1986) Coordinate induction of multiple cytochrome c mRNAs in response to thyroid hormone. J. Biol. Chem., 261, 4660–4662. [PubMed] [Google Scholar]
- 14.Dümmler K., Müller,S. and Seitz,H.J. (1996) Regulation of adenine nucleotide translocase and glycerol-3-phophate dehydrogenase expression by thyroid hormones in different rat tissues. Biochem. J., 317, 913–918. [DOI] [PMC free article] [PubMed] [Google Scholar]
- 15.Scarpulla R.C. (1996) Nuclear respiratory factors and the pathways of nuclear-mitochondrial interaction. Trends Cardiovasc. Med., 6, 39–45. [DOI] [PubMed] [Google Scholar]
- 16.Puigserver P., Wu,Z., Park,C.W., Graves,R., Wright,M. and Spiegelman,B.M. (1998) A cold-inducible coactivator of nuclear receptors linked to adaptive thermogenesis. Cell, 92, 829–839. [DOI] [PubMed] [Google Scholar]
- 17.Wu Z., Puigserver,P., Andersson,U., Zhang,C., Adelmant,G., Mootha,V., Troy,A., Cinti,S., Lowell,B., Scarpulla,R.C. and Spiegelman,B.M. (1999) Mechanisms controlling mitochondrial biogenesis and respiration through the thermogenic coactivator PGC-1. Cell, 98, 115–124. [DOI] [PubMed] [Google Scholar]
- 18.Luciakova K. and Nelson,B.D. (1992) Transcript levels for nuclear-encoded mammalian mitochondrial respiratory-chain components are regulated by thyroid hormone in an uncoordinated fashion. Eur. J. Biochem., 207, 247–251. [DOI] [PubMed] [Google Scholar]
- 19.Feng X., Jiang,Y., Meltzer,P. and Yen,P.M. (2000) Thyroid hormone regulation of hepatic genes in vivo detected by complementary DNA microarray. Mol. Endocrinol., 14, 947–955. [DOI] [PubMed] [Google Scholar]
- 20.Duggan D.J., Bittner,M., Chen,Y., Meltzer,P. and Trent,J.M. (1999) Expression profiling using cDNA microarrays. Nature Genet., 21 (suppl.), 10–14. [DOI] [PubMed] [Google Scholar]
- 21.Cheung V.G., Morley,M., Aguilar,F., Massimi,A., Kucherlapati,R. and Childs,G. (1999) Making and reading microarrays. Nature Genet., 21 (suppl.), 15–19. [DOI] [PubMed] [Google Scholar]
- 22.Golub T.R., Slonim,D.K., Tamayo,P., Huard,C., Gaasenbeek,M., Mesirov,J.P., Coller,H., Loh,M.L., Downing,J.R., Caligiuri,M.A., Bloomfield,C.D. and Lander,E.S. (1999) Molecular classification of cancer: class discovery and class prediction by gene expression monitoring. Science, 286, 531–537. [DOI] [PubMed] [Google Scholar]
- 23.Iyer V.R., Eisen,M.B., Ross,D.T., Schuler,G., Moore,T., Lee,J.C.F., Trent,J.M., Staudt,L.M., Hudson,J.Jr, Boguski,M.S., Lashkari,D., Shalon,D., Botstein,D. and Brown,P.O. (1999) The transcriptional program in the response of human fibroblasts to serum. Science, 283, 83–87. [DOI] [PubMed] [Google Scholar]
- 24.Wellmann A., Thieblemont,C., Pittaluga,S., Sakai,A., Jaffe,E.S., Siebert,P. and Raffeld,M. (2000) Detection of differentially expressed genes in lymphomas using cDNA arrays: detection of clusterin as a new diagnostic marker for anaplastic large-cell lymphomas. Blood, 96, 398–404. [PubMed] [Google Scholar]
- 25.Gopalakrishnan L. and Scarpulla,R.C. (1995) Structure, expression and chromosomal assignment of the human gene encoding nuclear respiratory factor 1. J. Biol. Chem., 270, 18019–18025. [DOI] [PubMed] [Google Scholar]
- 26.Taylor A.H., Wishart,P., Lawless,D.E., Raymond,J. and Wong,N.C. (1996) Identification of functional positive and negative thyroid hormone-responsive elements in the rat apolipoprotein AI promoter. Biochemistry, 35, 8281–8288. [DOI] [PubMed] [Google Scholar]
- 27.Nakagawa S., Kawashima,Y., Hirose,A. and Kozuka,H. (1994) Regulation of hepatic level of fatty-acid-binding protein by hormones and clofibric acid in the rat. Biochem. J., 297, 581–584. [DOI] [PMC free article] [PubMed] [Google Scholar]
- 28.Wirtz K.W.A. (1997) Phospholipid transfer proteins revisited. Biochem. J., 324, 353–360. [DOI] [PMC free article] [PubMed] [Google Scholar]
- 29.Schwarzenberg S.J., Sharp,H.L., Berry,S.A., Manthei,R.D. and Seelig,S. (1987) Hormonal regulation of serum alpha-1-antitrypsin and hepatic alpha-1-antitrypsin mRNA in rats. Biochem. Biophys. Res. Commun., 147, 936–941. [DOI] [PubMed] [Google Scholar]
- 30.Mano T., Sinohara,R., Sawai,Y., Oda,N., Nishida,Y., Mokumo,T., Asano,K., Ito,Y., Kotake,M., Hamada,M., Nakai,A. and Nagasaka,A. (1995) Changes in lipid peroxidation and free radical scavengers in the brain of hyper- and hypothyroid aged rats. J. Endocrinol., 147, 361–365. [DOI] [PubMed] [Google Scholar]
- 31.Williams M.T., Carrington,H. and Herrera,A. (1986) Stimulation of mouse liver glutathione S-transferase activity in propylthiouracil-treated mice in vivo by tri-iodothyronine. Biochem. J., 233, 595–598. [DOI] [PMC free article] [PubMed] [Google Scholar]
- 32.Halgren R.G., Fielden,M.R., Fong,C.J. and Zacharewski,T.R. (2001) Assessment of clone identity and sequence fidelity for 1189 IMAGE cDNA clones. Nucleic Acids Res., 29, 582–588. [DOI] [PMC free article] [PubMed] [Google Scholar]
- 33.Carter W.J., Faas,F.H. and Wynn,J. (1975) Demonstration of thyroxine-stimulated incorporation of amino acid into peptide linkage in mitochondria-free system. J. Biol. Chem., 250, 3588–3594. [PubMed] [Google Scholar]
- 34.Mathews R.W., Oronsky,A. and Haschemeyer,A.E. (1973) Effect of thyroid hormone on polypeptide chain assembly kinetics in liver protein synthesis in vivo. J. Biol. Chem., 248, 1329–1333. [PubMed] [Google Scholar]
- 35.Lin H.Y., Davis,F.B., Gordinier,J.K., Martino,L.J. and Davis,P.J. (1999) Thyroid hormone induces activation of mitogen-activated protein kinase in cultured cells. Am. J. Physiol., 276, 1014–1024. [DOI] [PubMed] [Google Scholar]
- 36.Haeseleer F., Sokal,I., Verlinde,C.L., Erdjument-Bromage,H., Tempst,P., Pronin,A.N., Benovic,J.L., Fariss,R.N. and Palczewski,K. (2000) Five members of a novel Ca(2+)-binding protein (CABP) subfamily with similarity to calmodulin. J. Biol. Chem., 275, 1247–1260. [DOI] [PMC free article] [PubMed] [Google Scholar]
- 37.Rupp K., Birnbach,U., Lundstrom,J., Van,P.N. and Soling,H.D. (1994) Effects of CaBP2, the rat analog of Erp72 and of CaBP1 on the refolding of denatured reduced proteins. Comparison with protein disulfide isomerase. J. Biol. Chem., 269, 2501–2507. [PubMed] [Google Scholar]
- 38.French L.E., Wohlwend,A., Sappino,A.P., Tschopp,J. and Schifferli,J.A. (1994) Human clusterin gene expression is confined to surviving cells during in vitro programmed cell death. J. Clin. Invest., 93, 877–884. [DOI] [PMC free article] [PubMed] [Google Scholar]
- 39.Humphreys D.T., Carver,J.A., Easterbrook-Smith,S.B. and Wilson,M.R. (1999) Clusterin has chaperone-like activity similar to that of small heat shock proteins. J. Biol. Chem., 274, 6875–6881. [DOI] [PubMed] [Google Scholar]
- 40.Shi Y.B., Wong,J., Puzianowska-Kuznicka,M. and Stolow,M.A. (1996) Tadpole competence and tissue-specific temporal regulation of amphibian metamorphosis: roles of thyroid hormone and its receptors. Bioessays, 18, 391–399. [DOI] [PubMed] [Google Scholar]
- 41.Berry D.L., Schwartzman,R.A. and Brown,D.D. (1998) The expression pattern of thyroid hormone response genes in the tadpole tail identifies multiple resorption programs. Dev. Biol., 203, 12–23. [DOI] [PubMed] [Google Scholar]
- 42.Denver R.J., Pavgi,S. and Shi,Y.B. (1997) Thyroid hormone-dependent gene expression program for Xenopus neural development. J. Biol. Chem., 272, 8179–8188. [DOI] [PubMed] [Google Scholar]
- 43.Huo L. and Scarpulla,R.C. (2001) Mitochondrial DNA instability and peri-implantation lethality associated with target disruption of nuclear respiratory factor 1 in mice. Mol. Cell. Biol., 21, 644–654. [DOI] [PMC free article] [PubMed] [Google Scholar]
- 44.Herzig S., Long,F., Jhala,U.S., Hedrick,S., Quinn,R., Bauer,A., Rudolph,D., Schutz,G., Yoon,C., Puigserver,P., Spiegelman,B. and Montminy,M. (2001) CREB regulates hepatic gluconeogenesis through the coactivator PGC-1. Nature, 413, 179–183. [DOI] [PubMed] [Google Scholar]
- 45.Yoon J.C., Puigserver,P., Chen,G., Donovan,J., Wu,Z., Rhee,J., Adelmant,G., Stafford,J., Kahn,C.R., Granner,D.K., Newgard,C.B. and Spiegelman,B.M. (2001) Control of hepatic gluconeogenesis through the transcriptional coactivator PGC-1. Nature, 413, 131–138. [DOI] [PubMed] [Google Scholar]
- 46.Martin M.E., Chinenov,Y., Yu,M., Schmidt,T.K. and Yang,X.Y. (1996) Redox regulation of GA-binding protein-α DNA binding activity. J. Biol. Chem., 271, 25617–25623. [DOI] [PubMed] [Google Scholar]
- 47.Chinenov Y., Schmidt,T., Yang,X.Y. and Martin,M.E. (1998) Identification of redox-sensitive cysteines in GA-binding protein-α that regulate DNA binding and heterodimerization. J. Biol. Chem., 273, 6203–6209. [DOI] [PubMed] [Google Scholar]