

Abstract
COVID-19 was announced by the World Health Organization as a pandemic on March 11, 2020. Not only has COVID-19 struck the economy and public health, but it also has deep influences on people's feelings. Twitter, as an active social media, is a great database where we can investigate people's sentiments during this pandemic. By conducting sentiment analysis on Tweets using advanced machine learning techniques, this study aims to investigate how public sentiments respond to the pandemic from March 2 to May 21, 2020 in New York City, Los Angeles, London, and another six global mega-cities. Results showed that across cities, negative and positive Tweet sentiment clustered around mid-March and early May, respectively. Furthermore, positive sentiments of Tweets from New York City and London were positively correlated with stricter quarantine measures, although this correlation was not significant in Los Angeles. Meanwhile, Tweet sentiments of all three cities did not exhibit a strong correlation with new cases and hospitalization. Last but not least, we provide a qualitative analysis of the reasons behind differences in correlations shown above, along with a discussion of the polarizing effect of public policies on Tweet sentiments. Thus, the results of this study imply that Tweet sentiment is more sensitive to quarantine orders than reported statistics of COVID-19, especially in populous megacities where public transportation is heavily relied upon, which calls for prompt and effective quarantine measures during contagious disease outbreaks.
Keywords: COVID-19, Tweet sentiments, Machine learning, Megacities, Quarantine policy measures
1. Introduction
Since its outbreak in late 2019, the Novel Coronavirus Diseases (COVID-19) has spread quickly to all continents of the world and taken hundreds of thousands of lives away. By the end of July 2020, there have been over 15 million confirmed cases, including more than 600,000 deaths reported to the World Health Organization globally (WHO COVID-19 Dashboard, 2020). In March, the world has witnessed the exponential growth in the number of coronavirus affected patients—within 11 days from March 20 to March 31, the confirmed COVID-19 cases increased more than 211% to 858, 361 (Dubey, 2020). The rapid spread of the pandemic has led to the lockdown of more than 100 countries by the end of March, affecting billions of people around the globe (Coronavirus: The World in lockdown, 2020). The impact of COVID-19 and quarantine policies on the global economy, public health, public transit, and many other areas is profound. For instance, International Monetary Fund projected that over 170 countries are expected to experience negative per capita income growth in 2020 in anticipation of the worst economic fallout since the Great Depression (“Coronavirus: Worst economic crisis”, 2020). Moreover, legislative activities and local political elections were also adjourned in the US and UK (“Coronavirus: English local elections”, 2020).
Besides economic and political implications, it is also worth examining how COVID-19 and quarantine measures triggered the swing of public sentiments. Thus, we conducted this study amid COVID-19, aiming to help scientists, policymakers, and other stakeholders to better understand the emotional impact of the COVID-19 (-like) pandemic across cities, and to further evaluate in a concrete and quantitative way on how the threat of infectious disease, economic paralysis, political intervention, and scientific effectiveness should be dealt with in a rapidly changing world. Since Twitter is one of the major social platforms where people self-document and share emotions about their daily lives (Bogers & Bjorneborn, 2013; Liu et al., 2010; Miller et al., 2019), it was selected as the main source of data for this study. This study has three major contributions: (a) We investigated public sentiment during COVID-19 using Twitter data analyzed with advanced machine learning methods, which allowed a large-scale analysis of an ongoing pandemic; (b) We combined sentiment analysis with Spearman's rank correlation, which helped offer insights into the reasons behind sentiment changes; (c) This study provided a comparative analysis across cities and time during the pandemic, which was more concentrated and in-depth than at the national level.
This study was constructed as following steps. First, we tested on different machine learning models, including Naïve Bayes, Logistic Regression, Convolutional Neural Network (CNN), and Long Short-Term Memory (LSTM), and tried different text representation such as bag-of-words and pre-trained word vectors. Secondly, we applied the optimal LSTM model on the collected Tweets and analyzed the sentiment change of different cities across time. Finally, we used Spearman's rank correlation to investigate the relationship between Tweet sentiment, quarantine measures, and COVID-19 statistics such as new case emerges, hospitalization, and deaths in three cities—New York City, Los Angeles, and London, where we collected sufficient and quality Tweets to drive the machine learning based sentiment analysis. Since Tweet sentiments and the spread of the pandemic may vary by city, a comparative study across cities could allow researchers to incorporate city-specific features, such as the demographic distribution, economic indexes, and accessibility of public transportation, to dig deeper into the reasons behind the possible correlations found. Also, as pandemic quarantine measures could have huge impacts on the daily life of residents, such policies are often issued on a city, or even district level. Thus, a city-by-city comparison could help policymakers better distinguish the response of different residents and design more differentiated measures to prevent the spread of epidemics. The rest of the article was structured into the following sections. Section 2 (Literature review) reviews relevant research related to sentiment analysis and Twitter data usage. Section 3 (Method) introduces the methodology for Tweet collection, data preprocessing, machine learning classifiers for sentiment analysis, and the ranking rule for Spearman's correlation. Section 4 (Results) presents the data summary and correlation analysis. Section 5 (Discussion) explores how the results of this study could be interpreted considering the difference in population density and infrastructure across cities. Section 6 (Conclusion) outlines the contributions, limitations, and implications of this study.
2. Literature review
2.1. Technique of sentiment analysis
As one of the popular topics in Natural Language Processing, many different approaches to achieve sentiment analysis have been proposed. One algorithm is to consider sentiment analysis as a classification problem—determining a Tweet as positive, negative, or neutral/subjective or objective. Bertrand et al. (2013) implement the classifiers using the Natural Language Toolkit (NLTK), train feature sets with different labels, and generate sentiment measure by combining the output value of each feature set. Neppalli et al. (2017) use Naive Bayes and Support Vector Machine as the two supervised machine-learning classifiers and use a combination of bag-of-words and sentiment features as input to the model. Gandhe et al. (2018) propose a hybrid approach that combines supervised and unsupervised learning in the sentence-level sentiment analysis model. This method takes partially labeled training data as input and allows researchers to classify unlabeled data based on lexical methods. The other type of sentiment analysis algorithm is list-based instead of classifier-based. The sentiment value of words in the annotated wordlist is predefined, and the initial seed of annotated sentiment words is grown by techniques like clustering. Nielsen (2011) has developed such a list by manually examining Tweets with high sentiment values and adding the antonyms/synonyms of such sentiment lexicon to the list. This sentiment-word list has 2477 unique emotional words (mathematically ranging from +5 to −5). It is worth noted that Nielsen's matching approach performs better than the more comprehensive list, Affective Norms for English Words (ANEW), developed by Bradley and Lang (1999).
2.2. Twitter for sentiment analysis
Tweets shows wide applicability in urban social-spatial research (Hu et al., 2020), especially with the boosts of big data techniques. Bollen et al. (2011) use the sentiment analysis of Tweets via a syntactic, term-based approach to demonstrate the correlation between significant public mood fluctuations and social/political/economic events. Flores (2017) applies sentiment analysis on over 250,000 Tweets to examine the effect of Arizona's 2010 anti-immigrant law on public attitudes towards immigrants. Comparing with traditional survey methods like distributing online polls, an investigation of public sentiments using Twitter data could allow researchers to develop more dynamic responses based on large-scale real-time data, which is tremendously helpful during emergencies. For instance, Sakaki et al. (2010) have developed an event detection system that monitors Tweet sentiment fluctuations to identify urgent events like earthquakes and would send the estimated location information to warn users of possible dangers. Furthermore, since each Tweet is labeled with publish time, researchers could easily track the development of sentiment fluctuations across time. For example, Quercia et al. (2012) study the emotional health of various London census communities via residents' sentiments expressed in Tweets, and find out that monitoring Tweets can effectively track the well-being of local communities in an “unobtrusive” way, as Tweets are posted publicly and are relatively easy to collect. Last but not least, Twitter can provide researchers with unprecedented large amounts of sentimental textual data that cover a wide range of themes. Abraham et al. (2018) summarize that Twitter has 330 million monthly active users, over 500 million Tweets are posted each day, and that overall 1.3 billion accounts have been registered, all of which show that Twitter is a comprehensive data source of how people feel about almost any topic.
However, using Twitter data for sentiment analysis also proposes unique challenges. To begin with, the short length of Tweets, which has the restriction of 280 characters, as well as its function as an informal medium of communication, have brought difficulties to understanding the context of users' comments and the degree to which they fully present their ideas online (Giachanou et al., 2019). In particular, the task of automatic irony detection is hard to realize in text mining, especially given that Tweets contain limited background information (Pang & Lee, 2008). To study the effects irony has on determining sentiment polarity of Tweets, Maynard and Greenwood (2014) utilize the hashtags included in Tweets and find out that while detecting sarcasm in Tweets could help produce more accurate sentiment analysis of Tweets, such improvement is not sufficient. This result indicates that until a more effective way of detecting irony in Tweets is created, current studies on Tweet sentiment analysis have to bear with the lurking satire in Tweets. Moreover, as Tweets usually contain unconventional wording and emoji use, additional problems are presented to researchers (Pak & Paroubek, 2010). It is advised that emojis and hashtags should be included in the analysis to better improve sentiment classification accuracy (Davidov et al., 2010). Kontopoulos et al. (2013) further propose that to get a more accurate description of Tweet sentiments, topic-specific sentiment scores should be assigned for each Tweet text instead of assigning a sentiment score to the Tweet as a whole.
Twitter data has also been actively used to analyze the progress and public sentiment during huge pandemics. Chew and Eysenbach (2010) discuss the keywords of Tweets during the 2009-H1N1 outbreak and validate Twitter as a “real-time content, sentiment, and public attention trend-tracking tool”. They observe that the sharp increase of Tweets expressing frustrating sentiments coincides with huge H1N1 news events like the WHO's pandemic level 6 announcement, which indicates that people's perceived severity of pandemics might impact Twitter activities. Jain and Kumar (2015) use Twitter data to track levels of the Influenza-A pandemic in India, and further support that social media can help track disease in society. Monitoring use of relevant terms such as “swine flu” over time, they aim at gathering information from Tweets that could help reveal the development of Influenza-A and the public's attitude towards the pandemic. In addition to tracking pandemic development, Tweet sentiment analysis could also be applied to the prediction and early surveillance of epidemic outbreaks. Odlum and Yoon (2015) analyze Tweets mentioning Ebola at the early stage of the outbreak with natural langue processing techniques to examine the contents and sentiments of Tweets. They discover that the number of Tweets mentioning Ebola started to rise in Nigeria around one week before the first official announcement of probable Ebola cases, which proves the power of Tweets in capturing early signs of pandemics and monitoring its spread. Szomszor et al. (2010), though not directly performing sentiment analysis on Tweets, also affirms by analyzing keywords, hashtags, and emojis of Tweets that Twitter can provide indications of increased infection spreading “up to one week before conventional GP reported surveillance data”, and thus helping public health officials build an early warning system.
Besides public health, Twitter for sentiment analysis are utilized in many other fields as well, such as urban planning and management (Frias-Martinez et al., 2012; Wakamiya et al., 2011), risk prevention (MacEachren et al., 2011; Sakaki et al., 2010), and bioinformatics (Liu et al., 2016). The use of Tweets has helped researchers analyze a wide range of social and economic issues in a prompt and cost-efficient manner.
2.3. Public policy and its relationship with public sentiments
The wide coverage and enforcing power of public policies make them impactful in determining public sentiments. Using machine learning techniques to analyze Twitter data, Adams-Cohen (2020) investigates the causal impact of the Supreme Court's legalization of same-sex marriage on public attitudes towards gay rights. He finds out that public sentiments about same-sex marriage become more negative in states where the Supreme Court's ruling overturns state policy, which demonstrates that Supreme Court decisions could polarize public sentiments in the short run. Srivastava et al. (2018) also conclude after tracking Tweets related to the ‘Demonetization’ policies of the Indian government that whenever any change in such policies is issued, both positive and negative sentiments would rise. This result reaffirms that public policies could drive greater divergence of public sentiments.
Public opinions could also influence the design of public policies. A classic study conducted by Page and Shapiro (1983) examines public opinions and policy data of the U.S. from 1935 to 1979, and finds out that very often public opinions cause policies to change, and could influence policies more than policies affect opinions. Therefore, an analysis of public sentiment could provide valuable insights into how policies should be implemented. For instance, Chung and Zeng (2016) have collected Tweets related to U.S. immigration and border security policies, extracted the sentiment and emotion of Tweets, and helped policymakers build a “social-media-based public policy informatics” system that could identify key opinion leaders and community activists.
2.4. COVID-19 related sentiment analysis
There are a few studies dedicated to investigating Twitter sentiment fluctuation during the ongoing pandemic of COVID-19. Rajput et al. (2020) present a statistical analysis of the word frequency and sentiments of individual Twitter messages related to COVID-19 posted since January 2020. Including both Tweets posted by WHO and the general public, their study finds out that most of the Tweets show positive emotions, and only around 15% exhibit negative polarity. In contrast to this result, Medford et al. (2020) utilize high-volume Twitter data from January 14th to 28th, 2020 to investigate public sentiments for the COVID-19 outbreak, concluding that around 49.5% of all Tweets expressed fear and around 30% expressed surprise. They also find out that the number of negative Tweets increased as the cases of coronavirus surged. Some scholars have also conducted comparative studies of different countries' response to the COVID-19. For instance, Dubey (2020) collected Tweets related to coronavirus from March 11 to March 31, 2020 from over ten countries. He suggests that people in France, Switzerland, Netherland, and USA expressed greater distrust and anger compared to other countries such as Italy, Spain, and Belgium. Sentiment analysis can be further combined with topic modeling for a more detailed analysis. Xue et al. (2020) firstly use the National Research Council of Canada Word-Emotion Association Lexicon, which is a list of English words and their associations with emotions, to assign Tweet sentiment by counting the number of words belonging to each emotion category. Then, they apply the Latent Dirichlet Allocation to understand the popular bigrams and sentiments of Tweets. Nevertheless, most of the research around Tweet sentiment change during coronavirus follows statistical methods, or uses the NRC implementation, and not many studies have concentrated on city-level comparisons.
Currently, the sentiment analysis of Tweets related to COVID-19 has mainly focused on identifying specific emotions (e.g., angry, fear, anxiety, etc.) and top topics. However, not much study has dedicated to investigating the correlations between Tweet sentiment, public health policies and the on-going progress of COVID-19. Moreover, machine learning methods are not widely used for sentiment analysis in these studies. Our study combined the benefits of Twitter data and machine learning methods—being real-time and of large scale, and thus more accurate, and carried out a correlation study that gave researchers quantified insights into the specific factors that triggered Tweet sentiment changes. Furthermore, most of the existing studies focus on providing an overview of public sentiment change across the globe or concentrate on country-level investigation. Our study seeks to provide a city-level analysis that could be more helpful for local governments to implement policy interventions that take the context of each city into consideration.
3. Methodology
3.1. Study area and collection of Twitter data
This study used Twitter Standard streaming API to collect streaming Tweets posted from March 2 to May 21, 2020 (re-Tweets were excluded). In order to compare the sentiment change across time and continents, we selected nine megacities as the target of Tweet collection: Washington (US), Boston (US), New York City (US), Chicago (US), Los Angeles (US), Seattle (US), London (UK), Rome (Italy), and Singapore. Their corresponding geo-coordinates applied in this study were listed in Table S1, and their corresponding COVID-19 progress was mapped in Fig. 1 . These megacities were chosen for their various coronavirus breakout time, the growth rate of confirmed cases, population size, and geographic location. Around forty keywords that had a strong association with coronavirus, such as ‘COVID’, ‘cough’, ‘outbreak’, and ‘quarantine’ were used as filters to preserve only Tweets relevant to the topic. All the keywords used to filter Tweets were listed in Table S2.
Fig. 1.

Global COVID-19 Map (July 23, 2020) of sampled cities.
3.2. Data pre-processing
The training dataset contained in total 1,578,627 classified Tweets. Each was labeled either 0 for negative sentiment or 1 for positive sentiment. The dataset was a combination of the Sentiment140 dataset created by Go et al. (2009) at Stanford University, and Twitter Sentiment Corpus by Sanders (2011). There were 790,185 Tweets labeled positive, and 788,442 Tweets labeled negative. 75% percent of the dataset was used for training and the rest for validation. Further filtering of words and Tweet locations were conducted to ensure that every Tweet preserved was from the target region and contained at least one word from the compiled keyword list. Duplicate Tweets were also removed. To better prepare the corpus for sentiment analysis, duplicate letters that appeared more than twice in a word were converted so that the maximum frequency of letters was two in consecutive (e.g., funnnny ⇒ funny). Web links were replaced with “URL”; strings start with “@” were replaced with “USER_MENTION”; the “#” in hashtags were removed; emoticons were replaced with either “EMO_POS” or “EMO_NEG” depending on a prepared list that maps emoticons to positive/negative emotions (Ansari et al., 2019). Extra spaces and dots were also removed. Furthermore, we used WordNetLemmatizer in NLTK to get the root word. Thus, words in different forms would not be wrongly identified as different ones. All the sentences after data pre-processing were lowercase, with punctuations removed.
After data processing, 420,663 Tweets were preserved for the nine megacities. The distribution of Tweets, city population and analysis statistics are shown in Fig. 2 (also Table S3). New York City, Los Angeles, and London were the three top cities from which we collected the most Tweets, and thus would be the targets of the more in-depth analysis in this study. We expected to have fewer Tweets amount in other sampled cities for variables reasons. For example, since English is not the main language spoken in Rome, relatively few Tweets have been gathered there. In English-speaking cities, we observe that the number of total Tweets collected is related to the population size of each city. While the number of tweeters' size is hard to estimate, we expect that in more populous cities, the number of tweeters is also greater, and thus the random process of Tweet collection will gather more Tweets in those cities. This presumption has also been affirmed by Fig. 2. In the processed Tweets, on average, we observed more URLs per Tweet than Emoticons, and more positive Emoticons than negative Emoticons in the Tweets we collected. In total, we observed far less unique unigrams, which is the frequency of each word in the corpus, than unique bigrams, which is the frequency of a word pair (two consecutive words). This observation is reasonable since the number of unique word pairs should be greater or equal to unique words in the entire corpus. Nevertheless, since Tweets are relatively short, the number of unigrams and bigrams per Tweet were roughly the same.
Fig. 2.

Number of Tweets collected in each city.
3.3. Machine learning classifiers for sentiment analysis
This study applied binary classification of a given pre-processed Tweet's sentiment, where 0 meant negative sentiments and 1 represented positive emotions. Different machine learning models for sentiment analysis were experimented. To set a baseline, we assigned sentiment polarity by comparing the number of positive and negative words in the sentence. If the positive word count was equal to the negative word count, positive sentiment would be assigned to the sentence. The list of positive and negative words came from Sentiment Lexicon, which contained around 6800 sentiment words in total (Hu and Liu, 2004).
To achieve better accuracy than the baseline approach, we first tested the Naïve Bayes and Logistics Regression classifier with Bag-of-Words as the text representation. The Bag-of-Words model is commonly used in document classification, where the frequency of each word in the vocabulary list is used as the feature for training classifiers (McTear et al., 2016). In this study, we used only the top unigrams and bigrams to build the vocabulary such that only important features were kept. Among the 1,578,627 training Tweets, there are 266,850 unique words and 3,072,933 unique word pairs. We selected the top 150,000 unique words and 10,000 word pairs as the vocabulary (Ansari et al., 2019). Each term frequency was further scaled by inverse-term-frequency (idf) of the term such that more important words gained higher weights. The idf of a term t is defined as:
| (1) |
where, n d is the number of total documents (Tweets), and df(t) is the number of documents (Tweets) that term t appears.
Naive Bayes is a simple probabilistic classifier that can be used for classification tasks. By applying maximum likelihood estimates (MLE), the model would maximize the likelihood that the label y took on value 0 or 1 given each Tweet's feature vector x. The model can be expressed as the following:
| (2) |
where f i is the i-th feature of the total n features. For implementation, the study used the Laplace smoothed version of MultinomialNB from the sklearn.naive_bayes package of scikit-learn.
Logistics regression is commonly used in machine learning to predict the probability of a dependent variable as well. The logistics regression applied in this study had only one densely-connected layer where the input size was the vocabulary length and the output was of dimension one, namely, a binary value 1 or 0. ADAM, which is a gradient-based optimizer for stochastic objective functions, was chosen to speed up the training process (Kingma & Ba, 2015). Sigmoid activation was applied to the output of the layer so that the output could be interpreted as a probability with value between [0,1]. The Sigmoid function is defined as:
| (3) |
Since Naive Bayes and logistic regression had similar and dissatisfying performances, we modified the classifiers and our method for text representation following the steps taken by Ansari et al. (2019). We rebuilt our vocabulary by using the top 90,000 words in the training dataset, and as GloVe (Pennington et al., 2014) provided a list of pre-trained word vectors based on massive Twitter data, we let the corresponding rows of the embedding matrix seed from GloVe. The vector representation of each Tweet would be padded with 0 if it was shorter than the designated max length.
The Convolutional Neural Network (CNN) is one of the most popular deep learning networks used in image recognition. However, it is also used in natural language processing to perform sentence classification and sentiment analysis (Kim, 2014). The CNN model in this study was implemented using Keras with TensorFlow backend. The complete architecture of the network was shown in Fig. 3 (left figure). Due to the depth of the network and the huge number of parameters trained, dropout layers were added to avoid overfitting. ReLu activation was used to speed up learning as it would only deactivate parts of the neurons after linear transformation. Similar to logistic regression, the sigmoid activation was applied before producing the final output for binary prediction. The loss function applied here is the binary cross-entropy with the form:
| (4) |
where N is the total number of data samples, and y is the label of the data point. The goal of the training process was to find the best parameters that minimized loss by using ADAM as the optimizer.
Fig. 3.
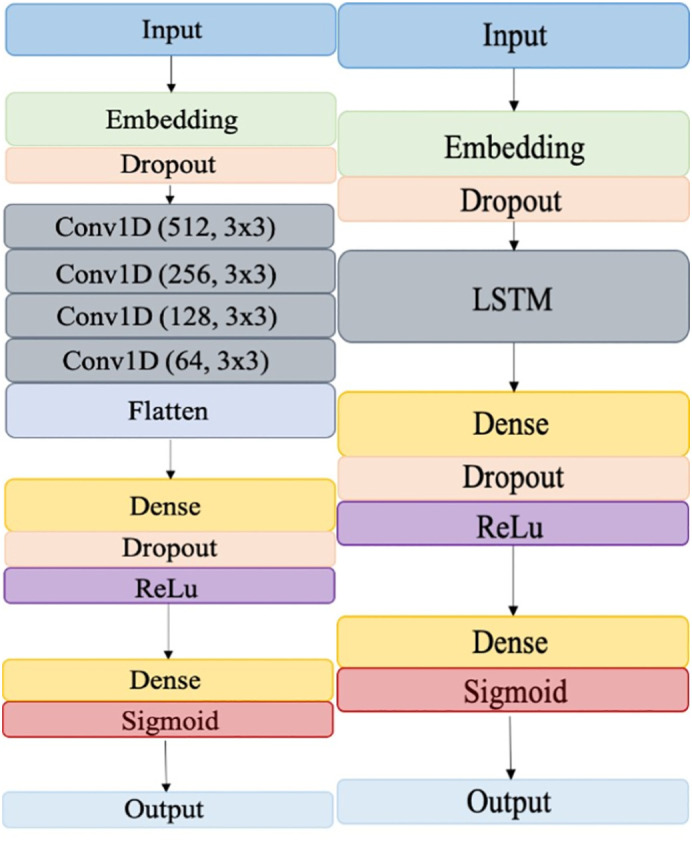
Architecture of CNN (left) and LSTM (right).
The long short-term memory (LSTM) network is a special type of recurrent neural network (RNN) that works well to learn long term dependencies (Hochreiter & Schmidhuber, 1997). Compared with traditional RNN, LSTM better copes with the issue of vanishing gradient and short-term memory. A classic LSTM has three gates: the forget gate, the input gate, and the output gate. These gates are responsible for deciding which information in the sequence is useful for making predictions and pass that information along to the next unit of the structure. In this study, the model was implemented using Keras with TensorFlow backend. The embedding layer was followed by an LSTM layer, then a fully connected layer with ReLu activation. Dropout regularization was also added to the embedding layer and dense layer to avoid overfitting. The complete architecture of the network is shown in Fig. 3(right figure). Comparing with the CNN structure on the left, the main differences between the two networks is the procedure between the first dropout layer and the first dense layer. CNN gradually reduces the dimension of input features to decrease the number of parameters to be trained and avoid overfitting, after which it reshapes the output into a flattened vector such that it can be fed into the dense layer. Since the Keras-based LSTM automatically deals with dimension deduction and generates flattened vectors, this process is omitted in the figure below.
3.4. Spearman's rank correlation
To better understand the quantitative relationship between Tweet sentiment and COVID-19 related events, such as quarantine measures, new cases, hospitalization, and deaths, we calculated the Spearman's rank correlation coefficient between each of the relationships. The Spearman's rank correlation measures the monotonicity of the relationship between two datasets and relaxes the assumptions of the Pearson correlation by allowing datasets not to be normally distributed. The correlation coefficient would have a value between −1 and +1. While 0 implies that there is no relationship between the two datasets, +1 indicates a positive correlation, and −1 indicates a negative correlation. We used the statistical functions in Python Scipy to calculate the spearman's rank correlation coefficient and its associated p-value. The null hypothesis was that the two sets of data were uncorrelated. If the p-value was very small (less than 0.05), it meant that the likelihood of observing the data to be uncorrelated was very small (at 95% confidence). The formula for calculating the Spearman's rank correlation coefficient is as follows:
| (5) |
where, and are the means of ranks x i and y i, respectively.
3.5. Ranking of sentiment score
Since Spearman's rank correlation required ranks of values instead of actual values, we assigned positive Tweets to higher ranks–the better the rank, the more positive the Tweets were on a particular day. We also ranked quarantine measures by firstly ordering them from the least strict to the most strict as the following: Stage 1- No measures or only warn the public gently; Stage 2- Suggest people to self-quarantine; Stage 3 - Limit mass gathering or shut down public places (restaurants, theatres, schools); Stage 4 – Execute partial quarantine or consider lifting the quarantine; Stage 5 – Lockdown completely/full quarantine, where nonessential workers must stay at home; Stage 6 - Extend quarantine orders or demand preparation for a longer quarantine. The higher the rank was, the later stage the city was at, and thus the stricter the quarantine measures were.
4. Results and discussion
4.1. Sentiments in global megacities
Among all the classifiers tested, LSTM yielded the best precision, and thus was used to predict the sentiment of Tweets we collected (see Table S4). All the machine learning classifiers performed better than the baseline method, which further demonstrated the benefits of combining deeper neural networks in textual analysis. For each Tweet, we got a sentiment score of either 0 or 1. While 1 represented positive sentiments, 0 represented negative sentiments. The sentiment changes of all cities across from March 2 to May 21, 2020 are shown in Fig. 4 . The sentiment score was calculated by taking the average of sentiment scores for all Tweets collected on each day. For each day, a sentiment score of 0.5 represented neutral sentiments, while 1 and 0 represented the extremity of positive and negative sentiments, respectively. As long as the sentiment score was above/below 0.5, we considered the users of collected Twitter data to be expressing positive/negative sentiments on that day, and the value of that absolute score could be compared to see the extent of that positivity/negativity. For all Tweets collected, the average sentiment score of Tweets across the three months was 0.5099, and it had a standard deviation of 0.0318. The most clustered negative sentiment occurred in the mid of March—starting from March 9, the Tweet sentiments almost always remained negative (below 0.5) until March 25. The most consistent positive sentiment occurred in early May starting from May 6. Fig. 5 showed the Tweet sentiment changes from March 2 to May 21, 2020 in the 9 megacities. They were ordered according to the total number of Tweets collected. Similar to the way we calculated daily sentiment scores, the sentiment score on each day in each city was calculated by taking the average of sentiment scores for all collected Tweets that were posted in that particular city on that day. The horizontal red line corresponds to 0.5, which stands for neutral sentiment. In the figure for New York City, Los Angeles, and London, important dates where new quarantine measures were announced had been marked as well. Note that since the scarcity of Tweets could easily push the sentiment score to be too extreme, we removed the days when there were less than 40 Tweets posted and used linear interpolation to fill the gap. As the number of English Tweets in Rome was too small, the lower-bound Tweet number for Rome was set to be 10. Due to its limited number of Tweets, Rome was also the city that exhibited the greatest volatility among all.
Fig. 4.
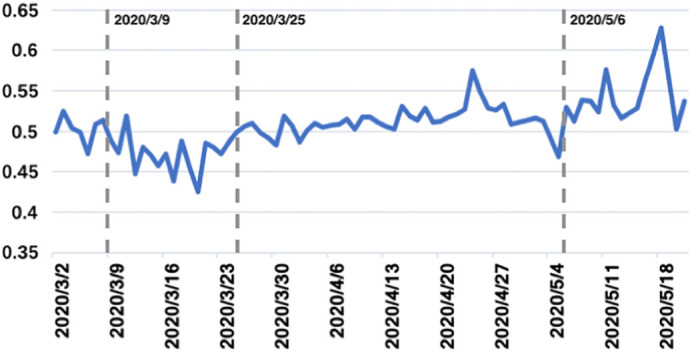
Sentiment change of all nine megacities from March 2 to May 21, 2020.
Fig. 5.

Sentiment change of each city from March 2 to May 21, 2020.
Here, possible concerns might arise with the sampling bias of Tweet data. First, those who use Twitter may not be representative of the socio-demographic characteristics of the entire city population, and therefore Tweet sentiments are not representative of overall public sentiments. We recognize this as a solid concern, and thus we have been careful to limit the scale of our conclusions to Tweet sentiments alone. However, it should be noted that although such a limitation exists, Twitter data is already performing better than most traditional survey methods in representing the general population, as Twitter provides “ready access to certain populations that are difficult to reach using other means” (McCormick et al., 2017). As an open platform, Twitter could help researchers collect data from populations across the globe and from remote rural areas while ensuring the timeliness of gathered responses. Thus, although we cannot make a definite conclusion on public sentiments based on Twitter data, the sentiments expressed in Tweets could be a good indicator of the general public sentiments in megacities. The second possible problem with using Twitter data to investigate attitudes towards COVID-19 is that those who suffer greater exposure risk from COVID-19 might be more likely to post related Tweets. Nevertheless, even if we collect data from sources other than Twitter, such as through random distribution of online or on-site surveys, self-selection bias is still an unavoidable problem with any survey investigating human behavior based on voluntary responses. We have tried to weaken the impacts of such a bias by ensuring the absolute randomness of the Tweet collection (as Fig. 2 shows, this process went well since the number of Tweets collected moved coherently with the city population). We have also enlarged our keyword- filtering list to include not only ‘COVID-19’, but also its related terms (e.g., ‘pandemic’, ‘fever’, ‘mask’, etc.) so that Tweets posted by those who were less concerned with COVID-19 but whose life was more or less influenced by such an event could also be included in our dataset. It is also worth noticing that since we are studying COVID-19, a global pandemic with an unprecedented scope of spreading, we expect the influence of self-selection bias to be less severe than other subjects like mental health. While not all people experience mental health problems, COVID-19 has affected almost every single one in our region of study. It is possible that some might be exposed to greater dangers, but no one is able to completely get rid of the threats proposed by COVID-19. As long as it constitutes a risk, people with all levels of concerns might talk about COVID-19. Thus, Twitter data could be a reliable source for the purpose of our study.
By calculating the average daily sentiment of all cities across time, we observed that in general, Tweets sentiments fluctuated around 0.5 (neutral). There were no days when the Tweet sentiments were extremely negative or extremely positive, indicating that at least on social platforms, anxiety towards coronavirus was somehow subdued. During the time span of our study, the most negative sentiments clustered around mid-March, which coincided with when WHO first defined COVID-19 to be a ‘pandemic’. It was also around this period that coronavirus had spread at a rapid speed to many countries outside of China– “the number of cases of COVID-19 outside China has increased 13-fold, and the number of affected countries has tripled” (WHO March 11, 2020). It was very likely that the negative emotions expressed in Tweets during this period were due to the increasing sense of crisis in light of WHO's speech and limited knowledge towards coronavirus. The most positive sentiments clustered around early May, when many cities previously in quarantine gradually reopened. The reopening of cities indicated that the COVID-19 pandemic had been gradually controlled in the city, and thus may bring positive vibes to the social media. The responsiveness of Tweet sentiments to important public announcements related to COVID-19 further proves that Twitter could be a valuable source for researchers to investigate social media responses to urgent public events in a real-time and data-driven manner.
4.2. The influence of quarantine policy measures and COVID-19 progress on Tweet sentiment
To ensure that the sentiment fluctuation we investigated was not the result of small sample sizes, we selected the three top cities from which we collected the most Tweets—New York City, Los Angeles, and London—to be our main targets of in-depth analysis. A more comprehensive listing of these three cities was shown in Table S5. Among the three cities, New York City had the largest real GDP, more than two times of Los Angeles and London. New York City also had larger population density than London and Los Angeles. In terms of commute, the mean travel time to work for London is the highest (74 min), followed by New York City (41.2 min) and Los Angeles (31.4 min). The three cities all had higher unemployment rate and poverty rate than country average, but this difference was greater in Los Angeles and New York City than in London. To better understand the severity of COVID-19 in each city during our period of study, we collected the number of daily new cases, hospitalization, and death cases from the corresponding official government websites of each city (see Fig. 6 ). New York City was the only city among the three cities whose number of daily new cases exceeded greatly than hospitalization, which indicated that the spread of COVID-19 had become too fast for the local healthcare system to handle. In London, the number of hospitalization decreased sharply after early April, signifying that the hospitals in London were no longer able to take in newly diagnosed clients—the spaces in hospitals were saturated already. In Los Angeles, this drop in hospitalization was less significant, meaning that the city was still able to cope with the increasing new cases for the time being. During the period of this study, the daily death cases were maintained at a rather low and stable level. It should be noted that at the early stage of the pandemic, it was highly likely that many suspected cases were not diagnosed and thus not recorded. The testing capability of hospitals was also not stable. Therefore, there existed a rather great fluctuation of new cases in the three cities.
Fig. 6.

Spread of Covid-19: Daily New Cases, Hospitalization, and Deaths in New York City, Los Angeles, and London. (Source: NYC Health, California State Government, Greater London Authority).
We also sorted out the development of quarantine policy measures from March 2 to May 21, 2020 for New York City, Los Angeles, and London in Fig. 7 . It was meant to show how local authorities responded to the spread of COVID-19. Before 2020, no diagnosed cases in the three cities were reported and thus no quarantine order was in place. Fig. 6 reveals the various stages of quarantine measures. We ranked these stages by the strictness of quarantine, and calculated the Spearman's coefficient between the rank of stage and the rank of average daily sentiment score in each city. For instance, on April 10, the average sentiment score for all Tweets posted in Los Angeles is 0.52, slightly higher than neutral, and was ranked 17th in all the daily sentiment scores of Tweets posted in Los Angeles from March 2 to May 21, since we specified that higher sentiment score would have a higher rank. Los Angeles was at Stage 6 quarantine (from April 3 to April 14), which was ranked 1st in all stages of quarantine in terms of strictness. We obtained a rank for every sentiment score and quarantine stage with the above approach in each city on each day, and then calculated the Spearman's coefficient with Python scipy.stats. Note that to get the Spearman's coefficient between two variables, we need all the ranks of the two variables in the entire period of study, since the calculation of the coefficient involves using the sum of the product between each observation and sample mean. If the Spearman's coefficient between the rank of sentiment and quarantine orders was positive and significant, it meant that when quarantine orders were more stringent, the sentiments were more positive.
Fig. 7.

Coronavirus Policy Timeline for New York City, Los Angeles, and London. (Source: abcNews, Syracuse, WIVB, NBC New York, UK Health Foundation, BBC, NBC Los Angeles, Calmatters).
The correlation heat maps illustrating the strength of correlation between Tweet sentiments, quarantine measures, and COVID-19 progress (i.e., new case emerges, hospitalization, and death) in New York City, London, and Los Angeles are shown in Fig. 8 . Lighter colors signified a more positive correlation, while darker color represented a more negative correlation. Variable named ‘Sentiment’ refers to the ranks of sentiment scores; ‘Quarantine’ refers to the ranks of quarantine policies; ‘New Cases’, ‘Hospitalization’, and ‘Death’ refer to the ranks of newly-diagnosed COVID cases, number of new patients being hospitalized, and new daily death cases, respectively. For simplicity, we used numerical digits to represent the above five variables from 0 to 5 in order. For instance, the block formed by variable 0 and variable 1 is the Spearman's coefficient between the ranks of sentiment scores and new daily death cases over the period of this study.
Fig. 8.
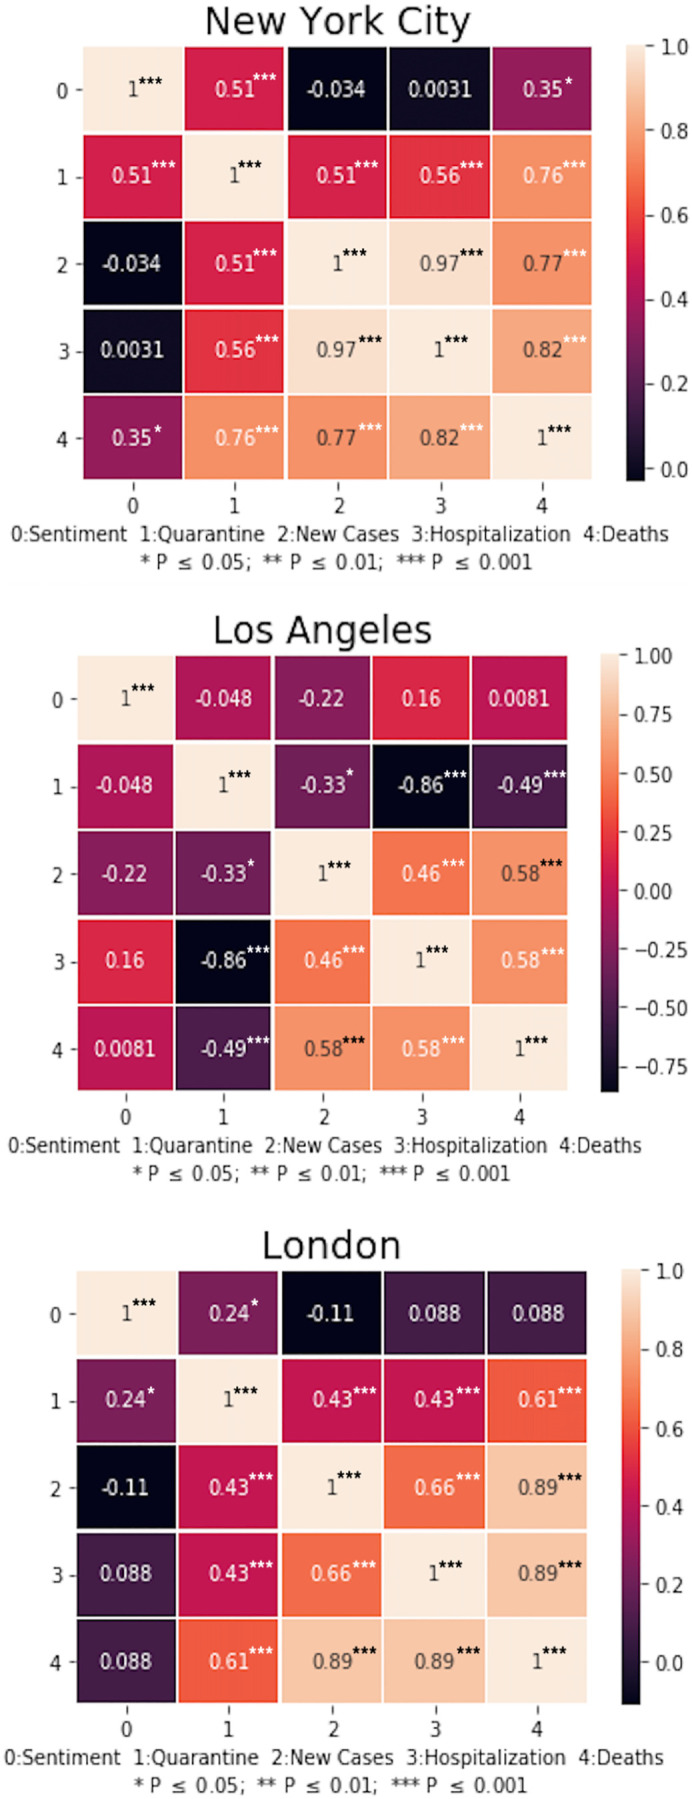
Correlation heat map between Tweet sentiment and COVID-19 related events in New York City, Los Angeles, and London. (Source: NYC Health, NHS England, Greater London Authority, Prime Minister's Office, California Department of Public Health, California State Government).
We can derive the following conclusions from Fig. 8: (1) In New York City, the rank of sentiment was positively correlated with the rank of quarantine measures (0.51). It means that the stricter quarantine measures are, the more positive Tweet sentiments are. Although on the particular dates when new quarantine measures were announced (see Fig. 5 for New York City-March 20), Tweet sentiments became more negative, possibly due to the fact that stricter quarantine indicated an increasing severity of the pandemic, over the entire period when quarantine measures were enforced, Tweet sentiments were still positively related to stricter quarantine policies. The Tweet sentiments were also increasingly positive despite the increasing death number (0.35). In contrast, the rank of Tweet sentiments in New York City did not significantly correlate with the new cases and hospitalization at the 95% confidence level. (2) In Los Angeles, there was no significant relationship between Tweet sentiments and quarantine measures. While on March 11, when the California Governor tightened gathering restrictions, Tweet sentiments became highly positive. But when the Los Angeles county actually released the ‘safer at home’ quarantine order on March 20, Tweet sentiments were negative (see Fig. 5). Also, there was no significant correlation found between Tweet sentiments and new cases, hospitalization, and deaths. However, stricter quarantine measures were negatively correlated with the reported statistics related to COVID-19. Especially with hospitalization and deaths, such a correlation was significant at the 99% confidence interval. (3) In London, the rank of sentiment was positively correlated with the rank of quarantine measures (0.24). However, Tweet sentiments in London did not exhibit a strong correlation with the new cases, hospitalization, and deaths. The Spearman's rank correlation coefficient between sentiment and quarantine measures in London was smaller than in New York City, indicating that compared with London, people in New York City were more sensitive to changes in quarantine measures.
Comparing the results in three cities, we could see that in both New York City and London, positive Tweet sentiments were related to strict quarantine measures, but not in Los Angeles. This could possibly be explained by the differences in their population density and main means of transportation. On average, New York City and London had far higher population densities than Los Angeles, and thus strict and timely quarantine measures were more important to the effective control of COVD-19 spread. Of course, this was at a city level, not considering district or neighborhood level variations of demographic distribution and characteristics of the built environment. New York City had the highest population density among the major cities in the US. It had over 27,000 people per square mile- (https://www1.nyc.gov/site/planning/index.page). London, being one of the most populous cities in Europe, also had over 14,670 people per square mile, about twice denser than Los Angeles (https://www.ons.gov.uk/). For a contagious disease like COVID-19, a high population density does not only mean that there is a larger risk of infection, but that there might be a great scarcity of valuable medical resources, especially when it comes to machines like ECMO. Given the high cost of self-protection in populous cities, it is likely that people in New York City and London are more willing to stay at home and therefore exhibited more positive reactions towards quarantine measures. Furthermore, while New York City and London relied heavily on public transportations, people in Los Angeles less frequently used public transportation, which reduced the possibility of infection in poorly ventilated buses and trains. In Los Angeles, it was reported that about 70% of people “commute to work by driving alone in individual vehicles” (http://www.census.gov/). It was likely that for people living in crowded cities such as New York City and London, anxieties about the pandemic were partially relieved by the stringent quarantine measures that helped them get rid of unnecessary proximity to the mass. Sharifi and Khavarian-Garmsir (2020) mention that public transport ridership had dropped significantly in the early phase of the pandemic as people had shifted to other modes such as cycling, walking, and private vehicle use. Such an increase in negative sentiments towards public transportation due to COVID-19 could explain why people living in cities like New York City and London, where travelling in private vehicles came at a higher cost, responded relatively positive to quarantine on Twitter, while people living in Los Angeles didn't exhibit a strong preference for quarantine measures.
Another observation worth mentioning was that in both New York City and London, quarantine measures were positively correlated with new cases (0.51, 0.43), hospitalization (0.56, 0.43), and deaths (0.76, 0.61). Namely, the more new cases, hospitalization, and deaths there were, the stricter quarantine measures. This relationship was reasonable since the upgrading quarantine strictness could be interpreted as a response to the deteriorating circumstances of the epidemic in the city. However, in Los Angeles, this correlation was reversed–when there were fewer new cases, hospitalization, and deaths, the quarantine measures were stricter; but when new cases, hospitalization, and deaths were still increasing, the quarantine measures started to ease. To explain this phenomenon, it was worth noticing that among the three cities, Los Angeles was the one that reacted to COVID-19 most rapidly and imposed social distancing the earliest. After San Francisco issued the first local shelter-in-place order for major cities in US on March 16, Los Angeles soon followed its steps on March 19, with California statewide stay-at-home order issued hours later. While California was the first state to issue a stay-at-home order to stop the spread of coronavirus, shelter-in-place order in New York City wasn't put into effect until March 22 (Yang, 2020). Meanwhile, the lock-down order in London was not placed until March 23 (Prime Minister's Office, 2020). Thus, the negative correlation between quarantine measures and new cases, hospitalization, and deaths in Los Angeles was probably a reflection of this advances of policies in response to COVID-19 cases. Strict quarantine measures were imposed at the early stage of the pandemic when there had not been a significant number of identified cases. At the later stage when the number of new cases, hospitalization, and deaths were increasing but in control, the quarantine orders were mildly lifted. On the contrary, in New York City and London, the quarantine measures were released after there had been a boost in COVID-19 cases. Los Angeles was also the only city whose Tweet sentiment did not exhibit significant relation with any major COVID-19 related news such as quarantine, new cases, hospitalization, and deaths from March to May 2020. This result indicated that Los Angeles people might be calmer and more optimistic about the development of the epidemic due to an early implementation of quarantine policies, such that Twitter sentiments remained rather unresponsive to the statistics of COVID-19 spread because they had faith in controlling the pandemic eventually. Moreover, we observed that the Tweet sentiments of the three megacities had a strong correlation with quarantine measures than the statistics related to COVID-19 (i.e., new cases, hospitalization, and deaths), which was probably because quarantine policies had direct impacts on almost everyone in the city, while the numbers in news seemed more irrelevant and distant to most viewers.
Some interesting observations could also be made on the association between lock-down policies and social media outcomes. While New York City, Los Angeles, and London exhibited a different correlation between Tweet sentiments and quarantine policies, we could see from Fig. 5 that on each of the days when new quarantine policies were announced, the sentiment score for that day would almost always be a local minimum or maximum. This result was consistent with the findings of several previous studies on policies and social media sentiments—that public policies could incite or even polarize public sentiments presented on social media. Bail et al. (2018) have mentioned that social media could create either “echo chambers” effects or backfire effects that exacerbate opinion polarization. While the “echo chambers” effect will make people selectively absorb social media sentiments and opinions similar to their pre-existing beliefs, the backfire effect could let those who are exposed to opposing opinions feel a strong urgency to defend their original position. Therefore, we could see a greater fluctuation of sentiments when new quarantine policies were announced. The responses of Twitter may further influence opinions outside of social media platforms. Thus, it is important that public sentiments be tracked as part of the policy-making process, especially when it comes to public health events as exigent as COVID-19.
5. Conclusion
This study applied multiple machine learning classifiers to examine Tweet sentiment changes across nine megacities from March 2 to May 21, 2020. The results showed that negative Tweet sentiments clustered in mid-March, when COVID-19 speeded up spreading across various countries; positive Tweet sentiments clustered in early May, when cities gradually reopened from quarantine. At city level, New York City, Los Angeles, and London responded to the pandemic differently. While positive Tweet sentiments in New York City and London were positively related to strict quarantine measures, Los Angeles citizens' sentiment towards coronavirus was not. Furthermore, the three megacities' Tweet sentiments were less sensitive to the COVID-19 statistics related to new cases, hospitalization, and deaths than quarantine measures, which had more direct impacts on almost every citizen in the city. In New York City and London, the strictness of quarantine measures was positively correlated with new cases, hospitalization, and deaths, while in Los Angeles this correlation was negative. The results of this study demonstrated the positive influence of quarantine measures on public sentiment during the COVID-19 pandemic, and further called for prompt and effective quarantine order at an early stage of contagious diseases in heavily populated cities.
There are several limitations of this study that could be addressed in future works. First, the effects of internet slang (such as LOL) and more complicated Emojis could be taken into consideration to improve the accuracy of sentiment prediction. Second, future works could remove robotic/official accounts for better representation of valid individuals' sentiments. Considering that the proportion of such accounts were usually small relative to the overall data size, these accounts were not removed in this study. Finally, this study only showed the polarity of Tweet sentiments, but it did not show what specific sentiments were expressed, for instance, anger, sadness, happiness, etc. It was also worth noticing that while Twitter sentiments provided us important insights on public sentiments, the sentiments exhibited on social media platforms did not necessarily equal to people's real emotions in life.
The study of public sentiments using Twitter data during pandemics could provide valuable insights for implementation of pandemic policies at a city level. Understanding the emotions of the public can provide references from the perspectives of public health, transportation, and economic recovery. Indeed, we need to find more feasible and pragmatic measures to control the panic brought by huge pandemics, know what types of measures are people most sensitive to, and gain experience to better prepare for future crisis.
CRediT authorship contribution statement
Yao, Z.: Methodology, Visualization, Writing- Original draft preparation. Yang, J.: Methodology, Investigation. Liu, J.: Conceptualization, Data curation, Writing-Reviewing and Editing. Keith, M.: Methodology, Supervision. Guan, C.: Methodology, Validation.
Declaration of competing interest
The authors declare that they have no known competing financial interests or personal relationships that could have appeared to influence the work reported in this paper.
Acknowledgments
Acknowledgement
The study is funded by Initiative Programme for Young Scholar of Shanghai Academy of Landscape Architecture Science and Planning (KT00257), Open Project Fund of Technology Innovation Center for Land Spatial Eco-restoration in Metropolitan Area, Ministry of Natural Resources of PRC (CXZX202002), and Shanghai Pujiang Program (2019PJC076).
We thank academic supports from Open Projects Fund of Shanghai Key Laboratory of Urban Renewal and Spatial Optimization Technology of Tongji University, PEAK Urban programme from University of Oxford, Harvard-China Project on Energy, Economy and Environment from the Harvard Global Institute, and Zaanheh Project and the Center for Data Science and Artificial Intelligence from NYU Shanghai.
Data and codes are available on Https://drive.google.com/file/d/13S2xU3TZRfNFM0wGy0sdKO94arUibbHn/view?usp=sharing.
Footnotes
Supplementary data to this article can be found online at https://doi.org/10.1016/j.cities.2021.103273.
Appendix A. Supplementary data
Supplementary tables
References
- Abraham J., Higdon D., Nelson J., Ibarra J. Cryptocurrency price prediction using tweet volumes and sentiment analysis. SMU Data Science Review. 2018;1(3) https://scholar.smu.edu/datasciencereview/vol1/iss3/1 [Google Scholar]
- Adams-Cohen N.J. Policy change and public opinion: Measuring shifting political sentiment with social media data. American Politics Research. 2020;48(5):612–621. https://resolver.caltech.edu/CaltechAUTHORS:20200717-070757859 ISSN 1532-673X. [Google Scholar]
- Ansari A.F., Seenivasan A., Anandan A., Lakshmanan R. Twitter-sentiment-analysis. 2019. https://github.com/abdulfatir/twitter-sentiment-analysis
- Bail C.A., Argyle L.P., Brown T.W., Bumpus J.P., Chen H., Hunzaker M.B.…Volfovsky A. Exposure to opposing views on social media can increase political polarization. Proceedings of the National Academy of Sciences. 2018;115(37):9216–9221. doi: 10.1073/pnas.1804840115. [DOI] [PMC free article] [PubMed] [Google Scholar]
- Bertrand K.Z., Bialik M., Virdee K., Gros A., Bar-Yam Y. Sentiment in New York City: A high resolution spatial and temporal view. arXiV. 2013 https://arxiv.org/abs/1308.5010v1 1308.5010 [physics.soc-ph] [Google Scholar]
- Bogers T., Bjorneborn L. iConference 2013 Proceedings. 2013. Micro-serendipity: Meaningful coincidences in everyday life shared on Twitter; pp. 196–208. [DOI] [Google Scholar]
- Bollen J., Pepe A., Mao H. Proceedings of the fifth international AAAI conference on weblogs and social media (ICWSM 2011), 17-21 July 2011, Barcelona, Spain. 2011. Modeling public mood and emotion: Twitter sentiment and socioeconomic phenomena. 2010. arXiv:0911.1583 [cs.CY] [Google Scholar]
- Bradley M.M., Lang P.J. University of Florida, Center for Research in Psychophysiology; Gainesville: 1999. Affective norms for english words (ANEW): Stimuli, instruction manual, and affective ratings (tech. Report C-1) [Google Scholar]
- Chew C., Eysenbach G. Pandemics in the age of twitter: Content analysis of tweets during the 2009 H1N1 outbreak. PLoS One. 2010;5(11) doi: 10.1371/journal.pone.0014118. [DOI] [PMC free article] [PubMed] [Google Scholar]
- Chung W., Zeng D. Social media based public policy informatics: Sentiment and network analyses of U.S. immigration and border security. Journal of the Association for Information Science and Technology. 2016;67(7):1588–1606. doi: 10.1002/asi.23449. [DOI] [Google Scholar]
- Coronavirus: English Local Elections Postponed for a Year BBC News. 2020, March 13. https://www.bbc.com/news/uk-politics-51876269 Retrieved from.
- Coronavirus: The World in Lockdown in Maps and Charts BBC News. 2020, April 7 https://www.bbc.com/news/world-52103747 Retrieved from. [Google Scholar]
- Coronavirus: Worst Economic Crisis Since 1930s Depression, IMF Says BBC News. 2020, April 9. https://www.bbc.com/news/business-52236936 Retrieved from.
- Davidov D., Tsur O., Rappoport A. Coling 2010 - 23rd international conference on computational linguistics, proceedings of the conference. Vol. 2. 2010. Enhanced sentiment learning using twitter hashtags and smileys; pp. 241–249. [Google Scholar]
- Dubey A.D. Twitter sentiment analysis during COVID19 outbreak. 2020. https://ssrn.com/abstract=3572023 Available at:
- Flores R.D. Do anti-immigrant laws shape public sentiment? A study of Arizona’s SB 1070 using twitter data. American Journal of Sociology. 2017;123(2):333–384. [Google Scholar]
- Frias-Martinez V., Soto V., Hohwald H., Frias-Martinez E. 2012 international conference on privacy, security, risk and trust and 2012 international conference on social computing, Amsterdam, 2012. 2012. Characterizing urban landscapes using geolocated tweets; pp. 239–248. [Google Scholar]
- Gandhe K., Varde A.S., Du X. 2018 9th IEEE annual ubiquitous computing, Electronics & Mobile Communication Conference (UEMCON), New York City, NY, USA. Vol. 2018. 2018. Sentiment analysis of twitter data with hybrid learning for recommender applications; pp. 57–63. [DOI] [Google Scholar]
- Giachanou A., Rosso P., Crestani F. Proceedings of the 42nd International ACM SIGIR Conference on Research and Development in Information Retrieval. 2019. Leveraging emotional signals for credibility detection; pp. 877–880. [Google Scholar]
- Go A., Bhayani R., Huang L. CS224N project report, Stanford. 1 (12) 2009. Twitter sentiment classification using distant supervision. [Google Scholar]
- Hochreiter S., Schmidhuber J. Long short-term memory. Neural Computation. 1997;9(8):1735–1780. doi: 10.1162/neco.1997.9.8.1735. [DOI] [PubMed] [Google Scholar]
- Hu M., Liu B. Proceedings of the Tenth ACM SIGKDD International Conference on Knowledge Discovery and Data Mining. 2004. Mining and summarizing customer reviews; pp. 168–177. [Google Scholar]
- Hu L., Li Z., Ye X. Delineating and modeling activity space using geotagged social media data. Cartography and Geographic Information Science. 2020;47(3):277–288. doi: 10.1080/15230406.2019.1705187. [DOI] [Google Scholar]
- Jain V.K., Kumar S. An effective approach to track levels of influenza-A (H1N1) pandemic in India using twitter. Procedia Computer Science. 2015;70:801–807. [Google Scholar]
- Kim Y. Convolutional neural networks for sentence classification. arXiv Preprint. 2014 arXiv:1408.5882 [Google Scholar]
- Kingma D.P., Ba J. Adam: A method for stochastic optimization. Published as a conference paper at the 3rd international conference for learning representations, San Diego, 2015. arXiv. 2015 1412.6980 [cs.LG] [Google Scholar]
- Kontopoulos E., Berberidis C., Dergiades T., Bassiliades N. Ontology-based sentiment analysis of twitter posts. Expert Systems with Applications. 2013;40:4065–4074. [Google Scholar]
- Liu I.L.B., Cheung C.M.K., Lee M.K.O. Understanding twitter usage: What drive people continue to tweet. Pacis. 2010;92:928–939. [Google Scholar]
- Liu L., Tang L., Dong W., Yao S., Zhou W. An overview of topic modeling and its current applications in bioinformatics. SpringerPlus. 2016;5(1):1608. doi: 10.1186/s40064-016-3252-8. [DOI] [PMC free article] [PubMed] [Google Scholar]
- MacEachren A.M., Robinson A.C., Jaiswal A., Pezanowski S., Savelyev A., Blanford J.I., Mitra P. Proceedings, 25th international cartographic conference. France; Paris: 2011. Geo-twitter analytics: Applications in crisis management. [Google Scholar]
- Maynard D., Greenwood M. Proceedings of the 9th international language resources and evaluation conference (LREC’14) European Language Resources Association (ELRA); 2014. Who cares about sarcastic tweets? Investigating the impact of sarcasm on sentiment analysis; pp. 4238–4243. [Google Scholar]
- McCormick T.H., Lee H., Cesare N., Shojaie A., Spiro E.S. Using twitter for demographic and social science research: Tools for data collection and processing. Sociological Methods & Research. 2017;46(3):390–421. doi: 10.1177/0049124115605339. [DOI] [PMC free article] [PubMed] [Google Scholar]
- McTear M.F., Callejas Z., Griol D. Vol. 6. Springer; Cham: 2016. The conversational interface; p. 102. No. 94. [Google Scholar]
- Medford R.J., Saleh S.N., Sumarsono A., Perl T.M., Lehmann C.U. An “Infodemic”: Leveraging high-volume twitter data to understand public sentiment for the COVID-19 outbreak. medRxiv. 2020 doi: 10.1101/2020.04.03.20052936. 2020.04.03.20052936. [DOI] [PMC free article] [PubMed] [Google Scholar]
- Miller F., Davis K., Partridge H. Everyday life information experiences in twitter: A grounded theory. Information Research. 2019;24(2):1–23. http://www.webcitation.org/78moc4YgU [Google Scholar]
- Neppalli V.K., Caragea C., Squicciarini A., Tapia A., Stehle S. Sentiment analysis during hurricane Sandy in emergency response. International Journal of Disaster Risk Reduction. 2017;21:213–222. [Google Scholar]
- Nielsen A.F. Proceedings of the ESWC2011 workshop on “Making sense of Microposts”: Big things come in small packages. Vol. 2011. 2011. A new ANEW: Evaluation of a word list for sentiment analysis in microblogs; pp. 93–98. arXiv: 1103.2903 [cs.IR] [Google Scholar]
- Odlum M., Yoon S. What can we learn about the Ebola outbreak from tweets? American Journal of Infection Control. 2015;43(6):563–571. doi: 10.1016/j.ajic.2015.02.023. ISSN 0196-6553. [DOI] [PMC free article] [PubMed] [Google Scholar]
- Page B.I., Shapiro R.Y. Effects of public opinion on policy. The American Political Science Review. 1983;77(1):175–190. doi: 10.2307/1956018. [DOI] [Google Scholar]
- Pak A., Paroubek P. Proceedings of LREC. 2010. Twitter as a corpus for sentiment analysis and opinion mining; p. 10. [Google Scholar]
- Pang B., Lee L. Opinion mining and sentiment analysis. Foundations and Trends in Information Retrieval. 2008;2(1–2):1–135. doi: 10.1561/15000000011. [DOI] [Google Scholar]
- Pennington J., Socher R., Manning C.D. GloVe: Global vectors for word representation. 2014. https://nlp.stanford.edu/projects/glove/
- Prime Minister'’s Office Prime Minister's statement on COVID-19: 23 March 2020. 2020. https://www.gov.uk/government/speeches/pm-address-to-the-nation-on-coronavirus-23-march-2020 Retrieved from.
- Quercia D., Ellis J., Capra L., Crowcroft J. 2012. Tracking “gross community happiness” from tweets; pp. 965–968. [DOI] [Google Scholar]
- Rajput N.K., Grover B.A., Rathi V.K. Word frequency and sentiment analysis of twitter messages during coronavirus pandemic. 2020. arXiv:2004.03925
- Sakaki T., Okazaki M., Matsuo Y. Proceedings of the 19th international conference on world wide web. 2010. Earthquake shakes twitter users: Real-time event detection by social sensors; pp. 851–860. WWW ’10. [Google Scholar]
- Sanders N.J. Sanders Analytics. Sanders Analytics LLC; 2011. Twitter sentiment Corpus.https://www.hugedomains.com/domain_profile.cfm?d=sananalytics&e=com [Google Scholar]
- Sharifi A., Khavarian-Garmsir A.R. The COVID-19 pandemic: Impacts on cities and major lessons for urban planning, design, and management. Science of The Total Environment. 2020;749:142391. doi: 10.1016/j.scitotenv.2020.142391. ISSN 0048-9697. [DOI] [PMC free article] [PubMed] [Google Scholar]
- Srivastava M., Khatri S.K., Sinha S., Ahluwalia A.S., Johri P. Noida; India: 2018. “Understanding relation between public sentiments and government policy reforms,” 2018 7th international conference on reliability, Infocom technologies and optimization (trends and future directions) (ICRITO) pp. 213–218. [DOI] [Google Scholar]
- Szomszor M., Kostkova P., Quincey D., editors. Lecture Notes of the Institute for Computer Sciences, Social-Informatics and Telecommunications Engineering. Vol. 69. 2010. #Swineflu: Twitter Predicts swine flu outbreak in 2009; pp. 18–26. [DOI] [Google Scholar]
- Wakamiya S., Lee R., Sumiya K. Proceedings of the 3rd ACM SIGSPATIAL international workshop on location-based social networks. 2011. Crowd-based urban characterization: Extracting crowd behavioral patterns in urban areas from Twitter; pp. 77–84. [Google Scholar]
- WHO Coronavirus Disease (COVID-19) Dashboard 2020, July 3. https://covid19.who.int/?gclid=EAIaIQobChMI2eSE1NKy6gIVTT5gCh0ylwT_EAAYASABEgKO7vD_BwE Retrieved from.
- World Health Organization WHO Director-General's opening remarks at the media briefing on COVID-19 - 11 March 2020. 2020, March 11. https://www.who.int/dg/speeches/detail/who-director-general-s-opening-remarks-at-the-media-briefing-on-covid-19---11-march-2020 Retrieved from.
- Xue J., Chen J., Hu R., Chen C., Zheng C., Liu X., Zhu T. Twitter discussions and emotions about COVID-19 pandemic: A machine learning approach. 2020. arXiv:2005.12830 [DOI] [PMC free article] [PubMed]
- Yang California and New York were both hit by COVID-19 early, but the results are very different. CNN opinion. 2020, April 16. https://edition.cnn.com/2020/04/14/opinions/california-new-york-covid-19-coronavirus-yang/index.html Retrieved from.
Associated Data
This section collects any data citations, data availability statements, or supplementary materials included in this article.
Supplementary Materials
Supplementary tables