

Abstract
Objective:
The ability to differentiate similar choreic involuntary movements could lay the groundwork for the development of a minimally-invasive screening tool for their etiology and provide in-depth understandings of pathophysiology. As a first step, we investigate kinematic differences between Huntington’s disease (HD) chorea and Parkinson’s disease (PD) choreic levodopa-induced dyskinesia (LID), which have distinct pathological causes yet share a great kinematic resemblance.
Methods:
Twenty subjects with HD and ten subjects with PD stood with both upper limbs in front of them for approximately 60 seconds. The three-dimensional velocity time-series of involuntary movements of both hands were segmented into one-dimensional sub-movements abutted by velocity zero-crossings. A combination of unsupervised and supervised machine learning algorithms was employed to automatically select data features extracted from sub-movements and distinguish the two types of involuntary choreic movements.
Results:
The trained model was able to accurately classify chorea vs. LID with an Area Under the Receiver Operating Characteristic Curve of 99.5 %. A set of important features contributing to the construction of the classification model were identified and investigated.
Conclusion:
The trained model may serve as a tool for the automatic identification of different types of involuntary choreic movements, enabling continuous monitoring and personalized treatment for patients in various clinical settings.
Significance:
The results provide insights into kinematic characteristics of HD chorea and PD LID, which is the first step towards an improved general understanding of involuntary choreic movements.
Keywords: Huntington’s disease, Parkinson’s disease, movement element, involuntary movement
I. Introduction
Involuntary movements are a significant factor of disability and impaired quality of life across a multitude of disorders. They can affect any part of the body, and their pathophysiology is usually poorly understood. It is generally accepted that there are seven major types of involuntary movements: 1) tremor, 2) tics, 3) myoclonus, 4) chorea, 5) athetosis, 6) dystonia, and 7) hemiballismus [1], [2]. Identifying differences between various types of involuntary movements and between different manifestations of a specific involuntary movement is of paramount importance because they may require a specific treatment regimen based on its etiology and pathophysiology (e.g., targeted interventions). While distinguishing between different types of involuntary movements is usually possible with a thorough clinical examination by trained medical specialists [3], the scarcity of those specialists in rural and underserved areas can lead to misdiagnosis and delays in receiving proper treatments [4]. Moreover, even if the type of involuntary movements can be accurately identified, determining the etiology and underlying pathophysiological mechanisms require specialized tools and trained clinicians. Therefore, there is a need to develop tools that can help identify the presence and type of involuntary movements, as well as their potential etiologies to optimize patient management.
While a significant amount of work has been done on developing technology-based methods to identify tremor and differentiate its etiologies based on kinematic features [5]–[7], very little work—if any—has been done for the other types of involuntary movements. Chorea, for instance, is a combination of complex involuntary, irregular, and unpredictable movements that can occur throughout the body. Although it is a hallmark of Huntington’s disease (HD) and Sydenham chorea [8], it can also be caused by stroke [9], infectious diseases [10], autoimmune disorders such as multiple sclerosis [11] and lupus [12], toxins such as mercury [13], and medication such as levodopa [14] and amphetamines [15]. However, tools to aid clinicians in identifying the etiology of chorea have been significantly understudied in the files.
In this study, we demonstrate the feasibility of identifying the kinematic characteristics of choreic involuntary movements, which is the first step to design tools to understand the etiology of choreic involuntary movement. To this end, we use data from chorea of HD and levodopa-induced dyskinesia (LID) of Parkinson’s disease (PD) as a driving example because 1) they are the most common causes of chorea, and 2) they share similar clinical manifestation (e.g., randomness, speed, irregularity, and lack of rhythmicity) [14]. For instance, previous work showed that visually distinguishing between chorea and LID, even by a trained clinician, is quite difficult (F1 score of 0.77) [16]. However, their pathophysiology—though not yet fully understood—is believed to be distinct. HD chorea is believed to be related to the progressive loss of D2 expressing GABAergic medium spiny striatal neurons of the indirect pathway of the basal ganglia [17], [18], leading to hypoactivity within this pathway, and impairment in its function of inhibiting unwanted movements [19]. PD LID, on the other hand, is believed to be related to the altered sensitivity of GABAergic medium spiny neurons that express predominantly D1 receptors associated with the direct pathway of the basal ganglia [18]. This leads to hyperactivity within the direct pathway, impairing its proper functioning of facilitating voluntary movements [20]. In practical clinical scenarios, differentiating between HD chorea vs. PD LID could be readily obtained via a thorough review of the patient’s medical history (e.g., whether the patient is taking levodopa). However, the analysis of kinematic differences between HD chorea and PD LID—and more generally, other types of choreic involuntary movements—could help explain the specific pathway dysfunctions in the basal ganglia that contribute to a better understanding of their pathophysiology [14]. Clinically, the ability to identify different choreic movements has major implications, particularly in HD, since chorea is the primary motor symptom that clinicians use to screen for the disease prior to ordering genetic tests [21]. However, minimal chorea, along with other misleading factors, such as the absence of cognitive symptoms and long family history of parkinsonism, may complicate examinations and result in an incorrect diagnosis [21].
We employ data-driven, multi-dimensional approaches to investigate kinematic differences between LID and chorea from sensors placed on patients’ upper-limbs. In particular, we leverage a unique movement decomposition method to extract features from motor primitives rather than relying only on observable motor characteristics (e.g., frequency dispersion or kurtosis of movement velocity) [22]. Prior studies have shown that three-dimensional (3D) complex, voluntary movements could be decomposed into simple 1D submovements by segmenting the time-series of wrist movement velocity at its zero-crossing in each anatomical axis independently (i.e., the anteroposterior, mediolateral, and rostrocaudal axes) [22], [23]. These motor primitives, also referred to as movement elements, exhibit a consistent bell-shaped velocity profile and follow a two-thirds power law between the mean velocity and displacement in neurologically intact, healthy individuals [22]. These characteristics are believed to be a consequence of the motor optimization process associated with motor planning. Other studies have shown that kinematic patterns of movement elements contain information related to upper-limb impairment severity in stroke survivors [24], [25] and cerebellar ataxia [26]. Here, we believe that, although HD chorea and LID are involuntary movements, they could be analyzed using this method because they are not merely noise within the motor system but rather are the involuntary release of motor programs [27]. Thus, HD chorea and LID would still exhibit kinematic features similar to those observed in voluntary movements [22]. At the same time, we hypothesize that, because different basal ganglia pathways are involved in the production of HD chorea and LID, movement elements extracted from these two involuntary movements would exhibit differences in morphological and scaling features that uniquely support the identification of underlying motor characteristics.
II. Methods
A. Study Participants
This study leveraged a dataset that our research team had previously collected from 20 subjects with HD (56.9 ± 12.3 years old, mean ± standard deviation) and 10 subjects with PD (67.5 ± 6.3 years old) [14], [28]–[30]. Of note, there is a statistically significant difference in age between the two groups. While previous work has shown that age impacts voluntary motor performance [31], there is no evidence that the same applies to involuntary movements as those studied here. Furthermore, a large body of work has shown that the disease-related impairments of HD and PD have a much larger impact on voluntary motor performance than age [32]–[34]. Based on this, a correction for age was not performed on our dataset. In order to be included in the dataset, choreic HD patients were diagnosed with adult onset HD and demonstrated little to no psychiatric disturbance that could impede their understanding of the tasks. The inclusion criteria for the PD group stipulated that patients had not undergone any surgical procedures for their disease, that they had mild-to-moderate choreic peak-dose dyskinesia, and that they had no significant psychiatric/cognitive impairments that could impede their understanding of the tasks. The average motor score of the Unified Parkinson’s Disease Rating Scale (UPDRS) [35] for the patients with PD included in this dataset was 22.05 ± 13.35 (mean ± standard deviation); indicating mild-to-moderate impairment. However, the equivalent motor assessment for the patients with HD (the Unified Huntington’s Disease Rating Scale (UHDRS) was not available. The study was conducted in accordance with the Helsinki Declaration of 1975, as revised in 2000.
B. Data Collection
An electromagnetic motion capture system (MotionMonitor, USA) was used to capture the involuntary movements of the study subjects. Sensors were placed at 15 different body locations to collect 3D position time-series within a global coordinate system at a sampling rate of 100 Hz. In this study, we leveraged only a subset of the position time-series data obtained from five body locations—i.e., the bilateral hands for analyzing involuntary movement, and the bilateral scapulae and sacrum for identifying the anatomical body axes (see Section II-C for details). Subjects were asked to stand still while holding both upper-limbs in front of them for approximately 60 seconds, as shown in Fig. 1a. This motor task was repeated 2–8 times per subject, which yielded a total of 124 trials (i.e., 72 trials from the HD group and 52 trials from the PD group). Fig. 1b and c illustrate 3D trajectories of involuntary hand movements obtained from one HD patient and one PD patient, respectively.
Fig. 1.
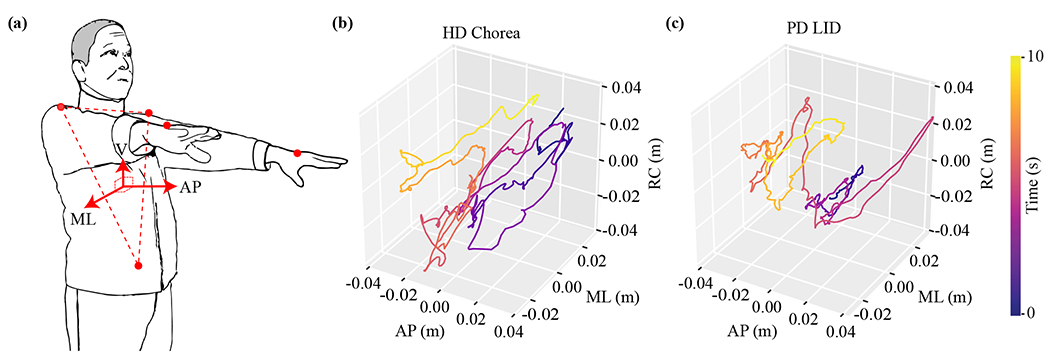
(a) A subject stood still and held both upper-limbs up in front for approximately 60 seconds. The orange dots on the bilateral hands, bilateral scapulae and sacrum represent sensors for an electromagnetic motion capture system. The facing direction (i.e. the arrow marked by AP) is along the normal vector orthogonal to the plane of the torso defined by the sensors on bilateral scapulae and sacrum (i.e. the dashed triangle). Examples of 3D hand trajectories representing (b) HD chorea and (c) PD LID. Abbreviation: AP—anteroposterior, ML—mediolateral, RC—rostrocaudal
C. Times-Series Pre-processing and Decomposition
Fig 2 shows the data analytic pipeline for analyzing the key motor characteristics of chorea and LID via a combination of unsupervised and supervised machine learning techniques. The motion capture system recorded 3D position time-series in a fixed global coordinate system, where the z-axis was aligned to the opposite direction of gravity. Because the movement element decomposition technique segments movement velocity at zero crossings in each of the anatomical body axes, the coordinate system of the position time-series needed to be rotated in the x-y plane to align with the anatomical axes. The anteroposterior axis (i.e., facing direction) was estimated by computing the mean 3D orientation of the torso using the three markers positioned on the sacrum and bilateral scapulae (see Fig 1a). The orientation of the torso was represented by the normal vector orthogonal to the plane defined by the mean position of the three above-mentioned markers. We observed negligible variations in the orientation of the facing direction throughout the motor task; the mean and standard deviation of the angle difference between the facing direction and the x-axis of the global coordinate system across the study participants were only 1° ± 1.27°. The x-y plane of the position data derived from the motion capture system was then rotated to align its x-axis with the computed normal vector (i.e., anteroposterior axis).
Fig. 2.

The data analytic pipeline to differentiate and investigate motor characteristics associated with chorea and LID.
The rotated position time-series were first low-pass filtered using a 6th order Butterworth filter with a cut-off frequency of 8 Hz to attenuate high-frequency, non-human-generated noise in the collected data [36]. Then, the gradients along each axis were computed to yield velocity time-series. Velocity time-series were again low-pass filtered using the same topology to attenuate noise.
To derive movement elements, the filtered velocity time-series were segmented at zero crossings within each anatomical axis independently, as shown in Fig. 3a. Each movement element was then 1) spatially normalized by dividing the velocity amplitude with the mean velocity and 2) temporally normalized by re-sampling the movement element vector to a fixed length of 100 data points (see Fig. 3b), as suggested by prior research [22], [24]. This normalization process ensures that the shapes of movement elements become invariant to their size and allows a direct comparison of morphology among movement elements, which has been reported to carry important information related to motor impairments [24], [26]. While prior studies time-normalized movement elements to 50 data points [22], [24], we opted for a larger number of data points (i.e., 100 data points) to preserve the fine-grained kinematics of choreic involuntary movements [3].
Fig. 3.

(a) Five seconds of velocity times-series from a random subject. The vertical lines segment the velocity time-series at zero-crossings. (b) The temporal and spatial normalization process of time-series segments (left) into movement elements (right).
To attenuate the potential negative impacts of noise generated by the motion capture system, we eliminated movement elements with a duration of less than 50 ms or with a traveled distance less than 0.76 mm. The threshold for the minimum duration (i.e., 50 ms) was chosen based on a prior study [24]. The minimum distance threshold (i.e., 0.76 mm) was the smallest distance that could be detected by the motion capture system used in this study.
D. Identification of Short-Duration vs. Long-Duration Set
Prior studies have shown that movement elements generated by neurologically intact individuals during voluntary upper-limb movements obey a two-third power law [22], [23], which describes that and D of movement elements show a log-linear relationship with a slope of approximately 2/3. In other words, when movement elements of healthy individuals’ voluntary movements are projected on a 2D log space of and D, the mean velocity of movement elements scales by approximately 2/3 of the traveled distance. Fig. 4a and b visualize movement elements of HD chorea and LID in the 2D log space, respectively. We observed two visually-identifiable subsets of movement elements in both plots, each of which showed a log-linear relationship. These two subsets were similarly observed when movement elements of HD chorea and LID were aggregated in the same 2D log space, as shown in Fig. 4c. The slopes of the two subsets appeared to be slightly different but both significantly greater than 2/3. Such patterns have not yet been reported in prior studies on voluntary movement elements generated by 1) healthy individuals [22], 2) stroke survivors with motor impairments [24], or 3) individuals with ataxia [26], all of which demonstrated a single set of movement elements with a slope close to 2/3. Because of the involuntary and irregular nature of HD chorea and LID, we hypothesized that these two subsets may relate to distinct characteristics of involuntary choreic movements, which will contribute to the differentiation of HD chorea and LID. Hence, we devised a data-driven method that can analytically separate these two subsets, such that data features could be independently extracted from them.
Fig. 4.

(a) and (b) show that movement elements from LID and HD chorea composed a higher-positioned subset and a lower-positioned subset in the – D space, respectively. (c) Movement elements from LID and HD chorea were combined. (d) The movement elements were transformed from – D space to a new feature space by PCA and Quantile Transform. (e) K-Means was applied to separate the data points into two distinct subsets in the transformed space. (f) The clustering results were projected back to the – D space. The blue subset was identified as the short-duration set and the red subset was identified as the long-duration set. The above-mentioned steps were performed in a LOSOCV manner.
The analysis was performed using the Leave-One-Subject-Out Cross Validation (LOSOCV) technique, which withholds the data pertaining to a single subject as the testing set and designates the remaining data as the training set. The trained model is evaluated on the testing set, and this process is iterated until all subjects serve once as the testing set. LOSOCV is an evaluation method that is widely accepted as a means to generalize the performance of machine learning models with minimal biases, particularly for relatively small datasets [37].
We first defined the higher-positioned and lower-positioned subsets in Fig. 4c as short-duration set and long-duration set, respectively. This is because, given a fixed D on the x-axis, the two subsets represented movement elements with different velocities on the y-axis and hence, different duration to constitute movement elements. Because there exist no ground truth labels for these two subsets, we employed an unsupervised clustering algorithm (i.e., K-means algorithm with K = 2). However, because the data points were sparsely populated along a single direction in the 2D space of log() and log(D), it yielded large within-cluster sum, which prevented the clustering algorithm to split the two sets effectively. Therefore, we transformed the feature space of the training set by 1) applying Principal Component Analysis (PCA [38]) to identify the direction of large variance (i.e., the first PC), 2) rotating the coordinate system to align its x-axis to the first PC, and 3) applying Quantile Transformation [39] to reduce the high variance in the data, as shown in Fig. 4d. Overall, the variances explained by the principal components were 91.0 % and 9.0 %, which indicates that most of the data were concentrated on the first PC as expected. The K-means algorithm was then trained on the training set to identify the two clusters within the transformed space (Fig. 4e). Finally, the transformation and normalization parameters and the clustering model were applied to the testing set to identify its short- and long-duration sets. The clustering results of the training and testing sets were re-transformed back to the original -D space, as shown in Fig. 4f, for the subsequent supervised learning to differentiate HD chorea vs. LID.
E. Feature Extraction
Section II-D yielded three different important sets of movement elements in the -D space: 1) the short-duration set, 2) the long-duration set, and 3) the set of all movement elements (i.e., a combination of the short- and long-duration sets). We hypothesized that these sets contain unique characteristics associated with involuntary movements. Hence, we extracted data features related to kinematic characteristics of chorea and LID from each of these sets. First, we computed the median, maximum, standard deviation, interquartile range, root mean square, and skewness of each normalized movement element. In addition, for each movement element, we also included its corresponding log absolute displacement and log absolute mean of unnormalized velocity. Then, we aggregated these measures of movement elements per each trial of the motor task by taking the mean, standard deviation, interquartile range, 10th, 50th and 90th percentiles. These data features were also similarly used in a prior study and have shown to contain information related to motor characteristics in stroke survivors with upper-limb impairments [24]. All features of the training set were normalized to zero median and unit interquartile range [40]. Overall, a total of 144 features were extracted for each trial from each subject.
F. Feature Selection and Classification of HD Chorea vs. LID
We employed the wrapper approach that integrates the feature selection and classification processes to identify a subset of relevant kinematic data features and train a model to distinguish HD chorea vs. LID [41]. The analysis was again performed using LOSOCV. More specifically, we employed nested, two-layer LOSOCV where 1) the outer LOSOCV was used for model evaluation and 2) the inner LOSOCV within the training set was used for feature selection and hyperparameter optimization. First, a single feature that showed the best classification performance within the inner LOSOCV was identified. To do so, we linearly probed the entire value range of each feature to compute its Receiver Operating Characteristic Curve (AUC-ROC), similarly to constructing a single feature classifier. Once the first feature with the largest AUC-ROC was identified, a subsequent feature, which yielded the highest AUC-ROC when combined with the first feature using a supervised learning classifier, was added to the feature set. This process was iterated until the selected feature set reached the maximum number of features, a process also known as the forward selection approach. The maximum number of features was defined as 10% of the number of subjects involved in the analysis, suggested by a prior study [42], which was equal to 3 in this work. We used the Support Vector Machine (SVM) algorithm with linear kernel as our multi-variate classifier. Because our dataset was slightly unbalanced, we employed the cost-sensitive classification technique that assigns added penalty for misclassification inversely proportional to the number of samples for each class. The regularization parameter C of SVM was determined by logarithmically-spaced grid search between 101 and 103 within the inner LOSOCV. Once the optimal feature set and hyperparameters were identified, we trained the final SVM classification model on the entire training data designated by the outer LOSOCV, which was then evaluated on the left-out testing data.
III. Results
A. Identification of the Short- and Long-Duration Sets
Table I summarizes important characteristics of the short- and long-duration sets that were identified using the unsupervised clustering method described in Section II-D. The short- and long-duration sets of HD chorea accounted for 53.98 % and 46.02 % of all movement elements, respectively. Similarly, LID contained 58.65 % of short-duration movement elements and 41.35 % of long-duration movement elements. Furthermore, the mean and standard deviation percentages of the short- and long-duration sets across subjects with HD were 52.11 ± 11.30 % and 47.89 ± 11.30 %, respectively. Those for subjects with PD were 53.55 ± 15.40 % and 46.45 ± 15.40 %. In addition, the durations of movement elements in the short- and long-duration sets of HD chorea were 0.12 ± 0.05 s and 0.48 ± 0.27 s, respectively. The durations of movement elements in the short- and long-duration sets of PD LID were 0.13 ± 0.06 s and 0.46 ± 0.25 s, respectively. These results show that the majority of movement elements generated by HD chorea and LID have a relatively short duration.
TABLE I.
Statistics of the short-duration set and long-duration set from HD chorea and LID
| HD Chorea | LID | |||
|---|---|---|---|---|
| Short Set | Long Set | Short Set | Long Set | |
| Percentage (%) | ||||
|
| ||||
| All MEs | 53.98 | 46.02 | 58.65 | 41.35 |
|
| ||||
| Across Subjects | 52.11±11.30 | 47.89±11.30 | 53.55±15.40 | 46.45±15.40 |
|
| ||||
| Slope | ||||
|
| ||||
| All MEs | 0.95 | 0.87 | 1.03 | 0.87 |
|
| ||||
| Across Subjects | 0.88±0.06 | 0.74±0.07 | 0.94±0.11 | 0.76±0.10 |
ME: Movement Element. All MEs: slopes were computed using MEs from all subjects in each subset. Across Subjects: slopes were computed using MEs from a single subject in each subset.
Mean and standard deviation of slopes across subjects were reported.
Movement elements in the short-duration and long-duration sets of HD chorea exhibited a log-linear slope of 0.95 and 0.87 respectively, which were obtained using least-square linear fitting. Similarly, the slope of the short-duration set of LID was 1.03, and that of the long-duration set was 0.87. The mean and standard deviation of the slopes of the short- and long-duration sets across HD subjects were 0.88 ± 0.06 and 0.74 ± 0.07, respectively. Those for the LID were 0.94 ± 0.11 and 0.76 ± 0.10 across PD subjects. As previously discussed in Section II-D, these slopes are unique to the involuntary movements investigated in this study whereas prior studies on voluntary upper-limb movements reported a slope of nearly 2/3 [22], [24], [26].
B. Results of Supervised Classification
Fig 5a shows the ROC curve of the proposed classification model for all trials of the motor task, which yielded an AUC-ROC of 0.94. Fig. 5b corresponds to the confusion matrix at the operating point highlighted with a yellow dot in Fig. 5a, where we obtained an F1-score of 0.90. We also aggregated the classification results for each subject using majority voting, which yielded an AUC-ROC of 1.00 and F1-score of 0.96. These indicate that kinematics of HD chorea and LID contain unique features that can correctly recognize the two classes. In order to identify important features that contribute to the successful classification model—hence, improving our understanding of kinematic differences between LID and chorea—we examined the most frequently selected features across the iterations of the outer LOSOCV. A total of 17 different features were selected at least once throughout the iterations. In this section, we present and discuss the two most important features based on their selection frequency (i.e., features that were selected more than 80 % throughout the iterations). Fig. 7 shows boxplots of these two features between HD chorea vs LID, where both features showed statistically significant differences: p = 1.13 × e−9 for the first feature and p = 1.02 × e−8 for the second feature (Mann-Whitney U-test).
Fig. 5.

(a) The ROC curve and (b) confusion matrix of the trained classification model using features from short-duration set, long-duration set and all movement elements on a per-trial level.
Fig. 7.

Boxplots of the most selected features for differentiation between chorea and LID. The asterisks suggest significant statistical difference (p < 0.05) between HD and PD groups. Abbreviation: Iqr.—interquartile range; ME—movment element; Std. Dev.—standard deviation; Dist.—distance.
As previously discussed in Section II-E, we extracted features from three different sets of movement elements: 1) short-duration set, 2) long-duration set, and 3) entire set. However, Fig. 7 shows that the most important features were derived only from the entire set and the long-duration set. To investigate which sets contained the most relevant information related to kinematic differences between HD chorea and LID, we trained different supervised classification models using features extracted from different combinations of the three sets, as summarized in Table II. Our analysis shows that the model trained on features extracted from the long-duration set and the entire set (row #6 in Table II) produced the best classification performance, which corroborates our findings in Fig. 7. Furthermore, the model trained only on features extracted from the short-duration set performed significantly worse than all other models. These results collectively indicate that the long-duration set contains the most relevant information related to kinematic differences between HD chorea and LID.
TABLE II.
Classification Results using Features Extracted from Different Subsets, Per-Trial Level
| Features Set | AUC-ROC | F1 Score |
|---|---|---|
| Features from subsets 1) | 0.76 | 0.73 |
| Features from subsets 2) | 0.92 | 0.85 |
| Features from set 3) | 0.90 | 0.84 |
| Features from subsets 1) and 2) | 0.94 | 0.90 |
| Features from subsets 1) and 3) | 0.90 | 0.86 |
| Features from subsets 2) and 3) | 0.95 | 0.93 |
| Features from subsets 1), 2), and 3) | 0.94 | 0.90 |
The short-duration subset
The long-duration subset
The set of all movement elements.
IV. Discussion
In this paper, we proposed a data-driven approach to identify kinematic characteristics contributing to differentiating two different etiologies of involuntary choreic movements: HD chorea and PD LID. We employed a unique movement decomposition technique that segments 3D upper-limb involuntary movement into 1D movement elements [22]. This approach was initially developed in healthy individuals performing a variety of voluntary motor tasks [22] and successfully extended for the assessment of voluntary movement impairments in stroke survivors [24], [25] and individuals with ataxia [26]. However, it was unclear whether involuntary choreic movements could be decomposed in this manner. The study herein clearly demonstrates that choreic movements, both HD chorea and LID, can be decomposed using the movement element approach, further supporting the theory that they are the involuntary release of motor patterns generated in upstream cortical areas [27]. This is of importance since HD chorea and LID stem from different basal ganglia network dysfunctions. Movement elements from involuntary choreic movements exhibited two visually-identifiable subsets in the – D space, rather than the unique cluster along the slope of 2/3 that was observed in voluntary movements [22], [24], [26]. Although identifying the neuropathological substrates that contribute to the distinguishable movement element duration differences in HD chorea and LID is beyond the scope of the current work, we believed that important information was embedded within the two visually distinguishable subsets, particularly the long-duration set, to aid in the classification between the two types of involuntary choreic movements.
Using spatiotemporal features extracted from movement elements and a linear SVM classification model, our proposed method achieved an AUC-ROC of 1.00 and F1-score of 0.96. One previous study aimed to directly differentiate HD chorea from LID using human raters and patient video recordings [16]. Eighteen subjects (seven subjects with LID and eleven subjects with HD chorea) were videotaped while performing a one-minute task in a sitting position. Without any prior information about the subjects, two trained movement disorders neurologists were asked to classify patients only based on the video recordings. The F1-score for the first rater was 0.77 while the second rater could not classify if the patients had HD chorea or LID at all. The accuracy of our method to differentiate HD chorea from LID far exceeds the highly trained human raters’ performances. This supports that our proposed approach was able to accurately identify the distinct kinematic characteristics of the two involuntary movements that are difficult to capture via visual inspection.
The two most important distinctive features between HD chorea and LID were related to the variability in movement elements: 1) the mean of the interquartile range of all movement elements and 2) the standard deviation of the log-transformed traveled distance. Both features are associated with the magnitude of involuntary movements at the hand, where its variability was higher for HD chorea than for LID (see Fig. 7). This provides additional support to previous work showing that HD chorea is a more variable choreic movement than PD LID in the whole-body [30], [43] and leg [16]. This may be related to the distinct basal ganglia pathophysiology of HD chorea and PD LID. Chorea is believed to be related to the degeneration of neurons from the indirect pathway of the basal ganglia, which reduces the ability of this pathway to inhibit unwanted movement patterns [27]. On the other hand, PD LID is thought to result from hypersensitivity of D1 receptors involved in the direct pathway [18], [44], [45], which leads to an excessive release of movement patterns. It is possible that the integrity of the indirect pathway is necessary to stabilize the involuntary motor output and reduce the variability of the motor output, although future work would be needed to confirm this.
Although the proposed study herein only focuses on HD chorea and PD LID, we believe this is the first step towards identifying multiple other etiologies because our results support that the movement decomposition method can capture insightful, unique kinematic characteristics of the two most similar involuntary choreic movements [14]. This could lead to the improved understanding of the altered motor patterns and outputs associated with different neurological conditions and provide novel information regarding their pathophysiology. As seen here, we were able to demonstrate that HD chorea and LID are not merely noise within the motor system but actually the involuntary release of voluntary motor patterns. Furthermore, we believe that, in future work, our method could be implemented using wrist-worn IMU devices rather than costly motion capture systems. The small number of body joints involved in the study and the simplicity of the motor task would allow for a quick evaluation using IMUs and require minimal training from staff. In rural and underserved areas, where specialized movement disorders neurologists are scarce, clinicians could ask patients to don a set of IMUs and perform a few repetitions of the task. A simple software could then identify the likely etiology of the choreic movements and enable the clinician to devise an appropriate treatment plan. This has great potential to improve the patient management process and enable timely and personalized treatment.
One limitation of our work is the small and imbalanced number of subjects used in the experiment. However, we employed the LOSOCV technique during model training and evaluation, which is widely adopted for relatively small datasets to minimize the chance for overfitting and improve the generalizability of the model [37]. In addition, we employed a cost-sensitive classifier to manage the imbalanced dataset. The age difference between PD and HD subjects in the study is noticeable. While there is no available evidence showing that age has an impact on the kinematic characteristics of involuntary choreic movements, future studies should include age-matched subjects to examine the potential impact of this issue on the performance of our approach. Another limitation of the study is that only two chorea etiologies were included (HD chorea and PD LID). As mentioned, other disorders may lead to choreic movements and need to be taken into account by clinicians. Future studies should aim to include other chorea etiologies in our model.
V. Conclusion
In this paper, we proposed a kinematic data-driven approach to identify the kinematic characteristics of two choreic involuntary movements: HD chorea and PD LID. A unique decomposition technique was applied to segment 3D upper-limb movement into 1D point-to-point movement elements that captured kinematic and morphological characteristics of involuntary movement. A combination of unsupervised and supervised machine learning algorithms was employed to classify between HD chorea and LID. Experiment results demonstrated the feasibility of designing tools for the identification of choreic movements across different disorder. We believe that these findings can be leveraged to explore characteristic of various types of involuntary movement and better understand their pathophysiology.
Fig. 6.

(a) The ROC curve and (b) confusion matrix when the classification results of multiple motor tasks are aggregated on a per-subject level using majority voting.
Acknowledgments
This work was supported in part by the National Institute of Neurological Disorders and Stroke of the National Institutes of Health under Award Number R15NS109741
Contributor Information
Yunda Liu, College of Information and Computer Sciences, University of Massachusetts, Amherst, MA, USA.
Brandon Oubre, College of Information and Computer Sciences, University of Massachusetts, Amherst, MA, USA.
Christian Duval, Département des Sciences de l’Activité Physique, Université du Québec à Montréal, Montréal, QC, Canada.
Sunghoon Ivan Lee, College of Information and Computer Sciences, University of Massachusetts, Amherst, MA, USA.
Jean-Francois Daneault, Department of Rehabilitation and Movement Sciences, Rutgers University, Newark, NJ, USA.
References
- [1].Sanger TD et al. “Definition and classification of hyperkinetic movements in childhood,” Movement Disorders, vol. 25, no. 11, pp. 1538–1549, 2010. [DOI] [PMC free article] [PubMed] [Google Scholar]
- [2].Hawley JS and Weiner WJ, “Hemiballismus: current concepts and review,” Parkinsonism & Related Disorders, vol. 18, no. 2, pp. 125–129, 2012. [DOI] [PubMed] [Google Scholar]
- [3].Abdo WF et al. “The clinical approach to movement disorders,” Nature Rev. Neurology, vol. 6, no. 1, pp. 29–37, 2010. [DOI] [PubMed] [Google Scholar]
- [4].Lin CC et al. “Geographic variation in neurologist density and neurologic care in the united states,” Neurology, vol. 96, no. 3, pp. e309–e321, 2021. [DOI] [PMC free article] [PubMed] [Google Scholar]
- [5].Bakstein E et al. “Parkinsonian tremor identification with multiple local field potential feature classification,” J. of Neuroscience Methods, vol. 209, no. 2, pp. 320–330, 2012. [DOI] [PubMed] [Google Scholar]
- [6].Camara C et al. “Resting tremor classification and detection in parkinson’s disease patients,” Biomed. Signal Process. and Control, vol. 16, pp. 88–97, 2015. [Google Scholar]
- [7].Woods AM et al. “Parkinson’s disease and essential tremor classification on mobile device,” Pervasive and Mobile Comput, vol. 13, pp. 1–12, 2014. [Google Scholar]
- [8].Mink JW, “Movement disorders ii,” Egyptian Pediatric Yahoo Group, vol. 31, no. 7, p. 287, 2010. [Google Scholar]
- [9].Nakawah MO and Lai EC, “Post-stroke dyskinesias,” Neuropsychiatric Disease and Treatment, vol. 12, p. 2885, 2016. [DOI] [PMC free article] [PubMed] [Google Scholar]
- [10].Piccolo I et al. “Chorea as a symptom of neuroborreliosis: a case study,” The Italian J. of Neurological Sci, vol. 19, no. 4, pp. 235–239, 1998. [DOI] [PubMed] [Google Scholar]
- [11].Mehanna R and Jankovic J, “Movement disorders in multiple sclerosis and other demyelinating diseases,” J. of the Neurological Sci, vol. 328, no. 1-2, pp. 1–8, 2013. [DOI] [PubMed] [Google Scholar]
- [12].Galanaud D et al. “Brain MRI in patients with past lupus-associated chorea,” Stroke, vol. 31, no. 12, pp. 3079–3083, 2000. [DOI] [PubMed] [Google Scholar]
- [13].Snyder RD, “The involuntary movements of chronic mercury poisoning,” Arch. of Neurology, vol. 26, no. 4, pp. 379–381, 1972. [DOI] [PubMed] [Google Scholar]
- [14].Mann RK et al. “Comparing movement patterns associated with Huntington’s chorea and Parkinson’s dyskinesia,” Exp. Brain Res, vol. 218, no. 4, pp. 639–654, 2012. [DOI] [PubMed] [Google Scholar]
- [15].Bhidayasiri R and Truong DD, “Chorea and related disorders,” Postgraduate Med. J, vol. 80, no. 947, pp. 527–534, 2004. [DOI] [PMC free article] [PubMed] [Google Scholar]
- [16].Hoff JI, “Ambulatory accelerometry in parkinson’s disease”. Ph.D. dissertation, Leiden Univ., 2005. [Google Scholar]
- [17].Carta A et al. “Different responsiveness of striatonigral and striatopallidal neurons to l-dopa after a subchronic intermittent l-dopa treatment,” Eur. J. of Neuroscience, vol. 21, no. 5, pp. 1196–1204, 2005. [DOI] [PubMed] [Google Scholar]
- [18].Cenci MA, “Dopamine dysregulation of movement control in l-dopa-induced dyskinesia,” Trends in Neurosciences, vol. 30, no. 5, pp. 236–243, 2007. [DOI] [PubMed] [Google Scholar]
- [19].Feinstein E and Walker R, “An update on the treatment of chorea,” Current Treatment Options in Neurology, vol. 20, no. 10, pp. 1–15, 2018. [DOI] [PubMed] [Google Scholar]
- [20].Bezard E et al. “Pathophysiology of levodopa-induced dyskinesia: potential for new therapies,” Nature Rev. Neuroscience, vol. 2, no. 8, pp. 577–588, 2001. [DOI] [PubMed] [Google Scholar]
- [21].Reuter I et al. “Late onset levodopa responsive Huntington’s disease with minimal chorea masquerading as Parkinson plus syndrome,” J. of Neurology, Neurosurgery & Psychiatry, vol. 68, no. 2, pp. 238–241, 2000. [DOI] [PMC free article] [PubMed] [Google Scholar]
- [22].Miranda JGV et al. “Complex upper-limb movements are generated by combining motor primitives that scale with the movement size,” Scientific Rep, vol. 8, no. 1, pp. 1–11, 2018. [DOI] [PMC free article] [PubMed] [Google Scholar]
- [23].de Lemos Fonseca M et al. “Motor skill acquisition during a balance task as a process of optimization of motor primitives,” Eur. J. Neurosci, 2020. [DOI] [PubMed] [Google Scholar]
- [24].Oubre B et al. “Estimating upper-limb impairment level in stroke survivors using wearable inertial sensors and a minimally-burdensome motor task,” IEEE Trans. on Neural Syst. and Rehabil. Eng, 2020. [DOI] [PubMed] [Google Scholar]
- [25].Datta S et al. “Upper limb movement profiles during spontaneous motion in acute stroke,” Physiological measurement, vol. 42, no. 4, p. 045005, 2021. [DOI] [PubMed] [Google Scholar]
- [26].Oubre B et al. “Decomposition of reaching movements enables detection and measurement of ataxia,” The Cerebellum, vol. 20, no. 6, pp. 811–822, 2021. [DOI] [PMC free article] [PubMed] [Google Scholar]
- [27].Mink JW, “The basal ganglia and involuntary movements: impaired inhibition of competing motor patterns,” Arch. of Neurology, vol. 60, no. 10, pp. 1365–1368, 2003. [DOI] [PubMed] [Google Scholar]
- [28].Ghassemi M et al. “Bradykinesia in patients with parkinson’s disease having levodopa-induced dyskinesias,” Brain Res. Bull, vol. 69, no. 5, pp. 512–518, 2006. [DOI] [PubMed] [Google Scholar]
- [29].Fenney A et al. “Bradykinesia is not a “systematic” feature of adult-onset huntington’s disease; implications for basal ganglia pathophysiology,” Brain Res, vol. 1193, pp. 67–75, 2008 [DOI] [PubMed] [Google Scholar]
- [30].Fenney A et al. “Short-term variability in amplitude and motor topography of whole-body involuntary movements in parkinson’s disease dyskinesias and in huntington’s chorea,” Clin. Neurology and Neurosurgery, vol. 110, no. 2, pp. 160–167, 2008. [DOI] [PubMed] [Google Scholar]
- [31].Leversen JS et al. “From children to adults: motor performance across the life-span,” PloS one, vol. 7, no. 6, p. e38830, 2012. [DOI] [PMC free article] [PubMed] [Google Scholar]
- [32].Toosizadeh N et al. “Motor performance assessment in parkinson’s disease: association between objective in-clinic, objective in-home, and subjective/semi-objective measures,” PloS one, vol. 10, no. 4, p. e0124763, 2015. [DOI] [PMC free article] [PubMed] [Google Scholar]
- [33].Mazzoni P et al. “Motor control abnormalities in parkinson’s disease,” Cold Spring Harbor perspectives in medicine, vol. 2, no. 6, p. a009282, 2012. [DOI] [PMC free article] [PubMed] [Google Scholar]
- [34].Smith MA et al. “Motor disorder in huntington’s disease begins as a dysfunction in error feedback control,” Nature, vol. 403, no. 6769, pp. 544–549, 2000. [DOI] [PMC free article] [PubMed] [Google Scholar]
- [35].Martínez-Martín P et al. “Unified parkinson’s disease rating scale characteristics and structure,” Movement Disorders, vol. 9, no. 1, pp. 76–83, 1994. [DOI] [PubMed] [Google Scholar]
- [36].Lee SI et al. “Towards the ambulatory assessment of movement quality in stroke survivors using a wrist-worn inertial sensor,” in 2018 40th Annu. Int. Conf. of the IEEE Eng. in Medicine and Biol. Soc. IEEE, 2018, pp. 2825–2828. [DOI] [PubMed] [Google Scholar]
- [37].Hastie T et al. The elements of statistical learning: data mining, inference, and prediction. New York: Springer, 2009. [Google Scholar]
- [38].Wold S et al. “Principal component analysis,” Chemometrics and Intelligent Laboratory Syst., vol. 2, no. 1-3, pp. 37–52, 1987. [Google Scholar]
- [39].Peng B et al. “Normalizing a large number of quantitative traits using empirical normal quantile transformation,” in BMC Proc., vol. 1, no. 1. BioMed Central, 2007, pp. 1–5. [DOI] [PMC free article] [PubMed] [Google Scholar]
- [40].Ogino M and Mitsukura Y, “Portable drowsiness detection through use of a prefrontal single-channel electroencephalogram,” Sensors, vol. 18, no. 12, p. 4477, 2018. [DOI] [PMC free article] [PubMed] [Google Scholar]
- [41].Saeys Y et al. “A review of feature selection techniques in bioinformatics,” bioinformatics, vol. 23, no. 19, pp. 2507–2517, 2007. [DOI] [PubMed] [Google Scholar]
- [42].Raudys SJ et al. “Small sample size effects in statistical pattern recognition: Recommendations for practitioners,” IEEE Transactions on pattern analysis and machine intelligence, vol. 13, no. 3, pp. 252–264, 1991. [Google Scholar]
- [43].Gour J et al. “Movement patterns of peak-dose levodopa-induced dyskinesias in patients with parkinson’s disease,” Brain Res. Bull, vol. 74, no. 1-3, pp. 66–74, 2007. [DOI] [PubMed] [Google Scholar]
- [44].Aubert I et al. “Increased d1 dopamine receptor signaling in levodopa-induced dyskinesia,” Ann. of Neurology: Official J. of the Amer. Neurological Assoc. and the Child Neurology Soc, vol. 57, no. 1, pp. 17–26, 2005. [DOI] [PubMed] [Google Scholar]
- [45].Olanow CW et al. “Continuous dopamine-receptor treatment of parkinson’s disease: scientific rationale and clinical implications,” The Lancet Neurology, vol. 5, no. 8, pp. 677–687, 2006. [DOI] [PubMed] [Google Scholar]