

Abstract
Purpose:
This study examined dietary indicators, sedentary time, and physical activity as potential mediators of the association between TV time and BMIz in youth.
Design:
Cross-sectional study in 2 independent samples of youth.
Setting:
Data collection occurred by mail and telephone for adolescents and either at home or in medical settings for children.
Sample:
928 youth ages 12–16 and 756 youth ages 6–12 and a parent.
Measures:
TV time, snacking/eating while watching TV, and a 3-day dietary recall were assessed via child/parent report. Physical activity and sedentary time were assessed by accelerometer wear.
Analysis:
Direct and indirect associations (through 8 diet and activity variables) of TV time with BMIz were tested in boys and girls in each sample.
Results:
TV time had a positive association with BMIz in 6–12 year old boys and girls. Direct associations emerged between TV time and the diet/activity variables, and between diet/activity variables and BMIz. Snacking/eating while watching TV had a significant positive association with BMIz in younger boys and mediated the association between TV time and BMIz (β = .06, p = .019; 25% attenuation).
Conclusions:
Snacking/eating while watching TV may be a possible reason TV time is consistently associated with obesity in youth. Targeting reductions in TV time and associated snacking could improve health impacts.
Keywords: sedentary time, physical activity, diet, youth, television, BMI, weight, diet, snacking
Purpose
Youth continue to exceed recommendations for screen-based sedentary behaviors, especially watching television.1–3 The time young people spent watching television (TV time) has been consistently associated with higher weight status,4,5 more so than other types of screen time6 or than accelerometer-assessed sedentary time.5,7 TV time has also been associated with higher BMI and obesity-related health conditions longitudinally into adulthood.8
The association between TV time and weight status has been observed in multiple age groups, with some studies focusing on subgroups of youth ages,9,10 and others with wider age ranges.6,11 However, given the inconsistency of age groups examined in previous studies, it remains to be determined whether associations of TV time with weight status differ by youth age group (i.e., younger children vs. adolescents). Such information could inform whether age-specific screen time recommendations are needed.12 Additionally, some findings from a systematic review covering children ages 2–19 suggest that the association of sedentary behavior with BMI may be stronger for boys than girls.13 A recent review of videogaming in relation to obesity found some evidence that increased screen time in 10–18 year old boys (i.e., 2–5 hours per day, including videogames) indicated higher likelihood of being affected by overweight or obese weight status.14 Another group conducted a systematic review and meta-analysis of eating while watching TV in relation to obesity and found no significant sex differences in studies of youth ages 2–19.15 Still, there was high methodological variability in the studies included in this review and it appears that relatively few have examined these associations by sex. Therefore, it is justified to investigate these associations in both youth of elementary school age and older, as well as examine differences in boys and girls.
There have been several investigations of factors that may be associated with, or account for, the consistent association between TV time and child weight status.5,16 The association between TV time and weight status may be accounted for by lack of physical activity and/or high amounts of sedentary time, as TV time typically involves long periods of sedentary time and has been negatively associated with physical activity.13 There is also evidence the association may be accounted for by dietary behavior, as increased television watching has been linked to increased calorie consumption (i.e., snacking), particularly in youth.17–19 Additionally, viewing television commercials that advertise high-calorie, low-nutrient palatable food products has been associated with high fat and high carbohydrate food choices in children.20 One study in adults examined the respective roles of TV-related food and beverage consumption and physical activity displacement on the association between TV viewing and BMI. Results indicated that TV viewing appeared to be a risk factor for higher weight status, but neither of the 2 proposed explanations were significant mediators of this association.21
Despite the plausibility of diet, sedentary time, and physical inactivity being factors related to the TV time – BMI association, very few studies, if any, have examined all 3 potential pathways among youth. The present study examined dietary indicators, sedentary time, and physical activity as potential mediators of the association between TV time and BMI in 2 independent samples of youth (6–12 year olds and 12–16 year olds).
Methods
Design and Sample
This was a cross-sectional study in 2 independent samples of youth. Participant data from 2 age groups were analyzed. In the first study, 928 adolescents ages 12–16 (M age = 14.1, 65.8% white, non-Hispanic) were recruited from the Baltimore, Maryland and Seattle/King County, Washington regions from 2009–2011 as part of the Teen Environment and Neighborhood (TEAN) observational study.22 The second study sample consisted of 756 children ages 6–12, (M age = 9.04, 65.5% white, non-Hispanic) and their parents, from the Neighborhood Impact on Kids (NIK) study23,24 in the Seattle/King County, Washington and San Diego, California metropolitan areas from 2007–2009 during the academic year. Participants were selected from census block groups representing high or low walkability and high or low income. Overall participation rate did not vary by neighborhood walkability or income. This study was approved by the sponsoring institution’s human subjects’ protection committees.
Procedures
For both samples, these analyses use baseline survey data and weight, and activity and dietary data collected soon after completion of baseline surveys. In the adolescent sample (TEAN), participants were enrolled via parent consent and assent by mail and a phone call with a member of the research team. Once enrolled, participants were mailed an accelerometer to wear for 7 days with instructions to mail it back to the research team. Adolescent and parent participants were given the option to complete study questionnaires via mail or online. Participants were also instructed to complete three 24-hour dietary recalls on 3 unannounced, random, non-consecutive days, and all data was collected during the academic school year.
In the child sample (NIK), participant dyads were enrolled at an initial study visit either at their home or at a medical setting, depending on their preference. Research staff measured each child’s height and weight. Families were provided an accelerometer and instructions for the child to wear the device for 7 consecutive days. Parents were given the option to complete the study questionnaires in paper or online format. Parent-child dyads were also instructed to complete three 24-hour dietary recalls over the phone within 3 weeks following enrollment.
Measures
Demographic information.
Demographic information was collected via survey from both samples, including youths’ age, gender, race, ethnicity, parents’ marital status, family income, and parents’ highest level of education.
Objective measure of MVPA and sedentary time.
In both samples, youth participants wore an ActiGraph accelerometer on a belt at their left iliac crest during waking hours to measure moderate-to vigorous physical activity (MVPA) and sedentary time. Groups of >40 sequential 30-second epochs (i.e., 20 minutes) with count = 0 were considered non-wear, which was excluded from the data.25 Only weekdays with ≥10 hours and weekend days with ≥8 hours of valid wear time, and only participants with ≥3 valid days were included in the analyses, which has been shown to be appropriate for capturing physical activity in field based studies.26,27 For the adolescent participants, multiple ActiGraph models were used (7164, 85.2%; 71256, 5.1%; GT1 M, 7.2%; GT3X, 2.5%). Model type was not associated with MVPA. For the child participants, GT1 M ActiGraphs were used. The adolescent sample had 94.8% of accelerometer data complete and the child sample had 95.8% of accelerometer data complete.
MVPA minutes/day was scored using the Evenson cut point (divided by 2 to account for the 30-second epochs) applied to the vertical axis acceleration counts, which has been shown to have excellent classification accuracy for measuring physical activity in youth.28 The commonly used <100 counts/minute cut point was used to derive sedentary time.28–30
Television time.
Adolescent participants and parents of child participants (reporting for their child) provided survey reports of how much time the child/adolescent spent watching television, videos, or DVDs on a typical weekday during non-school time. Response options included None, 15 minutes per day, 30 minutes per day, 1 hour per day, 2 hours per day, 3 hours per day, and 4 or more hours per day. Past studies using similar measures for time spent watching television have found good test-retest reliability and construct validity through associations with the home sedentary environment and other psychosocial variables.31,32
Eating while watching TV.
Adolescent participants and parents of child participants reported on the frequency of snacking while watching television. The question was “I snack while watching TV” for adolescents and “How often does your child eat while watching TV” in for children. Response options for both were coded 0–4. For adolescents, the response options were Never or Almost Never, < 1 x week, 1–2 x week, 3–4 x week, and 5 or more x week. For children, the response options were Never, Rarely, Sometimes, Often, and Always. The adolescent sample had 100% of this survey data complete and the child sample had 95.9% of survey data complete.
Dietary recall.
Participants in both samples completed dietary recalls within 3 weeks after enrollment. The majority of participants (93.6% in adolescents, 95.6% in children) reported on 3 days for the dietary recall (2 weekdays and 1 weekend day), which were conducted with trained interviewers from the research team over the phone, using the Minnesota Nutrient Data Systems for Research (NDSR) software 2.92 (2010), 4-stage, multiple-pass method. The interviewers called participants unannounced on random, non-consecutive days within 3 weeks of enrollment, during the academic school year to collect the dietary recalls. For children younger than 8 years old, telephone dietary recalls were reported by parents and children jointly33 and for children 8–12 years old parents provided assistance. Adolescents were contacted directly to complete the dietary recalls over the telephone. The multiple-pass dietary recall approach assisted with 2-D portion aides has been validated against the doubly labeled water measurement of energy intake in youth and provided reasonably accurate estimates of energy and nutrient intake.34,35
Use of the NDSR software was used to analyze food recalls for daily caloric intake, food group servings, and nutrient content across recall days. Several food group variables were created from NDSR output files as indicators of dietary quality and have been previously described:24 sweet/savory snack servings per day high calorie beverage servings per day, fruit and vegetable servings per day, and a dietary quality index score based on the Dietary Approached to Stop Hypertension (DASH) Eating Plan.36,37 The DASH index score (range 0–80; low to high diet quality) was calculated from daily food group servings.37 DASH score measures adherence to the DASH dietary pattern, which is a diet pattern that reflects high diet quality based on the Dietary Guidelines for Americans. Previous findings indicate that DASH score was inversely associated with weight status in children.38
Anthropometrics.
Parents and adolescents were both provided detailed instructions to measure and self-report their height and weight without shoes at the beginning of the day in the adolescent sample. The research team also provided a 180 cm fabric tape measure and instructed parents to measure the adolescent’s height. Multiple past studies have validated these methods. For example, intraclass correlation coefficients (ICCs) for reported vs. actual weight ranged from .85 to .98 and height ranged from .57 to .91.39 Another study that used these methods found them to correctly classify weight status of 96% of adolescents.40,41 In children, height and weight were measured by trained study staff during a study visit, using a digital scale and stadiometer.24 BMIz and BMI percentile were calculated for both samples using algorithms specified by the CDC and corresponding thresholds were used to classify participants as overweight or obese.42
Analysis
Mediation models were run in Mplus software to test direct and indirect associations (through the diet, sedentary time, and activity variables) of TV time on BMIz in each sample separately, as well as male and female participants separately. Full information maximum likelihood was used for parameter estimates to account for missing information. Missing data was <6.5% for all variables. Using accepted guidelines for multiple mediation models,43 the following mediators (2 activity and 6 diet) were tested: MVPA minutes per day, sedentary minutes per day, DASH score, sweet/savory snack intake, high calorie beverage intake, fruit/vegetable intake, total daily energy intake (i.e., calories divided by 100), and snacking/eating while watching television. The a path for each respective model was the proposed mediator regressed on TV time; the b path for each model was BMIz regressed on each proposed mediator variable; the c path for each model was BMIz regressed on TV time. The indirect effect (ab) was the indirect effect of TV time on BMIz via each proposed mediator, respectively. All models were adjusted for participant age, ethnicity, education, marital status, study site, neighborhood income, and study design variables. Standardized regression coefficients are presented.
Results
Sample characteristics are presented in Tables 1 and 2. In the adolescent sample, girls had an average BMIz of 0.42 (SD = 0.93) and boys had an average BMIz of 0.49 (SD = 1.08). In the child sample, girls had an average BMIz of 0.37 (SD = 0.99) and boys had an average BMIz of 0.53 (SD = 0.95).
Table 1.
Demographic Information and Descriptive Statistics of Study Variables.
| TEAN sample (n = 887–928) M (SD) or N (%) | NIK sample (n = 707–756) M (SD) or N (%) | |
|---|---|---|
| Child age range | 12–16 y/o | 6–12 y/o |
| Child age | 14.1 (1.40) | 9.04 (1.56) |
| Child gender | ||
| Male | 460 (49.6%) | 378 (50.0%) |
| Female | 468 (50.4%) | 378 (50.0%) |
| Child race/ethnicity | ||
| White, non-Hispanic | 611 (66.3%) | 495 (68.0%) |
| Hispanic | 310 (33.7%) | 233 (32.0%) |
| Parent’s Marital Status | ||
| Married/Living with Partner | 774 (83.9%) | 667 (93%) |
| Not Married/Living with Partner | 148 (16.1%) | 50 (7.0%) |
| Family Income | ||
| <10 K – 49K | 123 (13.8%) | 97 (12.8%) |
| 50 K – 99K | 365 (41.1%) | 261 (34.5%) |
| >100K | 399 (45.0%) | 349 (46.2%) |
| Parent’s Education | ||
| At least some post-secondary education | 695 (75.4%) | 670 (93.6%) |
| No post-secondary education | 227 (24.6%) | 46 (6.4%) |
| Child weight status | ||
| BMI percentile | 63.80 (26.89) | 62.63 (27.17) |
| Overweight | 151 (16.3%) | 117 (15.5%) |
| Obese | 106 (11.4%) | 90 (11.9%) |
Note. Sample size ranges are provided as some demographic information was not reported.
Table 2.
Descriptive Statistics of Study Variables.
| TEAN sample (n = 913–928) | NIK sample (n = 686–756) | |||||
|---|---|---|---|---|---|---|
| M (SD) or % | M (SD) or % | |||||
| Total | Boys (n = 457–460) | Girls (n = 456–468) | Total | Boys (n = 346–378) | Girls (n = 340–378) | |
| Activity Variables | ||||||
| Wear time minutes/day | 818.07 (78.86) | 822.306 (77.51) | 813.85 (80.04) | 677.05 (62.97) | 668.76 (63.52) | 685.43 (61.36) |
| MVPA minutes/day | 38.97 (20.35) | 46.01 (21.09) | 31.96 (16.91) | 46.71 (21.43) | 53.63 (22.77) | 39.72 (17.41) |
| Sedentary time minutes/day | 535.13 (87.54) | 521.58 (88.43) | 548.62 (84.60) | 397.83 (71.364) | 393.79 (75.51) | 401.91 (66.77) |
| Sedentary time proportion of day | 65.41% | 63.43% | 67.41% | 58.76% | 58.83% | 58.63% |
| Daily Dietary Variables | ||||||
| DASH score [potential range: 0–80] | 38.12 (7.96) | 37.54 (7.51) | 38.69 (8.40) | 41.43 (7.14) | 41.02 (6.92) | 41.84 (7.34) |
| Sweet/savory snacks | 2.60 (2.10) | 2.62 (2.17) | 2.59 (2.03) | 2.32 (1.52) | 2.43 (1.56) | 2.21 (1.47) |
| High calorie beverages | 1.02 (1.24) | 1.21 (1.44) | .83 (.96) | .58 (.68) | .65 (.72) | .51 (.63) |
| Fruits/vegetables servings | 4.19 (2.63) | 4.08 (2.55) | 4.29 (2.70) | 3.43 (1.97) | 3.45 (2.02) | 3.41 (1.93) |
| Energy intake (calories) | 1971.72 (649.75) | 2158.76 (674.76) | 1786.32 (566.63 | 1743.84 (411.40) | 1857.56 (409.76) | 1630.73 (381.21) |
| Snacking/eating while watching TV [potential range 0–4] | 1.09 (1.20) | .97 (1.12) | 1.21 (1.21) | 1.51 (0.91) | 1.44 (.91) | 1.58 (.91) |
| Daily TV time | 85.74 (73.82) | 92.12 (74.19) | 79.46 (72.99) | 71.35 (51.80) | 69.07 (50.65) | 73.69 (52.92) |
| BMIz | .46 (1.01) | .49 (1.08) | .42 (.93) | .45 (.98) | .53 (.95) | .37 (.99) |
Note. MVPA = Moderate-to-Vigorous Physical Activity. BMI = Body Mass Index. BMIz = Body Mass Index z-score. Minutes of sedentary time adjusted for total wear time. Sample size ranges are provided as some participants were missing accelerometer data or dietary recall data. Snacking/eating while watching TV coded as 0: Never/Almost Never, 1: < 1 × week/Rarely, 2: 1–2 × week/Sometimes, 3: 3–4 × week/Often, 4: 5 or more × week/Always.
Associations of TV Time to Diet and Activity Variables
In adolescents, there were significant direct associations of TV time with DASH scores in both boys and girls, with more TV time related to lower diet quality (Table 3). There were significant positive associations of TV time with snacking/eating while watching TV for boys and girls. For boys, TV time had a significant positive association with high calorie beverage intake and a significant negative association with fruits/vegetables intake.
Table 3.
Associations of Television Time to Daily Diet and Activity Variables – TEAN (N = 928).
| TV time minutes/day (IV) | ||||||
|---|---|---|---|---|---|---|
| Boys | Girls | |||||
| DVs: | B (95% CI) | β | p value | B (95% CI) | β | p value |
| Total sedentary minutes | −.051 (−.141, .033) | −.04 | .252 | −.015 (−.090, .067) | −.01 | .711 |
| MVPA minutes | −.008 (−.036, .021) | −.03 | .595 | −.011 (−.034, .014) | −.05 | .366 |
| DASH score | −.024 (−.033, −.015) | −.23 | <.001 | −.012 (−.022, −.002) | −.11 | .016 |
| Energy intake (/100) | −.007 (−.016, .003) | −.07 | .165 | .000 (−.009, .008) | −.00 | .971 |
| Sweet/savory snacks | .002 (−.002, .005) | .06 | .306 | .000 (−.003, .003) | −.01 | .835 |
| High calorie beverages servings | .003 (.001, .005) | .16 | .003 | .001 (.000, .002) | .07 | .203 |
| Fruits/vegetables servings | −.008 (−.011, −.004) | −.22 | <.001 | −.003 (−.006, .001) | −.07 | .134 |
| Snacking/eating while watching TV | .004 (.002, .006) | .27 | <.001 | .004 (.003, .006) | .26 | <.001 |
Note. MVPA = Moderate-to-Vigorous Physical Activity. IV = Independent Variable. DV = Dependent Variable. Activity variables adjusted for total accelerometer wear time. All models were adjusted for participant age, ethnicity, education, marital status, study site, neighborhood income, and study design variables. Daily caloric intake was divided by 100 in order for results to be interpreted as change in the dependent variable per every 100 calories. Results presented were obtained from regression direct effects examined as part of mediational analysis.
In children, there were significant direct associations of TV time with DASH score in both boys and girls, with more TV time related to lower diet quality (Table 4). There were also significant positive associations of TV time with snacking/eating while watching TV for boys and girls, and significant negative associations of TV time with fruit/vegetable intake in boys and girls. In girls, TV time had a significant negative association with MVPA and a significant positive association with high calorie beverage intake. In boys, TV time had a significant negative association with sweet/savory snack intake and unexpectedly energy intake; for every 1 minute more of daily TV time, there was a 1 calorie less of energy intake intake.
Table 4.
Associations of Television Time to Daily Diet and Activity Variables – NIK (N = 756).
| TV time minutes/day (IV) | ||||||
|---|---|---|---|---|---|---|
| Boys | Girls | |||||
| DVs: | B (95% CI) | β | p value | B (95% CI) | β | p value |
| Total sedentary minutes | .134 (−.017, .283) | .09 | .081 | −.023 (−.153, .093) | .00 | .715 |
| MVPA minutes | −.039 (−.087, .004) | −.09 | .094 | −.037 (−.072, −.001) | −.11 | .042 |
| DASH score | −.048 (−.062, −.035) | −.36 | <.001 | −.039 (−.054, −.025) | −.29 | <.001 |
| Energy intake (energy/100) | −.010 (−.018, −.002) | −.12 | .015 | .002 (−.007, .012) | .03 | .631 |
| Sweet/savory snacks | −.004 (−.007, — .001) | −.12 | .018 | .000 (−.003, .003) | −.01 | .843 |
| High calorie beverages servings | .001 (.000, .002) | .08 | .156 | .002 (.000, .003) | .14 | .028 |
| Fruits/vegetables servings | −.009 (−.014, −.005) | −.24 | <.001 | −.007 (−.011, −.003) | −.20 | .001 |
| Snacking/eating while watching TV | .007 (.005, .008) | .38 | <.001 | .007 (.005, .009) | .41 | <.001 |
Note. MVPA = Moderate-to-Vigorous Physical Activity. IV = Independent Variable. DV = Dependent Variable. MVPA adjusted for total accelerometer wear time. All models were adjusted for participant age, ethnicity, education, marital status, study site, neighborhood income, and study design variables. Daily caloric intake was divided by 100 in order for results to be interpreted as change in the dependent variable per every 100 calories. Results presented were obtained from regression direct effects examined as part of mediational analysis.
Direct and Indirect Associations of TV Time and Diet/Activity Variables to BMIz
In adolescents, there was no association of TV time with BMIz in boys or girls (Table 5). There were significant negative association between sweet/savory snack intake and BMIz in boys and girls, and significant negative associations between energy intake and BMIz in boys and girls. For every 100 calories higher in energy intake, there was a .016 lower BMIz score for boys and a .025 lower BMIz score for girls. There was a significant negative association between MVPA and BMIz in boys, such that for every 10-minutes more of daily MVPA there was a 0.06 lower BMIz score. None of the diet or activity variables emerged as significant mediators of the association between TV time and BMIz among adolescents.
Table 5.
Direct and Indirect Associations of Daily Television Time With BMIz (TEAN) (N = 928).
| BMIz (DV) | ||||||
|---|---|---|---|---|---|---|
| Boys | Girls | |||||
| IVs/Mediators | B (95% CI) | β | p value | B (95% CI) | β | p value |
| TV time | .001 (.000, .003) | .08 | .128 | .001 (.000, .002) | .072 | .157 |
| MVPA minutes/day | −.006 (−.010, −.001) | −.11 | .012 | −.002 (−.007, .003) | −.043 | .364 |
| TV time (adjusted for MVPA) | .001 (.000, .003) | .08 | .138 | .001 (−.001,.002) | .070 | .176 |
| Mediation coefficient | .000 (.000, .000) | .00 | .614 | .000 (.000, .000) | .002 | .627 |
| Percent attenuation | ||||||
| Sedentary minutes/day | .001 (−.001,.002) | .06 | .391 | .001 (−.001,.002) | .06 | .415 |
| TV time (adjusted) | .001 (.000, .003) | .07 | .174 | .001 (.000, .002) | .07 | .198 |
| Mediation coefficient | .000 (.000, .000) | .00 | .566 | .000 (.000, .000) | .00 | .826 |
| Percent attenuation | ||||||
| DASH score | .005 (−.008, .019) | .03 | .509 | .002 (−.009, .013) | .02 | .728 |
| TV time (adjusted) | .001 (.000, .003) | .09 | .088 | .001 (.000, .002) | .07 | .152 |
| Mediation coefficient | .000 (.000, .000) | −.01 | .513 | .000 (.000, .000) | .00 | .755 |
| Percent attenuation | ||||||
| Sweet/savory snacks | −.055 (−.101, −.009) | −.11 | .019 | −.055 (−.099, −.015) | −.12 | .009 |
| TV time (adjusted) | .001 (.000, .003) | .09 | .100 | .001 (.000, .002) | .07 | .170 |
| Mediation coefficient | .000 (.000, .000) | .00 | .395 | .000 (.000, .000) | .00 | .846 |
| Percent attenuation | ||||||
| High calorie beverages | .009 (−.059, .075) | .01 | .792 | −.020 (−.113, .073) | −.02 | .678 |
| TV time (adjusted) | .001 (.000, .003) | .08 | .136 | .001 (.000, .002) | .07 | .160 |
| Mediation coefficient | .000 (.000, .000) | .00 | .800 | .000 (.000, .000) | .00 | .762 |
| Percent attenuation | ||||||
| Fruits/vegetables servings | −.007 (−.055, .037) | −.02 | .762 | −.001 (−.030, .030) | −.00 | .927 |
| TV time (adjusted) | .001 (.000, .003) | .08 | .159 | .001 (.000, .002) | .07 | .165 |
| Mediation coefficient | .000 (.000, .000) | .00 | .769 | .000 (.000, .000) | .00 | .939 |
| Percent attenuation | ||||||
| Energy intake (energy/100) | −.016 (−.032, −.001) | −.10 | .036 | −.025 (−.039, −.011) | −.16 | <.001 |
| TV time (adjusted) | .001 (.000, .003) | .07 | .165 | .001 (.000, .002) | .07 | .156 |
| Mediation coefficient | .000 (.000, .000) | .00 | .280 | .000 (.000, .000) | .00 | .972 |
| Percent attenuation | ||||||
| Snacking/eating while watching TV | .002 (−.082, .085) | .00 | .970 | −.008 (−.080, .064) | −.01 | .832 |
| TV time (adjusted) | .001 (.000, .003) | .08 | .143 | .001 (.000, .002) | .07 | .154 |
| Mediation coefficient | .000 (.000, .000) | .00 | .971 | .000 (.000, .000) | −.00 | .833 |
| Percent attenuation | ||||||
Note. MVPA = Moderate-to-Vigorous Physical Activity. BMIz = Body Mass Index z-score. Activity variables adjusted for total accelerometer wear time. All models were adjusted for participant age, ethnicity, education, marital status, study site, neighborhood income, and study design variables. Daily caloric intake was divided by 100 in order for results to be interpreted as change in the dependent variable per every 100 calories. Results presented were obtained from mediational anaylsis.
In children, TV time had a positive direct association with BMIz in both boys and girls (see Table 6). TV time remained significantly positively related to BMIz among boys and girls in this sample after adjustment for the potential mediators. Similar to the results in adolescents, there was a negative direct association between MVPA and BMIz in boys. Snacking/eating while watching TV had a positive association with BMIz in boys, but not girls, and emerged as a significant mediator of the association between TV time and BMIz (mediation coefficient: β = .06, p < .05). Accounting for frequency of snacking/eating while watching TV attenuated the association between children’s TV time and BMIz by 25% (p = .019; see Figure 1). No other diet or activity variables were directly or indirectly related to children’s BMIz.
Table 6.
Direct and Indirect Associations of Daily Television Time With BMIz (NIK) (N = 756).
| BMIz (DV) | ||||||
|---|---|---|---|---|---|---|
| Boys | Girls | |||||
| IVs/Mediators | B (95% CI) | β | p value | B (95% CI) | β | p value |
| TV time | .004 (.002, .006) | .23 | <.001 | .004 (.002, .006) | .24 | <.001 |
| MVPA minutes/day | −.005 (−.009, −.002) | −.12 | .016 | −.005 (−.011, .001) | −.09 | .112 |
| TV time (adjusted for MVPA) | .004 (.002, .006) | .23 | <.001 | .003 (.001, .005) | .18 | .001 |
| Mediation coefficient | .000 (.000, .001) | .01 | .177 | .000 (.000, .001) | .11 | .244 |
| Percent attenuation | ||||||
| Sedentary minutes/day | .001 (.000, .003) | .09 | .162 | .000 (−.002, .002) | −.01 | .894 |
| TV time (adjusted) | .004 (.002, .006) | .23 | <.001 | .004 (.002, .006) | .19 | <.001 |
| Mediation coefficient | .000 (.000, .001) | .01 | .319 | .000 (.000, .000) | .00 | .964 |
| Percent attenuation | ||||||
| DASH score | .010 (−.005, .024) | .07 | .187 | −.002 (−.018, .014) | −.02 | .803 |
| TV time (adjusted) | .005 (.003, .007) | .26 | <.001 | .003 (.001, .006) | .19 | .001 |
| Mediation coefficient | .000 (−.001, .000) | −.03 | .200 | .000 (−.00, .001) | .00 | .809 |
| Percent attenuation | ||||||
| Sweet/savory snacks | −.029 (−.094, .038) | −.05 | .388 | .020 (−.046, .092) | .03 | .563 |
| TV time (adjusted) | .004 (.002, .006) | .23 | <.001 | .004 (.001, .006) | .19 | <.001 |
| Mediation coefficient | .000 (.000, .001) | .01 | .467 | .000 (.000, .000) | .00 | .922 |
| Percent attenuation | ||||||
| High calorie beverages | .040 (−.103, .177) | .03 | .575 | −.021 (−.220, .157) | −.01 | .825 |
| TV time (adjusted) | .004 (.002, .006) | .24 | <.001 | .004 (.002, .006) | .19 | <.001 |
| Mediation coefficient | .000 (.000, .000) | .00 | .665 | .000 (.000, .000) | −.00 | .837 |
| Percent attenuation | ||||||
| Fruits/vegetables servings | .030 (−.016, .075) | .06 | .191 | .020 (−.039, .075) | .04 | .477 |
| TV time (adjusted) | .005 (.003, .007) | .25 | <.001 | .004 (.002, .006) | .20 | <.001 |
| Mediation coefficient | .000 (−.001, .000) | −.02 | .220 | .000 (.001, .000) | −.01 | .500 |
| Percent attenuation | ||||||
| Energy intake (energy/100) | .011 (−.016, .037) | .05 | .408 | .014 (−.012, .039) | .06 | .274 |
| TV time (adjusted) | .005 (.003, .007) | .24 | <.001 | .004 (.001, .005) | .19 | <.001 |
| Mediation coefficient | .000 (.000, .000) | .00 | .459 | .000 (.000, .000) | .00 | .748 |
| Percent attenuation | ||||||
| Snacking/eating while watching TV | .154 (−.657 – 1.064) | .15 | .014 | −.018 (−.145 −. 105) | −.02 | .778 |
| TV time (adjusted) | .003 (.001 – .006) | .18 | .002 | .004 (.002 – .006) | .20 | .001 |
| Mediation coefficient | .001 (.000 – .002) | .06 | .019 | .000 (−.001 – .001) | −.01 | .782 |
| Percent attenuation | 25% | |||||
Note. MVPA = Moderate-to-Vigorous Physical Activity. BMIz = Body Mass Index z-score. Activity variables adjusted for total accelerometer wear time. All models were adjusted for participant age, ethnicity, education, marital status, study site, neighborhood income, and study design variables. Daily caloric intake was divided by 100 in order for results to be interpreted as change in the dependent variable per every 100 calories. Results presented were obtained from mediational anaylsis.
Figure 1.
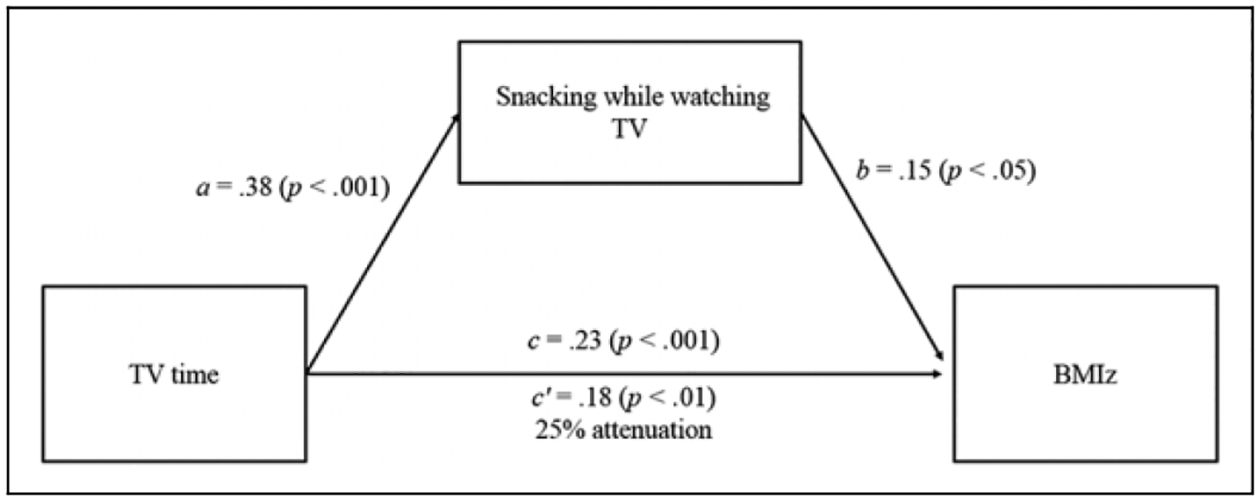
Snacking/eating while watching TV mediated the relationship between TV time and BMIz in younger boys. Standardized regression coefficients (βs) for the association between time spent watching TV and BMIz, as mediated by snacking/eating while watching TV, in NIK boys. Snacking/eating while watching TV attenuated the association between TV time and BMIz 25%. The coefficient representing the association between TV time and BMIz, adjusted for snacking/eating while watching TV, is noted as c’.
Discussion
Snacking while watching TV was the only 1 of 8 diet or activity variables that mediated the association between TV time and weight status, and this was only observed in 6–12 year old boys. The overall pattern of findings shows that many of the dietary mediators examined were related to TV time in the expected direction, and particularly for the younger sample of 6–12 year olds. TV time was also significantly related to weight status in the younger group. These findings suggest that snacking/eating while watching TV may partly explain the negative impact of TV time on higher weight status in youth. In particular, snacking/eating while watching TV may play a greater role in the TV time – BMI association than sedentary time, physical activity, or other dietary behaviors.
A notable finding was that TV time was significantly related to weight status among children of both sexes, but not among adolescents of either sex. It is unclear whether these divergent findings reflect an important age difference or methodological differences. A true age difference could be that adolescents had more diversified screen time behaviors, featuring more computer games, social media, and internet surfing than children. These other screen-based activities may be important contributors of weight status in this age group but wouldn’t have been captured in the TV time measure. This age difference in time spent in other screen time activities reflects a development shift that occurs in pre-adolescence or adolescence to socialize more with friends and peer groups. Social media and texting allow older youth to communicate and connect in a digital context that is can be more private from parents or family.44 In fact, there are established trends for decreased TV time in favor of other digital media. Compared to children, adolescents spend more time online, texting, and using social media.44 Generally, however, the relationship of TV viewing and weight status across age groups has been relatively inconsistent, especially as the specific age groups examined have varied across studies. Some evidence suggests that sedentary behavior, including screen time, may be more important to weight status in younger children, before the transition to adolescence.45 However, several studies have found associations between TV time and weight status in both children and adolescents4,18; therefore, more research is needed regarding age differences in this area.
Associations of TV Time with Dietary Behaviors and Activity
Greater time spent watching TV was consistently associated with poorer dietary quality indicators across age groups and sex, but not with MVPA or sedentary time. The exception was that in younger girls, TV time was related to lower MVPA. Thus, it appears that TV time may generally play a greater role in influencing dietary than activity behaviors in youth, and this interpretation is consistent with several previous studies.15,18,46 In particular, TV time appears to be related to poorer overall diet quality and lower fruit and vegetable intake.15 The link between TV time and dietary quality could be in part due to exposure to food marketing, as children have been shown to eat more snack food when watching TV that includes food advertising.47 Previous studies have shown that viewing food advertisements influences youth to choose more calorie-dense foods to consume,20 and that youth commonly consume foods seen in TV commercials.19 Moreover, there is evidence that reducing television viewing decreases sedentary behavior, energy intake, and weight status in children.48 Still, there are multiple contextual factors that may be at play in the relationship between TV time and dietary intake in children. Factors such as parenting practices are known to influence dietary behavior in youth and may also influence TV time.38,49 Thus, the direction of association, whether TV time leads to unhealthy snacking or the opposite, could not be determined in the present study. Future studies should aim to control for confounders such as parenting practice and the home environment and uncover the direction of this association. This would also inform whether interventions that target TV time, those that target snacking/eating, or those that target both (e.g., by targeting parenting and the home environment more holistically) would have the greatest impact on supporting a healthy weight in youth. Overall, the results point toward TV time as a potential target to address diet quality and weight status during childhood and adolescence, and for both boys and girls.
Associations of Dietary Behaviors and Activity With BMIz
Snacking/eating while watching TV, TV time, and MVPA were the only variables that were related to weight status in the expected direction. Findings in the present study align with previous research indicating that TV time may be associated with higher weight status more consistently than accelerometer measured sedentary time in some groups.5,7 Greater TV time was associated with a higher BMIz in 6–12 year olds but not 12–16 year olds, so mediators of the association between TV time and weight status were only able to be investigated in the younger age group. The finding of greater MVPA being associated with a lower BMIz was only observed in boys, but it was consistent across age groups. This finding highlights the known importance of MVPA in maintaining a healthy weight status across childhood and adolescence.50 Snacking while watching TV was the only dietary marker associated with BMIz in the expected direction, with more snacking/eating relating to a higher BMIz, and this was only observed in boys in the younger age group. Although healthy dietary behaviors are known to be important for obesity prevention in youth, studies have shown limited consistent associations between dietary quality indicators and weight status in youth both cross-sectionally and longitudinally, even when using rigorous 24-hour recall methods as was done in the present study.51 More objective dietary assessment methods are likely needed to better understand these associations, particularly in youth.
The complexity of studying the role of diet in weight status was illustrated by the significant inverse associations between energy intake and BMIz among adolescent girls and boys. Though such a relation is biologically implausible, it is a relatively common finding.52 Biased underestimates of energy intake have been reported for overweight/obese adolescents44,53 and adults,54 which would explain the pattern of findings in the present study.
Snacking/Eating While Watching TV as a Mediator
The present study provides evidence that snacking/eating while watching TV is a possible reason TV time relates to higher weight status in youth, specifically among 6–12 year old boys. This sex difference is consistent with some evidence that eating in front of the TV is related to more requests for advertised foods in boys than in girls.55 The lack of association between TV time and weight status in the older age group could have been due to the fact that the 12–16 year olds engaged in less snacking/eating while watching TV than the 6–12 year olds. In a similar previous study, snacking/eating while watching TV and junk food consumption did not mediate the association between TV time and weight status in 12–16 year olds,56 providing further evidence that the role of unhealthy eating while watching TV may be specific to younger children. Still, we note that the difference in measurement of snacking/eating while watching TV could have influenced the age group differences found here, considering that previous studies have not found consistent age differences in these behaviors thus far.15 Given the consistency of associations between TV time and weight status in children, the present findings point to the need for interventions to target reductions in unhealthy snacking/eating while watching TV. Such approaches, combined with strategies for reducing TV time, are likely to lessen the negative health impacts of TV time and improve obesity prevention efforts in children.48
Strengths
A main strength of this study was the inclusion of 2 distinct age groups of youth, as well as examining sex-specific associations. Previous studies had not considered the hypothesized associations in this way, and doing so resulted in novel findings. The objective measurement of sedentary time and physical activity, and the 3-day dietary recall57 were additional methodological strengths.
Limitations
The main limitations of the present study were the use of cross-sectional data to test mediation and the self-reported nature of the variables of TV time and snacking/eating while watching TV based on single survey items. For example, the self/parent reported items for snacking/eating while watching TV differed in language across age groups. The items also did not specify whether all TV time was indeed spent sedentary. TV time could include active time and this could explain why sedentary time was not associated with TV time in either age group. More objective measurements obtained through TV monitoring or behavioral coding may provide more accurate data, as would evaluation of the quality and quantity of food consumed while watching TV and the type of TV watching (e.g., with or without food advertisements). It is also not clear whether findings would extend to other activities in which youth are engaged with screens (e.g., video game playing, internet and/or social media engagement). Similarly, differences in screen time uses among children and adolescents differed from the time of data collection compared to present day, which suggests a possible limitation to the generalizability of findings. An additional limitation is that the 30 second epochs may have slightly underestimated MVPA as compared to shorter epochs (e.g., 15 seconds).28 Lastly, factors pertaining to the family environment and parental influence on screen time and dietary behavior were not included in the present study, although they are important to consider in the context of youth health behavior.
Future Direction
The present study examined 8 variables as potential mediators of the association between TV time and weight status. Six of these variables were related to dietary behavior and 2 were activity variables. Future work that additionally considers patterns of sedentary behavior, such as extended bouts and frequency of breaks, may provide more nuanced findings regarding the role of activity in this relationship of interest. Future studies should investigate other obesity-related indicators such as waist circumference, in addition to weight status. However, to date there has been limited consistent evidence that sedentary behaviors among youth have negative biological consequences.45,58 Increased evidence is need to support current recommendations, such as the 24-hour movement guidelines that recommend limiting recreational screen time to 2 hours per day in youth 5–17 years old.12 Although more detailed measures of patterns of sedentary behavior, objective measures of TV viewing, and identification of the content of food commercials viewed may improve understanding of the health impacts of TV viewing, present results suggest that more detailed measurement of food-related behaviors while watching TV may be more informative.
Conclusions
Findings from the present study indicated that snacking/eating while watching TV was an important factor explaining why 6 to 12 year old boys who spend large amounts of time watching TV may be at increased risk for obesity, as compared to those who spend less time watching TV. Therefore, this study provides new information regarding the role of diet in the relationship between TV time and weight status in youth. Snacking/eating while watching TV may be a factor that results in more consistent associations between TV time and weight status, even as compared to other types of screen time6 or accelerometer-based sedentary time.5,7 Obesity prevention efforts that target improving diet and/or reducing sedentary time should consider the interplay between these behaviors. In particular, interventions designed to both reduce TV time and reduce unhealthy snacking/eating while watching TV should be evaluated among children.
So What? (Implications for Health Promotion Practitioners and Researchers).
What is already known on this topic?
Excess TV time is common and associated with higher weight status and negative health consequences across the developmental trajectory, even more consistently than other types of screen time or than accelerometer-assessed sedentary time.
What does this article add?
We explored whether diet, sedentary time, and physical activity explain the relationship between TV time and weight status in youth.
Several significant associations emerged between TV time and the diet/activity variables, and between diet/activity variables and BMIz.
Snacking/eating while watching TV partially explained the relationship between TV time and BMIz in 6–12 year old boys.
What are the implications for health promotion practice or research?
Targeting reductions in TV time along with snacking/eating while watching TV could promote healthful lifesyles and weight status in youth.
Funding
The author(s) disclosed receipt of the following financial support for the research, authorship and/or publication of this article: This work was supported by NIH grant HL083454, ES014240, HL67350; and USDA 2007-55215-17924.
This study was approved by the sponsoring institution’s human subjects’ protection committee and all participants provided informed consent and assent.
Footnotes
Declaration of Conflicting Interests
The author(s) declared no potential conflicts of interest with respect to the research, authorship, and/or publication of this article.
References
- 1.Bar-On ME, Broughton DD, Buttross S, et al. Children, adolescents, and television. Pediatrics. 2001;107(2):423–426. [DOI] [PubMed] [Google Scholar]
- 2.Houghton S, Hunter SC, Rosenberg M, et al. Virtually impossible: limiting Australian children and adolescents daily screen based media use. BMC Public Health. 2015;15(1):5. [DOI] [PMC free article] [PubMed] [Google Scholar]
- 3.Lou D Sedentary Behaviors and Youth: Current Trends and the Impact on Health. Active Living Research; 2014. [Google Scholar]
- 4.Proctor MH, Moore L, Gao D, et al. Television viewing and change in body fat from preschool to early adolescence: the Framingham Children’s Study. Int J Obes Relat Metab Disord. 2003; 27(7):827–833. [DOI] [PubMed] [Google Scholar]
- 5.Tremblay MS, LeBlanc AG, Kho ME, et al. Systematic review of sedentary behaviour and health indicators in school-aged children and youth. Int J Behav Nutr Phys Act. 2011;8(1):98. [DOI] [PMC free article] [PubMed] [Google Scholar]
- 6.Falbe J, Rosner B, Willett WC, Sonneville KR, Hu FB, Field AE. Adiposity and different types of screen time. Pediatrics. 2013; 132(6):e1497–e1505. [DOI] [PMC free article] [PubMed] [Google Scholar]
- 7.Cliff DP, Hesketh KD, Vella SA, et al. Objectively measured sedentary behaviour and health and development in children and adolescents: systematic review and meta-analysis. Obes Rev. 2016;17(4):330–344. [DOI] [PubMed] [Google Scholar]
- 8.Hancox RJ, Milne BJ, Poulton R. Association between child and adolescent television viewing and adult health: a longitudinal birth cohort study. Lancet. 2004;364(9430):257–262. [DOI] [PubMed] [Google Scholar]
- 9.Bickham DS, Blood EA, Walls CE, Shrier LA, Rich M. Characteristics of screen media use associated with higher BMI in young adolescents. Pediatrics. 2013;131(5):935–941. [DOI] [PMC free article] [PubMed] [Google Scholar]
- 10.Jago R, Baranowski T, Baranowski JC, Thompson D, Greaves KA. BMI from 3–6 y of age is predicted by TV viewing and physical activity, not diet. Int J Obes (Lond). 2005;29(6):557–564. [DOI] [PubMed] [Google Scholar]
- 11.Fulton JE, Wang X, Yore MM, Carlson SA, Galuska DA, Caspersen CJ. Television viewing, computer use, and BMI among US children and adolescents. J Phys Act Health. 2009;6(suppl 1): S28–S35. [DOI] [PubMed] [Google Scholar]
- 12.Tremblay MS, Carson V, Chaput J-P, et al. Canadian 24-hour movement guidelines for children and youth: an integration of physical activity, sedentary behaviour, and sleep. Appl Physiol Nutr Metab. 2016;41(6):S311–S327. [DOI] [PubMed] [Google Scholar]
- 13.Prentice-Dunn H, Prentice-Dunn S. Physical activity, sedentary behavior, and childhood obesity: a review of cross-sectional studies. Psychol Health Med. 2012;17(3):255–273. [DOI] [PubMed] [Google Scholar]
- 14.Kracht CL, Joseph ED, Staiano AE. Video games, obesity, and children. Curr Obes Rep. 2020;19(1):1–14. [DOI] [PMC free article] [PubMed] [Google Scholar]
- 15.Ghobadi S, Hassanzadeh-Rostami Z, Salehi-Marzijarani M, et al. Association of eating while television viewing and overweight/obesity among children and adolescents: a systematic review and meta-analysis of observational studies. Obes Rev. 2018;19(3): 313–320. doi: 10.1111/obr.12637 [DOI] [PubMed] [Google Scholar]
- 16.Ekelund U, Brage S, Froberg K, et al. TV viewing and physical activity are independently associated with metabolic risk in children: the European Youth Heart Study. PLoS Med. 2006;3(12): e488. [DOI] [PMC free article] [PubMed] [Google Scholar]
- 17.Gebremariam MK, Bergh IH, Andersen LF, et al. Are screen-based sedentary behaviors longitudinally associated with dietary behaviors and leisure-time physical activity in the transition into adolescence? Int J Behav Nutr Phys Act. 2013;10(1):9. [DOI] [PMC free article] [PubMed] [Google Scholar]
- 18.Pearson N, Biddle SJ. Sedentary behavior and dietary intake in children, adolescents, and adults: a systematic review. Am J Prev Med. 2011;41(2):178–188. [DOI] [PubMed] [Google Scholar]
- 19.Wiecha JL, Peterson KE, Ludwig DS, Kim J, Sobol A, Gortmaker SL. When children eat what they watch: impact of television viewing on dietary intake in youth. Arch Pediatr Adolesc Med. 2006;160(4):436–442. [DOI] [PubMed] [Google Scholar]
- 20.Boyland EJ, Harrold JA, Kirkham TC, et al. Food commercials increase preference for energy-dense foods, particularly in children who watch more television. Pediatrics. 2011;128(1):e93–e100. [DOI] [PubMed] [Google Scholar]
- 21.Cleland VJ, Patterson K, Breslin M, Schmidt MD, Dwyer T, Venn AJ. Longitudinal associations between TV viewing and BMI not explained by the ‘mindless eating’ or ‘physical activity displacement’ hypotheses among adults. BMC Public Health. 2018;18(1):797. [DOI] [PMC free article] [PubMed] [Google Scholar]
- 22.Sallis JF, Conway TL, Cain KL, et al. Neighborhood built environment and socioeconomic status in relation to physical activity, sedentary behavior, and weight status of adolescents. Preventive Medicine. 2018;110:47–54. [DOI] [PMC free article] [PubMed] [Google Scholar]
- 23.Frank LD, Saelens BE, Chapman J, et al. Objective assessment of obesogenic environments in youth: geographic information system methods and spatial findings from the neighborhood impact on kids study. American Journal of Preventive Medicine. 2012; 42(5):e47–e55. [DOI] [PubMed] [Google Scholar]
- 24.Saelens BE, Sallis JF, Frank LD, et al. Obesogenic neighborhood environments, child and parent obesity: The neighborhood impact on kids study. American Journal of Preventive Medicine. 2012; 42(5):e57–64. [DOI] [PMC free article] [PubMed] [Google Scholar]
- 25.Cain KL, Sallis JF, Conway TL, Van Dyck D, Calhoon L. Using accelerometers in youth physical activity studies: a review of methods. Journal of Physical Activity & Health. 2013;10(3): 437–450. [DOI] [PMC free article] [PubMed] [Google Scholar]
- 26.Cain KL, Sallis JF, Conway TL, Van Dyck D, Calhoon L. Using accelerometers in youth physical activity studies: a review of methods. J Phys Act Health. 2013;10(3):437–450. [DOI] [PMC free article] [PubMed] [Google Scholar]
- 27.Mattocks C, Ness A, Leary S, et al. Use of accelerometers in a large field-based study of children: protocols, design issues, and effects on precision. J Phys Act Health. 2008;5(suppl 1):S98–S111. [DOI] [PubMed] [Google Scholar]
- 28.Trost SG, Loprinzi PD, Moore R, Pfeiffer KA. Comparison of accelerometer cut points for predicting activity intensity in youth. Med Sci Sports Exerc. 2011;43(7):1360–1368. [DOI] [PubMed] [Google Scholar]
- 29.Evenson KR, Catellier DJ, Gill K, Ondrak KS, McMurray RG. Calibration of two objective measures of physical activity for children. J Sports Sci. 2008;26(14):1557–1565. [DOI] [PubMed] [Google Scholar]
- 30.Freedson P, Pober D, Janz KF. Calibration of accelerometer output for children. Med Sci Sports Exerc. 2005;37(11 suppl): S523–S530. [DOI] [PubMed] [Google Scholar]
- 31.Norman GJ, Schmid BA, Sallis JF, Calfas KJ, Patrick K. Psychosocial and environmental correlates of adolescent sedentary behaviors. Pediatrics. 2005;116(4):908–916. [DOI] [PubMed] [Google Scholar]
- 32.Rosenberg DE, Sallis JF, Kerr J, et al. Brief scales to assess physical activity and sedentary equipment in the home. The International Journal of Behavioral Nutrition and Physical Activity. 2010;7:10. [DOI] [PMC free article] [PubMed] [Google Scholar]
- 33.Eck L, Klesges R, Hanson C. Recall of a child’s intake from one meal: are parents accurate? J Am Diet Assoc. 1989;89(6): 784–789. [PubMed] [Google Scholar]
- 34.Johnson RK, Driscoll P, Goran MI. Comparison of multiple-pass 24-hour recall estimates of energy intake with total energy expenditure determined by the doubly labeled water method in young children. J Am Diet Assoc. 1996;96(11):1140–1144. [DOI] [PubMed] [Google Scholar]
- 35.Jonnalagadda SS, Mitchell DC, Smiciklas-Wright H, et al. Accuracy of energy intake data estimated by a multiple pass, 24-hour dietary recall technique. J Am Diet Assoc. 2000;100(3):303–311. [DOI] [PubMed] [Google Scholar]
- 36.American Heart Association. The American Heart Association’s Diet and Lifestyle Recommendations. 2015. Accessed April 7, 2020. http://www.heart.org/HEARTORG/HealthyLiving/HealthyEating/Nutrition/The-American-Heart-Associations-Diet-and-Lifestyle%20Recommendations_UCM_305855_Article.jsp#.XcM1plVKiUk
- 37.U. S. Department of Health and Human Services. Your Guide to Lowering Blood Pressure. National Institutes of Health: National Heart, Lung, and Blood Institute; 2019. Accessed April 7, 2020. https://www.nhlbi.nih.gov/files/docs/public/heart/new_dash.pdf [Google Scholar]
- 38.Couch SC, Glanz K, Zhou C, et al. Home food environment in relation to children’s diet quality and weight status. Journal of the Academy of Nutrition and Dietetics. 2014;114(10):1569–1579. [DOI] [PMC free article] [PubMed] [Google Scholar]
- 39.Himes JH, Faricy A. Validity and reliability of self-reported stature and weight of US adolescents. Am J Hum Biol. 2001;13(2):255–260. [DOI] [PubMed] [Google Scholar]
- 40.Goodman E, Hinden BR, Khandelwal S. Accuracy of teen and parental reports of obesity and body mass index. Pediatrics. 2000; 106(1 Pt 1):52–58. [DOI] [PubMed] [Google Scholar]
- 41.Strauss RS. Comparison of measured and self-reported weight and height in a cross-sectional sample of young adolescents. Int J Obes Relat Metab Disord. 1999;23(8):904–908. [DOI] [PubMed] [Google Scholar]
- 42.Ogden CL, Kuczmarski RJ, Flegal KM, et al. Centers for Disease Control and Prevention 2000 growth charts for the United States: improvements to the 1977 National Center for Health Statistics version. Pediatrics. 2002;109(1):45–60. [DOI] [PubMed] [Google Scholar]
- 43.Preacher KJ, Hayes AF. Asymptotic and resampling strategies for assessing and comparing indirect effects in multiple mediator models. Behav Res Methods. 2008;40(3):879–891. [DOI] [PubMed] [Google Scholar]
- 44.Twenge JM, Martin GN, Spitzberg BH. Trends in US Adolescents’ media use, 1976–2016: the rise of digital media, the decline of TV, and the (near) demise of print. Psychol Pop Media Cult. 2019;8(4):329–345. [Google Scholar]
- 45.Must A, Tybor D. Physical activity and sedentary behavior: a review of longitudinal studies of weight and adiposity in youth. Int J Obes (Lond). 2005;29(suppl 2):S84–S96. [DOI] [PubMed] [Google Scholar]
- 46.Jackson DM, Djafarian K, Stewart J, Speakman JR. Increased television viewing is associated with elevated body fatness but not with lower total energy expenditure in children. Am J Clin Nutr. 2009;89(4):1031–1036. [DOI] [PubMed] [Google Scholar]
- 47.Harris JL, Bargh JA, Brownell KD. Priming effects of television food advertising on eating behavior. Health Psychol. 2009;28(4): 404–413. [DOI] [PMC free article] [PubMed] [Google Scholar]
- 48.Epstein LH, Roemmich JN, Robinson JL, et al. A randomized trial of the effects of reducing television viewing and computer use on body mass index in young children. Arch Pediatr Adolesc Med. 2008;162(3):239–245. [DOI] [PMC free article] [PubMed] [Google Scholar]
- 49.Robson SM, Couch SC, Peugh JL, et al. Parent diet quality and energy intake are related to child diet quality and energy intake. J Acad Nutr Diet. 2016;116(6):984–990. [DOI] [PMC free article] [PubMed] [Google Scholar]
- 50.Piercy KL, Troiano RP, Ballard RM, et al. The physical activity guidelines for Americans. JAMA. 2018;320(19):2020–2028. [DOI] [PMC free article] [PubMed] [Google Scholar]
- 51.Patrick K, Norman GJ, Calfas KJ, et al. Diet, physical activity, and sedentary behaviors as risk factors for overweight in adolescence. Arch Pediatr Adolesc Med. 2004;158(4):385–390. [DOI] [PubMed] [Google Scholar]
- 52.Fulton JE, Dai S, Steffen LM, Grunbaum JA, Shah SM, Labarthe DR. Physical activity, energy intake, sedentary behavior, and adiposity in youth. Am J of Prev Med. 2009;37(1): S40–S49. [DOI] [PMC free article] [PubMed] [Google Scholar]
- 53.Bandini LG, Schoeller DA, Cyr HN, Dietz WH. Validity of reported energy intake in obese and nonobese adolescents. Am J Clin Nutr. 1990;52(3):421–425. [DOI] [PubMed] [Google Scholar]
- 54.Livingstone MBE, Black AE. Markers of the validity of reported energy intake. J Nutr. 2003;133(3):895S–920S. [DOI] [PubMed] [Google Scholar]
- 55.Marquis M, Filion YP, Dagenais F. Does eating while watching television influence children’s food-related behaviours? Can J Diet Prac Res. 2005;66(1):12–18. [DOI] [PubMed] [Google Scholar]
- 56.Carson V, Janssen I. The mediating effects of dietary habits on the relationship between television viewing and body mass index among youth. Pediatr Obes. 2012;7(5):391–398. [DOI] [PubMed] [Google Scholar]
- 57.U.S. Department of Health & Human Services. Summary Tables: Recommendations on Potential Approaches to Dietary Assessment for Different Research Objectives Requiring Group-level Estimates. 2019. Accessed April 7, 2020. https://dietassessmentprimer.cancer.gov/approach/table.html
- 58.Chinapaw MJ, Proper KI, Brug J, van Mechelen W, Singh AS. Relationship between young peoples’ sedentary behaviour and biomedical health indicators: a systematic review of prospective studies. Obes Rev. 2011;12(7):e621–e632. [DOI] [PubMed] [Google Scholar]