Correction: Arthritis Res Ther 24, 249 (2022)
https://doi.org/10.1186/s13075-022-02938-z
Following publication of the original article [1], the authors have identified an error in Figs. 1, 2, 3 and 4. The correct figures are given below.
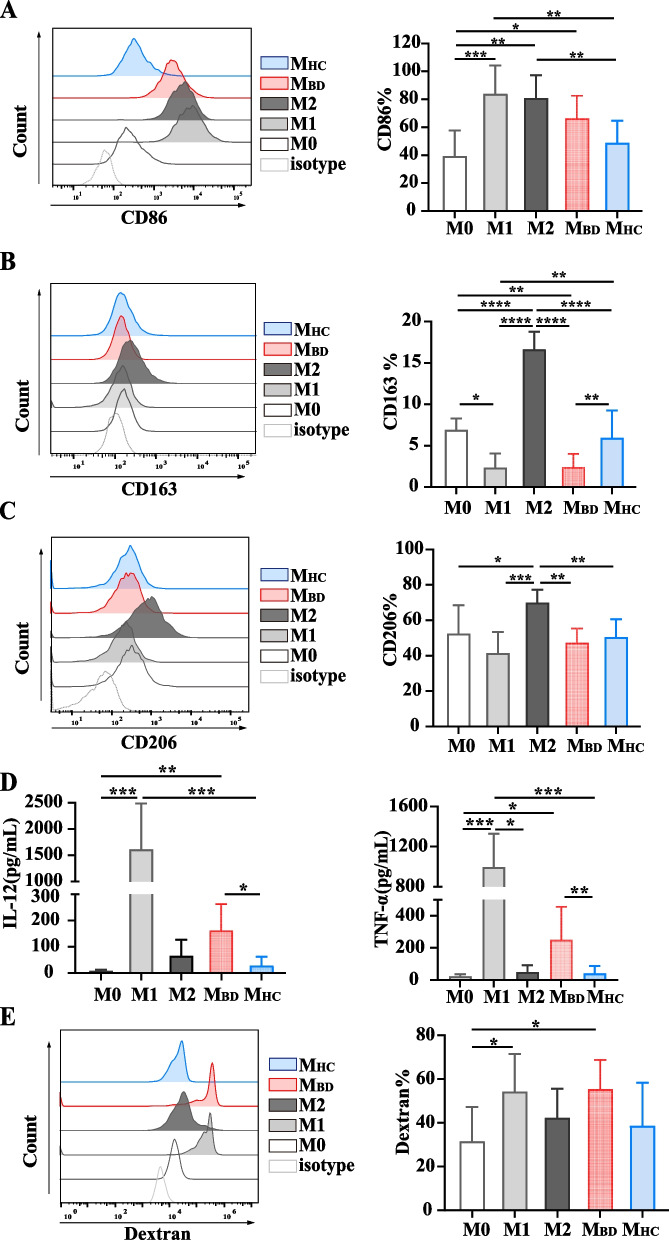
Fig. 1.
BD serum promotes M1-like macrophage polarization. Resting macrophages (M0) were stimulated with M1 condition (100ng/ml LPS+ 20ng/ml IFNγ), M2 condition (20ng/ml IL-4+ 20ng/ml IL-13), BD serum or HC serum for 48 h. A–C Representative histograms (left) and summary (right) of CD86, CD163 and CD206 expression level of macrophages stimulated with M0 (n=6), M1 (n=6), and M2 (n=6) conditions, as well as BD (n=12) serum and HC (n=12) serum. Data were expressed as mean±SD and were analyzed using one-way ANOVA. D IL-12 and TNF-α production by macrophages stimulated with M0 (n=6), M1 (n=6), and M2 (n=6) conditions, as well as BD (n=12) serum and HC (n=12) serum. Data were expressed as mean±SD and were analyzed using Kruskal-Wallis test. E Representative histograms (left) and summary (right) of dextran uptake by macrophages stimulated with M0 (n=7), M1 (n=7), M2 (n=7) conditions, and BD (n=9) serum and HC (n=9) serum. Data were expressed as mean±SD and were analyzed using one-way ANOVA. *, p<0.05; **, p<0.01; ***, p<0.001, ****, p<0.001. MBD, BD serum-treated macrophages; MHC, HC serum-treated macrophages
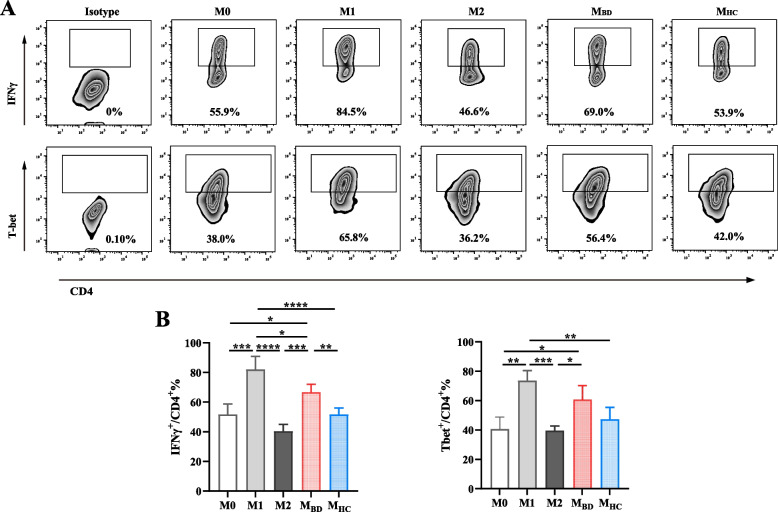
Fig. 2.
BD serum-treated macrophages facilitate Th1 differentiation. Naive CD4+ T cells were incubated with M0, M1, M2, BD serum- and HC serum-treated macrophages in Th1 condition (5μg/ml anti-CD3, 5μg/ml anti-CD28, 5μg/ml anti-IL-4, and 10ng/ml IL-2) for 5 days. A Representative flow cytometry plots and B summary of IFNγ and T-bet [n(M0)=3, n(M1)=3, n(M2)=3, n(MBD)=5, n(MHC)=5] expression levels in CD4+ T cells. Data were shown as mean±SD. *, p<0.05; **, p<0.01; ***, p<0.001, ****, p<0.001 by one-way ANOVA. MBD, BD serum- treated macrophages; MHC, HC serum- treated macrophages
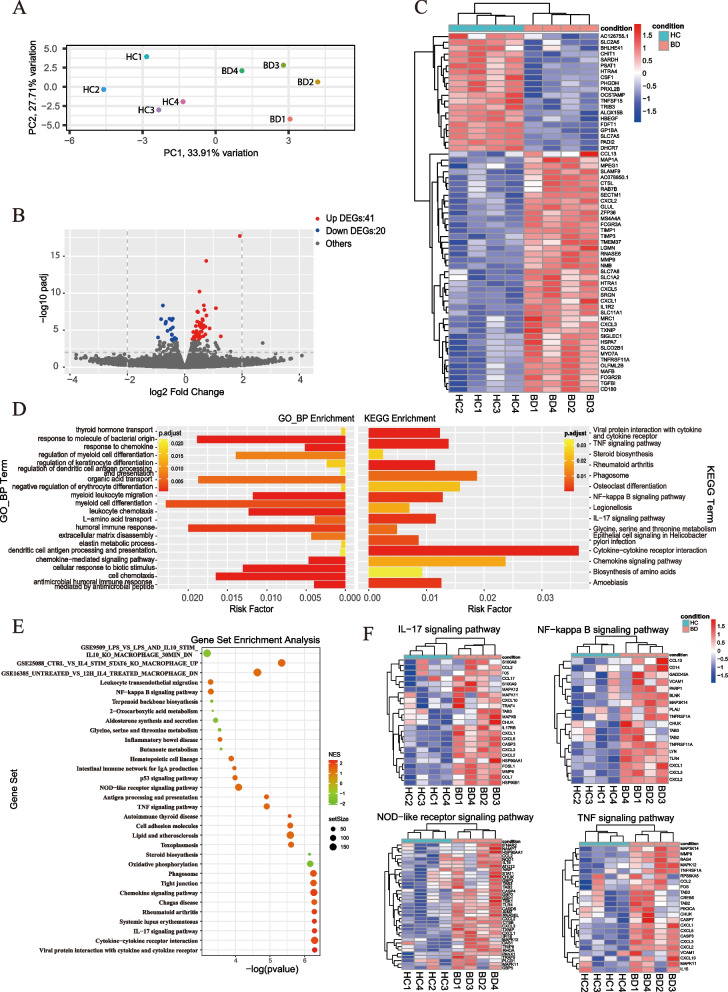
Fig. 3.
Transcriptome analysis of BD serum- and HC serum-treated macrophages. HMDMs were stimulated with serum from four treatment-naïve active BD patients and matched healthy volunteers for 48 h, and total RNA was extracted for RNA-seq analysis. A Principal component analysis (PCA) of BD serum-treated and HC serum-treated macrophages. B Volcano plot of upregulated (red, n=41) and downregulated (blue, n=20) DEGs in BD serum-treated macrophages compared with HC serum-treated macrophages. C Heatmap of DEGs between BD serum- and HC serum-treated macrophages. D GO biological process enrichment analysis and KEGG enrichment analysis between BD serum- and HC serum-treated macrophage. E, F Dot plots (left) showed Gene Set Enrichment Analysis (GSEA) of BD serum- and HC serum-treated macrophage. Representative enriched gene sets were illustrated by heatmap (right). DEGs, differentially expressed genes; GO, gene ontology; KEGG, Kyoto Encyclopedia of Genes and Genomes
Fig. 4.
NF-κB pathway mediated BD serum-treated M1-like macrophage polarization. A Representative western blot images (upper) and summary (lower) of NF-κB p65, phospho-p65 and IκBα of macrophages treated with BD (n=3) serum or HC (n=3) serum. Macrophages were pretreated with DHE and then were stimulated with BD serum for 48 h. B Representative histograms (left) and summary (right) of CD86 expression on DHE-treated and untreated macrophages stimulated with BD (n=6) serum and HC (n=6) serum. C TNF-α production by DHE-treated and untreated macrophages stimulated with BD serum (n=6) and HC (n=6) serum. Data were shown as mean±SD. *, p<0.05; **, p<0.01, ***, p<0.001, ****, p<0.001 by two-way ANOVA. MBD, BD serum- treated macrophages; MHC, HC serum- treated macrophages
The original article [1] has been updated.
Footnotes
Xiuhua Wu, Zhimian Wang and Jing Shi contributed equally to this work.
Contributor Information
Hua Chen, Email: chenhua@pumch.cn.
Wenjie Zheng, Email: zhengwj@pumch.cn.
Reference
- 1.Wu X, Wang Z, Shi J, et al. Macrophage polarization toward M1 phenotype through NF-κB signaling in patients with Behçet’s disease. Arthritis Res Ther. 2022;24:249. doi: 10.1186/s13075-022-02938-z. [DOI] [PMC free article] [PubMed] [Google Scholar]


