

Abstract
Purpose:
To explore the potential of Deuterium Metabolic Imaging (DMI) in the human brain in vivo at 7 T, using a multi-element deuterium (2H) RF coil for 3D volume coverage.
Methods:
1H-MR images and localized 2H MR spectra were acquired in vivo in the human brain of three healthy subjects to generate DMI maps of 2H-labeled water, glucose, and glutamate/glutamine (Glx). In addition, non-localized 2H-MR spectra were acquired both in vivo and in vitro to determine T1 and T2 relaxation times of deuterated metabolites at 7 T. The performance of the 2H coil was assessed through numerical simulations and experimentally acquired B1+ maps.
Results:
3D DMI maps covering the entire human brain in vivo were obtained from well-resolved deuterated (2H) metabolite resonances of water, glucose, and glutamate/glutamine (Glx). The T1 and T2 relaxation times were consistent with those reported at adjacent field strengths. Experimental B1+ maps were in good agreement with simulations, indicating efficient and homogeneous B1+ transmission and low RF power deposition for 2H, consistent with a similar array coil design reported at 9.4 T.
Conclusion:
Here we have demonstrated the successful implementation of 3D DMI in the human brain in vivo at 7 T. The spatial and temporal nominal resolutions achieved at 7 T, i.e. 2.7 mL in 28 mins, respectively, were close to those achieved at 9.4 T and greatly outperformed DMI at lower magnetic fields. DMI at 7 T and beyond has clear potential in applications dealing with small brain lesions.
Keywords: Deuterium (2H), Deuterium metabolic imaging (DMI), 7 Tesla (7 T), human brain, brain energy metabolism, water, glucose, glutamate/glutamine (Glx)
1. Introduction
Deuterium metabolic imaging (DMI) combines 2H magnetic resonance spectroscopic imaging (2H MRSI) with administration of a deuterated substrate and enables spatial mapping of the substrate of interest and its metabolites (1,2). This approach is analogous to the detection of 13C-labeled metabolites using 13C magnetic resonance spectroscopy (13C MRS) (3,4), but the short T1 of 2H and favourable T1/T2 ratio allow for rapid averaging of the 2H MR signal (5), making DMI in practice a more sensitive technique. The increased 2H MR sensitivity enables 3D mapping at relatively high spatial resolution and the generation of metabolic maps of the deuterated substrate and the metabolic products (1). The strategy to use 2H as a label for metabolic studies further benefits from the low natural abundance of deuterium (~ 0.012%), which is ~100 times lower than 13C, and leads to a sparse 2H MR spectrum containing only a small water (1H2HO) signal prior to 2H-enriched substrate administration (6). As a result, brain 2H MRSI data can be acquired with simple RF pulse sequences without water suppression, and using phase encoding for spatial localization, without the need for lipid suppression. The simple methods employed for DMI lead to robust acquisitions and result in low RF power deposition. In addition, it has been shown that the 2H signal to noise ratio (SNR) has a supra-linear dependency on magnetic field strength, such that DMI applications greatly benefit from using high field MR scanners (7). This sensitivity gain was recently demonstrated in human brain DMI studies performed at 9.4 T (8).
Following administration of [6,6’-2H2]-glucose, signals from deuterated water, glucose as well as the main observable metabolic product, a combined pool of 2H-labelled glutamate and glutamine (Glx), can be detected in 2H MR spectra of the mammalian brain. When DMI data are acquired in a dynamic way, capturing the increase in 2H-labeling of the glucose metabolites over time with a sufficiently high temporal resolution, the data can be used as input for metabolic models to calculate metabolic rates (5,9,10). If instead spatial resolution is prioritized, DMI acquisitions can benefit from increased signal averaging across a time during which the level of 2H-labeled compounds is relatively constant. This period of approximate isotopic steady-state can be used to visualize regional metabolic differences such as those observed in brain tumors (1). Following our initial work on human brain at 7 T with a small surface coil transceiver (7), here we report 3D DMI at 7 T with whole-brain coverage that allows the detection of glucose metabolism in brain of healthy control subjects following the oral intake of [6,6’-2H2]-glucose. The focus of the current DMI study was not on dynamic mapping of glucose metabolism (5,8–10), but rather on detecting signals during approximate isotopic steady-state circa 60-120 min following glucose administration as has previously been used to study patient populations (1). Emphasis is given to the achievable spatial resolution and data quality of 3D DMI at 7 T, as well at the feasibility of using ultra-high field strengths for DMI research and clinical applications.
2. Methods
All experiments were performed on a Siemens Magnetom 7 T head-only human scanner (Erlangen, Germany) using an 8-channel 1H/10-channel 2H transceiver array coil based on a recently reported designs (8,11) with 7 T-specific modifications on the coil dimensions and decoupling strategy. During transmission, the multiple elements of both the 1H and 2H arrays operated in a fixed circular polarization (CP) phase mode without the option for RF shimming. Magnetic field (B0) homogeneity was optimized using the 3D mapping and interactive Siemens’ shim routines in which the shim volume was adjusted for each subject. All data were processed in Matlab (MathWorks, Natick, MA, USA) and DMIWizard (12).
Scanner configuration
Although Siemens human scanners support a wide range of X nuclei that allow multinuclear MR measurements, the deuterium (2H) nucleus is currently not supported. To enable 2H studies, the base frequency of a system-supported nucleus (e.g., 17O) was replaced with a 2H frequency generated by an external frequency source, identical to the approach describe to enable 2H at 9.4 T (8). Specific for the current 7 T project, an external frequency was set to the 2H resonance frequency at 7 T (45.5 MHz) plus an additional 2 MHz as demanded by the Siemens RF pathway (Figure 1A). The signal was split four ways and fed into the transmit (LO TRA) and three receive (LO REC) boards (Figure 1A). All methods were executed with the 17O nucleus selected in the Siemens interface. As the modification is specific for 2H MR, 1H MRI, and shimming were performed prior to any 2H scan.
Figure 1:
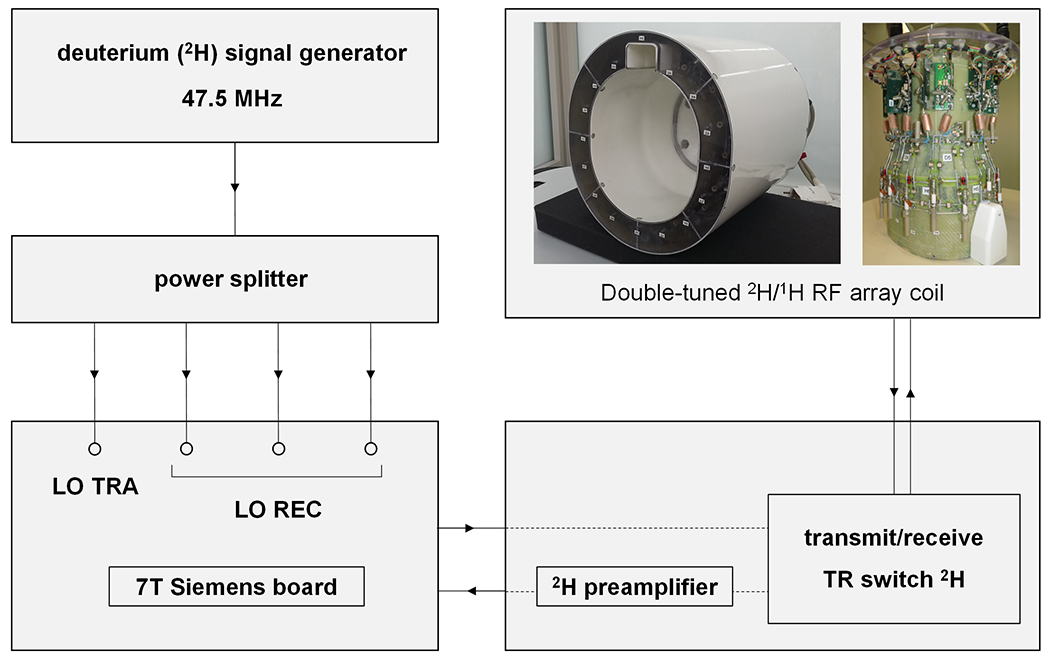
(A) Schematic diagram of the hardware adjustments needed to enable deuterium (2H) MR on a 7 T Siemens Magnetom scanner. An external signal generator was used to generate a frequency 2 MHz above the 2H Larmor frequency (45.5 MHz). The 2H signal generator was then connected to a power splitter from which the four output cables were connected to the transmitter (LO TRA) and three receiver (LO REC) ports on the Siemens board. A double-tuned 1H/2H RF array coil was used for 1H-based imaging and shimming, after which 2H MR measurements (DMI, T1, T2) were performed following the cable modifications shown.
Human subjects and substrate administration
Informed consent was obtained from all subjects in accordance with protocols approved by the Yale University Institutional Review Board. Three subjects were scanned at natural abundance deuterium levels and three subjects were scanned following the oral administration of deuterated glucose. Up to 60 grams of [6,6’-2H2]-glucose (0.75 g/kg body weight) was dissolved in 250 mL of water and consumed by the subject over a time span of circa 10 minutes. All in vivo 2H measurements were made at approximate isotopic steady-state, between 60 and 140 min following glucose consumption (1,8).
Phantoms
A dielectric phantom was designed to mimic the loading conditions of human head, based on previous work (13,14), and using the accompanying online recipe generator (14) to produce specific solutions of sugar and salt in water. Conductivity and relative permittivity of brain tissue at 45.6 MHz were estimated to be 0.48 S/m and 66, respectively, based on extrapolating brain tissue values determined by Hartsgrove et. al. (13). A 3D printed, elliptical phantom with a volume of 3.1 L and custom-designed to fit the RF coil was filled with 1,776 g sugar (sucrose) and 42 g salt (KCl) dissolved in 2,000 mL water containing 2 M of deuterium oxide (D2O). The phantom was used the set up and test 2H MR and DMI acquisitions and obtain experimental maps of the 2H transmit (B1+) magnetic field to validate the electromagnetic simulations.
T1 and T2 relaxation measurements of water and glucose were performed on a 500 mL glass sphere phantom containing a solution of 2 mM [6,6’-2H2]-glucose dissolved in water and 1.5% agarose. T1 and T2 relaxation measurements were performed in vitro, in addition to in vivo, for comparison and validation with previous results of T1 and T2 in vitro at other field strengths in which the same solution was used (1).
B1+ mapping and electromagnetic field simulation
To evaluate both safety and sensitivity of the array coil, electromagnetic (EM) simulations and experimental B1+ maps were obtained. EM simulations of the array were performed as two separate computations at 46 MHz and 297.2 MHz using a time domain solver (CST Studio Suite 2021), analog to the more detailed descriptions previously published (11,15). In these simulations, the coil was loaded with multi-tissue human models Duke and Ella cropped at the shoulder level. After the full-wave simulations, the coil elements were tuned, matched to 50 Ω and decoupled using co-simulations (Schematic CST Studio Suite). As a decoupling technique, adjacent loops were overlapped for 1H and 2H with transformer decoupling between two closed non-adjacent loops for 2H. The B1+ field and specific absorption rate (SAR10g, averaged over 10 g of tissue) were evaluated for the circular polarized mode for both the 1H and 2H arrays for 1 W coil input power. The resulting SAR maps were used as guidance to set the global power limits, whereby the small frequency difference between 17O (40 MHz, used by the system for SAR monitoring) and 2H (46 MHz) was not considered. The accuracy of the EM simulations for DMI in vivo was established by comparing the simulated 2H B1+ field at 46 MHz with experimentally acquired 2H B1+ maps. To that purpose, a series of 2H MR images were acquired in vitro using a 3D fast low angle shot (FLASH) sequence adapted for 2H nucleus with a non-selective 1.0 ms rectangular excitation pulse. The voltage required for the excitation pulse to achieve 90° flip angle was calibrated over a range of transmit voltages non-linearly spaced from 15 to 300 V. The experimentally applied voltage was corrected for losses over the cables and power splitters. All 2H images were acquired as a 48 x 64 x 48 matrix over a 192 x 256 x 192 mm3 field-of-view with 6 signal averages, TR 400 ms and a 15 kHz acquisition width. All 2H MR images were processed off-line in Matlab using a signal intensity fitting program in which each image pixel was best fitted as a sinusoidal function of input voltage. The resulting ‘excitation voltage map’ was converted to a quantitative B1+ map, based on the notion that a 1.0 ms square 90° pulse provides excitation at a B1+ of 250 Hz.
T1 and T2 relaxation time measurements
Deuterium (2H) T1 and T2 relaxation time measurements were performed with inversion recovery and Hahn spin-echo methods, respectively. For T1 relaxation time measurements an inversion recovery method was executed with a 10 ms hyperbolic secant inversion pulse (2 kHz bandwidth) followed by a 2 ms crusher gradient, an variable inversion delay TI, a 0.5 ms non-selective excitation pulse and a recovery delay TR. Twelve inversion delays, non-linearly spaced between 10 and 2,560 ms (in vivo, TR 3,000 ms), and nineteen inversion delays, non-linearly spaced between 10 and 3000 ms (in vitro, TR 2,560 ms), were acquired, respectively. For T2 relaxation time measurements spin-echo formation was achieved with non-selective 0.5 ms excitation and 1.0 ms refocusing square pulses, respectively. Twelve echo-times, non-linearly spaced between 10 and 400 ms (in vivo, TR 2,000 ms), and twenty-seven echo-times, non-linearly spaced between 10 and 2000 ms (in vitro, TR 2,000 ms) were acquired. T1 and T2 relaxation data were analysed with three () and two () parameter fits, respectively. In vivo T2 relaxation data of water was analysed with a bi-exponential fit, to account for the intracellular and extracellular compartmentalized water in vivo (1). All relaxation data were simultaneously fitted in 2D across the spectral and temporal (TI or TE) dimensions.
In vivo measurements included two subjects and in vitro measurements were performed with and without agarose. All T1/T2 data were acquired with 16 (in vivo) or 50 (in vitro) averages as 256 complex points over a 2.5 kHz spectral width. The scan times for the entire inversion recovery and spin echo series were 9 and 6 mins (in vivo), respectively, and 40 and 45 mins (in vitro), respectively. All T1 and T2 values were determined as mean ± standard deviation.
DMI
The DMI pulse sequence consisted of a 0.5 ms square excitation pulse, followed by 3D trapezoidal phase encoding gradients (2 ms duration) and spectroscopic signal acquisition of 256 complex points over 2.5 kHz spectral width (102.4 ms acquisition time). The phase-encoding gradients were chosen to correspond to a spherical k-space sampling scheme. The 17O nucleus, as recognized by the IDEA Siemens’ software, was used as the method ‘front-end’, whereby the 2H Larmor frequency was used internally to ensure proper gradients calculation. A typical DMI protocol in vivo consisted of the acquisition of an anatomical 1H 3D MR image acquired using MP-RAGE (16), following by second-order shimming and the acquisition of non-localized 2H MR spectra. T1-weighted MP-RAGE images were acquired with a 900 ms inversion time as a 192 x 256 x 96 matrix across a 192 x 256 x 192 mm field-of-view (TR 3,000 ms).
The final scans consisted of 3D DMI acquired as 14 x 18 x 14 matrix (TR = 350 ms, 90° nutation, spherical k-space sampling) over a 192 x 256 x 192 mm FOV (voxel size = 14 x 14 x 14 mm3, 2.7 mL nominal, isotropic resolution). The relatively long TR was chosen to minimize T1 saturation on the metabolite signals, while still allowing significant signal averaging. The SNR gains for shorter TR were explored during the acquisition of higher-resolution DMI data. Specifically, for an identical FOV, additional DMI matrix sizes included 16 x 20 x 16 (1.8 mL nominal, isotropic resolution) and 19 x 25 x 9 (2.2 mL nominal, anisotropic resolution) with TR = 250 ms and 60° nutation. Each DMI scan (4 averages) resulted in a total scan duration of circa 28 mins for all three matrix sizes. All DMI data were processed in DMIWizard (12) with processing steps that included spectral zero filling and apodization, 4D FFT and spectral fitting with up to four Lorentzian lines corresponding to water, glucose, glutamate+glutamine (Glx) and lactate/lipids. Upon data pre-processing, the linear phase roll introduced by the missing FID points due to the phase-encoding-related delay between excitation and signal acquisition was corrected by linear prediction. Spectral fitting was based on a linear combination of model spectra (LCM), using a pre-generated basis set. DMI maps of signal intensity based on spectral fitting of individual 2H resonance peaks were overlayed onto the MRI and displayed with ROI selection delineating the brain and interpolation based on convolution with a Gaussian kernel. The signal-to-noise ratio (SNR) was calculated across individual pixels as the signal height over the standard deviation of the noise (as measured between 15 – 20 ppm downfield of water). Metabolic maps for glucose and Glx were converted to absolute concentration by division with the water map and assuming a natural abundance water concentration of 10.12 mM (1). 2H label loss for Glx was corrected based on previously established values (17).
3. Results
B1+ maps and EM simulations
Figure 2 shows experimental and simulated deuterium B1+ maps obtained on a phantom and human head model Duke, respectively. The experimental B1+ maps (Fig. 2A) were calculated by fitting the sinusoidal signal dependence on the transmit voltage (Fig. 2B) for every pixel. The final conversion from Hz/V to μT per 1 W power rested on the 2H-specific relation 1 μT/W = 0.92 Hz/V. The voltage required to achieve a 90° nutation angle increased with the distance from the 2H coil elements, leading to a lower B1+ transmit amplitude in the center (1.89 μT, blue pixel/line) and higher B1+ transmit amplitudes towards the edges (2.20 and 2.34 μT for green and red pixels/lines) for 1 W input power. The average B1+ field (mean ± standard deviation) measured across entire phantom was 2.05 ± 0.44 μT/W and 2.25 ± 0.34 μT/W across the axial plane shown in Fig. 2A (left). Fig. 2C shows the simulated B1+ maps across three perpendicular planes. Overall, the spatial B1+ distribution is in excellent agreement with the experimental data shown in Fig. 2A. The simulated B1+ amplitude across the axial plane is 2.44 ± 0.30 μT/W, which compares to 2.17 ± 0.20 μT/W when the experimental data is analyzed over the human head model area (black dotted lines). While the simulated B1+ amplitudes are overestimated by 10-15%, as has been observed previously (11), it will lead to only a small overestimation of the maximum local SAR. Fig. 2D shows the calculated SAR10g map for 1 W input power. Experimentally, the time-averaged input power for DMI (2.7 mL nominal resolution) was 1.8 W. In combination with the maximum local SAR10g of 0.33 W/kg (Fig. 2D), the predicted maximum local SAR10g for DMI is 0.59 W/kg. The maximum global, time-averaged input power limit was set to 2.0 W, thereby allowing all DMI, T1 and T2 scans to be performed while staying far below the SAR10g limits for human brain of 3.0 W/kg. Supporting Information Figure S1 contains simulated B1+ and SAR maps for 1H and 2H and for both Duke and Ella human head models.
Figure 2:
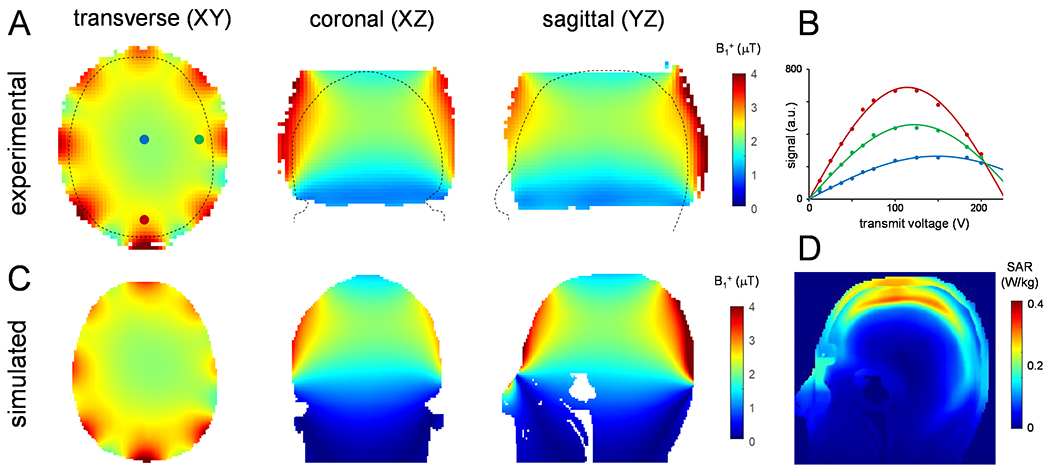
(A) Experimental and (C) simulated RF transmit B1+ maps for 2H at 7 T in the transversal (axial), coronal and sagittal orientations. The experimental B1+ maps, acquired on a 4% deuterated water phantom, were calculated from the sinusoidal dependence of 2H signal on transmit voltage during a 1.0 ms square excitation pulse, as shown for three example points in (B). The outline of the simulated head model (Duke) is overlaid on the maps in (A). (D) Sagittal SAR10g map averaged over 10 g of tissue at 46 MHz simulated for a 1 W input power. B1+ maps for 1H (297.2 MHz) and SAR10g simulations at 46 MHz and 297.2 MHz using Duke and Ella models are shown in Supporting Information Figure S1.
T1 and T2 relaxation time measurements
The 2H 1D MR spectra in vivo and in vitro (Figure 3A and C, and Supporting Information Figure S2) resulted in well separated resonances of deuterated water, glucose, and Glx at 4.7 ppm, 3.8 ppm, 2.3 ppm, respectively (in vivo), and water and glucose at 4.7 ppm and 3.8 ppm, respectively (in vitro). The signal observed in vivo at 1.3 ppm represents the sum of natural abundance lipid 2H signals originating from the scalp and 2H-enriched lactate formed through active metabolism, primarily within the brain. Since the lactate and lipid contributions cannot be separated in global 2H MR spectra, they are analyzed as a single lactate/lipid signal. The inversion recovery data, fitted simultaneously for all four resonances and all inversion delays, was well approximated with pure Lorentzian line shapes, providing T1 relaxation times summarized in Fig. 3E. The spin echo data was equally well approximated with Lorentzian lines, but required double-exponential T2 relaxation for water, whereby the short (T2 = 29 ± 1 ms, 82.5% of total water) and long-T2 (T2 = 412 ± 40 ms, 17.5% of total water) water components are tentatively assigned to tissue and ventricular water, respectively. T1 and T2 relaxation measurements on phantoms in vitro are summarized in Supporting Information Figure S2. Overall, the resulting 2H T1 and T2 relaxation times constants of deuterated metabolites in vivo and in vitro at 7 T are in close agreement with those reported on adjacent magnetic field strengths (1,5,8).
Figure 3:
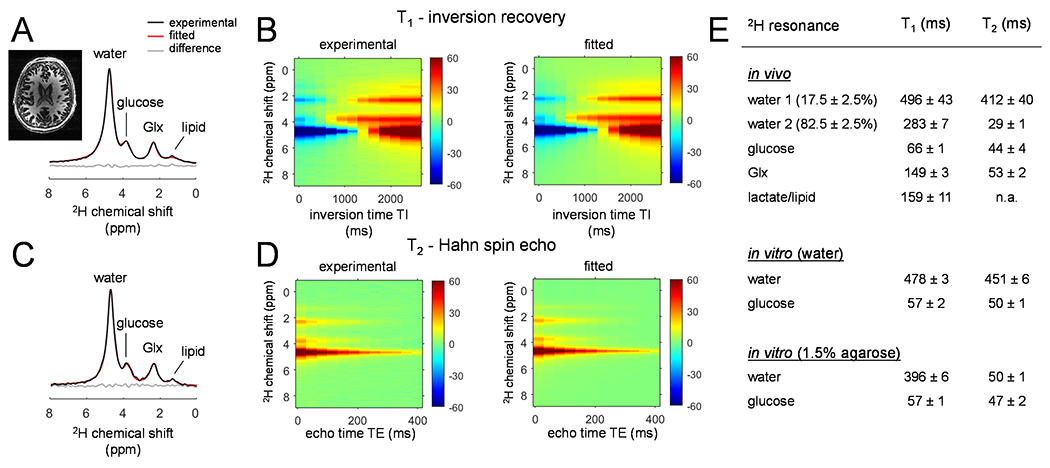
(A, C) Non-localized 2H 1D MR spectra acquired from the human brain in vivo at 7 T circa 120 min following [6,6’-2H2]-glucose oral administration. The spectra were acquired (A) at the longest inversion delay (TI = 2,560 ms) and (C) the shortest echo-time (TE = 10 ms) during T1 and T2 measurements, respectively. (B, D) Experimental (left) and fitted (right) (B) T1 inversion recovery and (D) T2 spin-echo data, comprising of multiple chemical shifts modulated across 12 inversion and 12 echo delays, respectively. (E) Summary of the in vivo and in vitro T1 and T2 relaxation times. The T2 of lactate/lipids could not reliably be obtained due to the low sensitivity.
DMI
The T1-weighted MP-RAGE images of human brain in vivo were generally of high-quality with good anatomical resolution and contrast between cortical gray matter, white matter, and cerebrospinal fluid (Fig. 4A), confirming the excellent high-field performance of multi-channel 1H transreceive arrays previously reported (8,11). The DMI data displayed good whole-brain coverage (Fig. 4A) with high sensitivity and spectral resolution across all axial planes. The magnetic field homogeneity across the inferior planes was lower compared to the superior planes, but the spectral resolution remained sufficiently high to separate all resonances. The 2H MR spectra extracted from the indicated voxel positions revealed well separated resonances of deuterated water, glucose, and Glx at 4.7 ppm, 3.8 ppm and 2.3 ppm, respectively (Fig. 4C). In addition, a small signal at circa 1.3 ppm was present in most brain voxels, representing 2H-labeled lactate formed through active metabolism (i.e., glycolysis). Occasionally, an elevated signal was observed in brain edge voxels due to contributions from natural abundance 2H lipid signals, aided by the high receive sensitivity at those locations.
Figure 4:
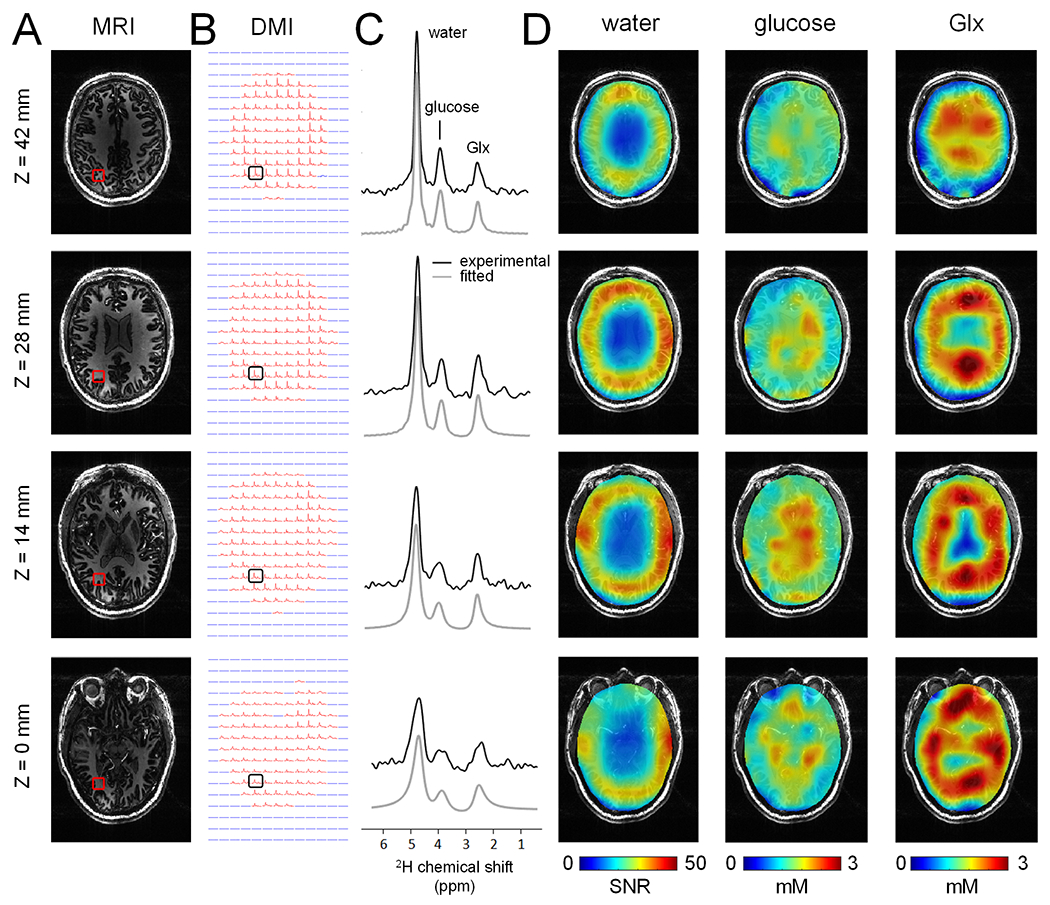
(A) T1-weighted MP-RAGE MRIs and (B) DMIs (2.7 mL nominal resolution) displayed as multiple axial planes extracted from 3D datasets, acquired from a single human brain in vivo at 7 T between 75-105 min following oral administration of [6,6’-2H2]-glucose in water. (C) Localized 2H MR spectra from the positions indicated in (B), demonstrating a clear and reproducible pattern of well-separated 2H-labeled signals from water, glucose and Glx. (D) Water SNR map (left) and glucose (middle) and Glx (right) metabolic maps reconstructed from the data in (B). The division of glucose and Glx by water provides quantitative concentration maps, but also removes the coil dependent spatial B1 receive profile.
All DMI spectra above an intensity threshold (red spectra in Fig. 4B) were successfully fitted with four Lorentzian lines (gray lines in Fig. 4C), after which the individual resonances could be displayed as metabolic maps. Fig. 4D shows water SNR maps with values ranging from 35 to 65 in the periphery of the brain near the receive elements and decreasing to 15-35 near the center of the brain. Fig. 4D also shows glucose/water and Glx/water DMI maps, where the division by the water map removes the B1-dependent signal distribution and allows the calculation of absolute glucose and Glx metabolite levels. Whereas the glucose maps are relative homogeneous across the brain, the Glx maps display reduced signal in the ventricles, known to contain little to no Glx. The SNR in the indicated voxel position for the selected axial slices were (from the top to bottom) SNR = 14.4, 11.1, 7.0 and 4.7 for glucose, and SNR = 7.8, 9.9, 9.5 and 7.4 for Glx.
Fig. 5 shows MRI and DMI results across multiple subjects. The overall DMI quality in terms of sensitivity and resolution is comparable between subjects. The level of B1 heterogeneity as seen on the water SNR maps (Fig. 5D) is also comparable between subjects, as expected, since the heterogeneity primarily arises from the RF coil geometry. The in vivo signal-to-noise ratio (SNR) of the water, glucose, and Glx resonances was evaluated for all subjects across two spatial regions, namely (1) the central region (~ 4 x 6 cm) and (2) the resulting rim. The SNR for water, glucose and Glx for all subjects and both regions is summarized in Fig. 5E. The SNR for the specific voxel location shown in Fig. 5A/B are 42.4, 50.6 and 43.2 for water (subjects 1 –3), 4.9, 11.1 and 8.7 for glucose and 15.3, 9.9 and 10.6 for Glx.
Figure 5:
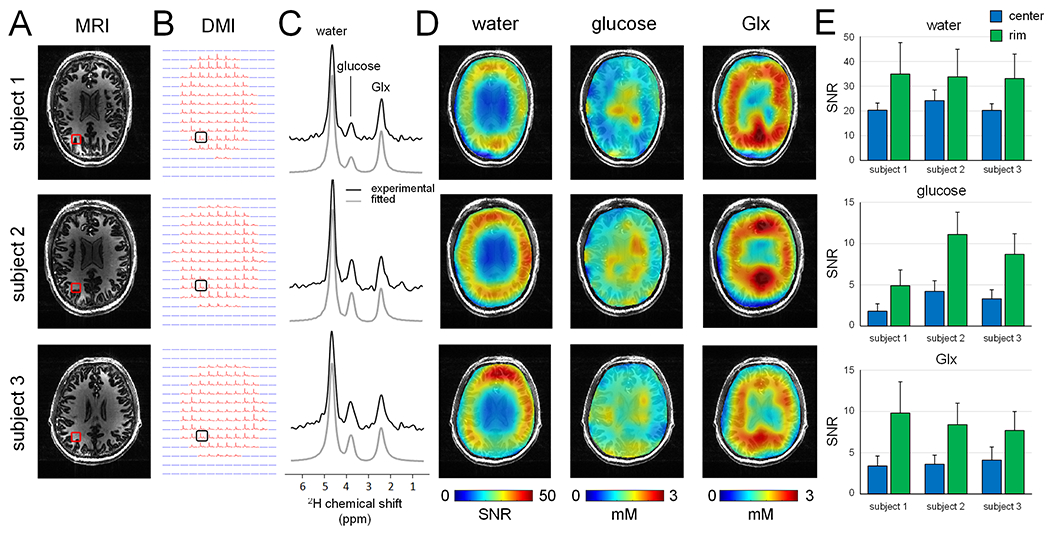
(A) T1-weighted MP-RAGE MRIs and (B) DMIs (2.7 mL nominal resolution) acquired from multiple human subjects in vivo at 7 T between 60 and 105 min following oral administration of [6,6’-2H2]-glucose in water. (C) Localized 2H MR spectra from the positions indicated in (B), revealing a consistent and high-quality spectral pattern across different subjects. Water SNR map (left) and glucose (middle) and Glx (right) metabolic maps reconstructed from the data in (B). (E) Summary of SNR values for water (top), glucose (middle) and Glx (bottom) for all three subjects, analysed for data in the coil center (blue area in water SNR maps in (D)) and at the coil rim/edge. All values represent mean ± standard deviation.
Two additional DMI datasets acquired with a higher spatial resolution (circa 2 mL) are shown in Fig. 6 and compared to the standard 2.7 mL DMI data. On subject 2 (top two rows), the isotropic 14 mm (or 2.7 mL) DMI data is compared to an isotropic 12 mm (or 1.8 mL) dataset, whereas on subject 3 (bottom two rows), the standard 2.7 mL DMI data was compared to a non-isotropic 10 x 10 x 21 mm (or 2.2 mL) dataset. In both cases, the finer in-plane DMI grid provides improved spatial detail at the cost of a reduced SNR. The quantitative SNR values for the selected center and rim voxels are shown in Fig. 6E, with an approximate 25-40% SNR decrease for the higher spatial resolution DMI. Note that the DMI maps in Fig. 6D were processed without spatial smoothing to show the actual decrease in nominal voxel size.
Figure 6:
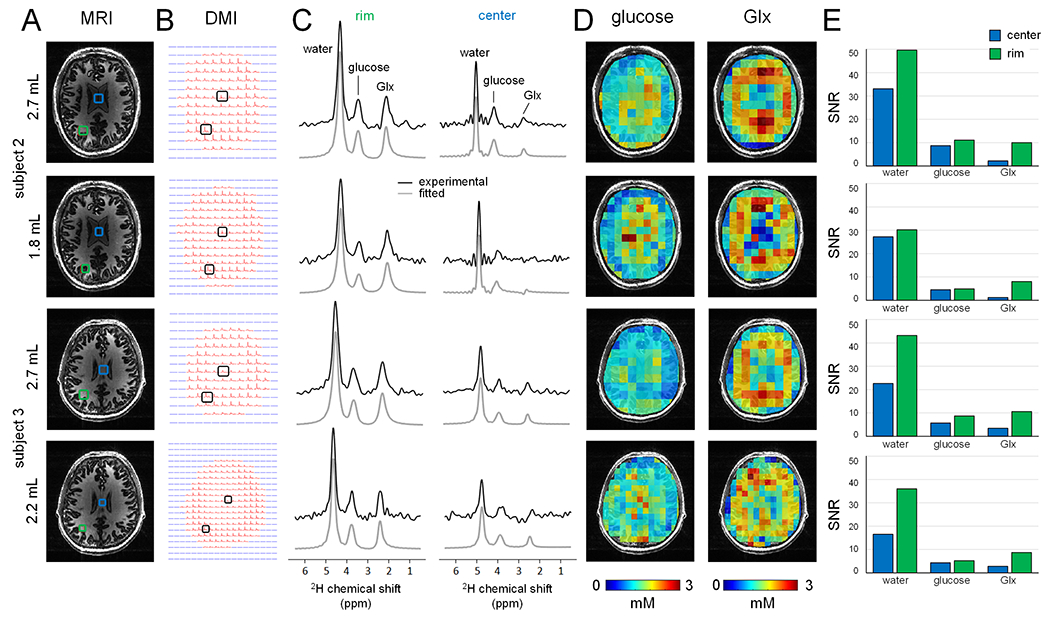
(A) T1-weighted MP-RAGE MRIs and (B) DMIs acquired from two human subjects in vivo at 7 T at multiple spatial resolutions for DMI. For subject 2, a standard DMI acquisition (2.7 mL nominal resolution acquired between 75-105 min, first row) is compared to an isotropic 1.8 mL DMI dataset (acquired between 105-135 min, second row). For subject 3, a standard DMI acquisition (2.7 mL nominal resolution acquired between 60-90 min, third row) is compared to an anisotropic 2.2 mL DMI dataset (acquired between 90-120 min, bottom row). (C) Localized 2H MR spectra from the rim/edge (left) and center (right) positions shown in (A). (D) Glucose and Glx metabolic maps. Note that the metabolic maps are displayed at the nominal resolution without spatial interpolation to highlight the actual improvement in spatial resolution. (E) Summary of SNR values for water, glucose and Glx for all spatial resolution, analysed for data in the coil center (blue bars) and at the coil rim/edge (green bars). The higher resolution DMI data generally resulted in a 25 – 40% SNR decrease.
Discussion
Here we have presented DMI of [6,6’-2H2]-glucose metabolism across the entire human brain at 7 T with a nominal, isotropic resolution of 14 x 14 x 14 mm or 2.7 mL in 28 min. Well-resolved signals from 2H-labeled water, glucose, and glutamate/glutamine (Glx) were observed throughout the brain, including areas with highly heterogenous magnetic fields, such as the frontal and temporal lobes.
Previous work on the magnetic field dependence of DMI has established a supra-linear relationship between 2H SNR and magnetic field strength B0 according to SNR ~ B01.7 for surface coils suitable for human studies (7). Using this relationship, it is predicted that the 2H SNR at 7 T is 4.2 and 2.6 times higher than that at 3 T and 4 T, respectively. Previous DMI studies at 4 T were acquired at a nominal resolution of 8 mL in 29 min (1), representing a 2.9-fold decrease in (time-normalized) SNR. While a direct SNR comparison between the four-element 4 T and eight-element 7 T coils is difficult, the experimentally observed difference in nominal resolution is in line with the theoretical prediction. The recent DMI results from Kaggie et al (18) at 3 T were acquired at a nominal resolution of 32.8 mL in 10 min, or equivalently 18.9 mL in 30 min. While the experimental resolution represents a significant deviation from the predicted value of ~13 mL in 30 min, the discrepancy is likely explained by the use of a lower-sensitivity, four-rung 2H birdcage coil. Implementation of a dedicated, multi-element receiver will likely boost the 3 T SNR and resolution closer to the theoretical prediction. The SNR gains of DMI will continue beyond 7 T and recent work from Ruhm et al (8) at 9.4 T has demonstrated high-quality DMI at a nominal resolution of 3.0 mL in 10 min or equivalently 1.7 mL in 30 min.
The presented DMI studies used a custom designed RF coil, built as a fully integrated combination of 1H and 2H transceiver arrays with optimized central SNR (8,11). This coil design provides a relatively homogeneous B1+ transmit field across the entire brain (Fig. 2), while the relatively low number of larger receive elements provides high SNR 2H signal reception in the brain periphery, close to the receive coil elements. Intrinsic to a RF array coil design the sensitivity in the center of the brain is 25-40% lower than the periphery (Fig. 5). Consequently, the spectral SNR in the brain center was ultimately the dominant factor that set the spatial resolution. It should be noted that the SNR for metabolites in the brain center could be reduced even further due to the lack of metabolites (especially glutamate/glutamine (Glx)) in the ventricles. An alternative RF coil design for whole brain DMI with minimal differences in SNR between the periphery and the center could be a birdcage coil. While successfully used for DMI at 3 T (18), the birdcage coil comes at the cost of a reduced SNR in the periphery of the brain compared to the coil design used in the present study.
Phantom and in vivo measurements of T1 and T2 values agree with previous reports, falling in the range of values reported for 4 T up to 16.6 T (1,5,8). For all magnetic fields, brain water has the longest T1 (~300-400 ms) and the shortest T2 (~20-30 ms), with biexponential T2 relaxation observed for mixtures of brain and ventricular water. Glucose and Glx have much shorter T1 values (~50-150 ms), while retaining sufficiently long T2s (~30-45 ms). The relatively short T1, and sufficiently long T2 values, are an essential aspect for the high SNR of DMI. The short T1 values of 2H-labeled metabolites allows for an SNR increase through extensive signal averaging, whereas the relatively long T2 values ensure sufficiently high spectral resolution to separately detect the deuterated substrates and main metabolic products. The T1 and T2 values reported here at 7 T also support the notion that deuterium relaxation characteristics are minimally affected by magnetic field strength. Here we acquired DMI data with a relatively long TR of 333 ms, leading to near-complete signal recovery for glucose and Glx and thus a minimal correction of T1 saturation effects. Improved SNR can be obtained with shorter TRs and lower (Ernst) nutation angles that allow for increased signal averaging. Changing the acquisition from (TR, α) = (333 ms, 90°) to (75 ms, 53°), whereby 53° represent the Ernst angle for Glx, improves the Glx SNR by 17%. The modest increase in SNR is offset by an increased and signal-dependent T1 saturation correction. A more substantial SNR gain can be achieved when the transverse magnetization is preserved during short-TR acquisition methods. Peters et al. (19) have shown several-fold SNR enhancement with multi-echo steady-state free precession (SSFP) DMI at 15.2 T. While the increase RF power deposition and off-resonance effects of SSFP methods are a consideration, SSFP-based DMI holds promise to substantially improves the attainable SNR even at clinically relevant magnetic fields.
The current study was focused on the detection of regional metabolic profiles of deuterated glucose and its metabolic products during approximate isotopic steady-state, circa 60-90 min following the oral administration of [6,6’-2H2]-glucose. The primary motivation for this focus is the clinical relevance and feasibility of steady state measurements on challenging patient populations (1). However, like other isotope turnover methods, such as 13C, hyperpolarized 13C, 15N and 17O MRS, DMI is also capable of detecting absolute flow through metabolic pathways by acquiring data in a dynamic, time-resolved manner. Ruhm et al. (8) acquired dynamic DMI data at 9.4 T with a 10 min temporal resolution to detect difference in oxidative metabolism between gray and white matter. While the highest accuracy and precision are achieved when the acquisition is combined with an intravenous substrate infusion (20), metabolic rates can still be determined with oral glucose administration (8,20). It should be noted that isotopic steady-state is typically not achieved with oral dosing and the 13C (20) or 2H (8) labeled Glx signal can continue to increase up to and beyond two hrs following the glucose administration. Nevertheless, oral administration of glucose in combination with a single 30 min DMI acquisition during approximate isotopic steady-state appears to be the most viable route to enable DMI in a clinical setting. In addition, the clinical value of DMI further increases when it can be combined with multi-contrast MRIs within the same scan session without prolonging the overall scan duration. This can be achieved through the interleaved acquisition of DMI and MRI as was recently demonstrated for FLAIR MRI at 4 T (21). Similar acquisition strategies have been shown for 1H/23Na (22) and 1H/31P (23) at 7 T, making the development of a comprehensive neurological MRI protocol interleaved with DMI a promising direction for future clinical DMI applications at 7 T. The enhanced spatial resolution (2.7 mL) at 7 T should proof ideal to study patients with smaller brain lesions, such as those encountered in brain metastases and multiple sclerosis.
Conclusion
Here we have demonstrated the successful implementation of 3D DMI in the human brain in vivo on a 7 T Siemens clinical MR platform. Both spatial and temporal nominal resolutions achieved at 7 T, i.e. 2.7 mL and 28 mins, respectively, were close to those predicted theoretically and greatly outperformed those at lower magnetic fields. DMI at 7 T and beyond has clear potential in applications dealing with small lesions, such as multiple sclerosis or small tumor metastases.
Supplementary Material
Acknowledgements
This work was supported by NIH funding through grant R01 EB025840.
References
- 1.De Feyter HM, Behar KL, Corbin ZA, Fulbright RK, Brown PB, McIntyre S, Nixon TW, Rothman DL, de Graaf RA. Deuterium metabolic imaging (DMI) for MRI-based 3D mapping of metabolism in vivo. Sci Adv 2018;4(8):eaat7314. [DOI] [PMC free article] [PubMed] [Google Scholar]
- 2.De Feyter HM, de Graaf RA. Deuterium metabolic imaging - Back to the future. J Magn Reson 2021;326:106932. [DOI] [PMC free article] [PubMed] [Google Scholar]
- 3.de Graaf RA, Rothman DL, Behar KL. State of the art direct 13C and indirect 1H-[13C] NMR spectroscopy in vivo. A practical guide. NMR Biomed 2011;24:958–972. [DOI] [PMC free article] [PubMed] [Google Scholar]
- 4.Rothman DL, de Graaf RA, Hyder F, Mason GF, Behar KL, De Feyter HM. In vivo 13C and 1H-[13C] MRS studies of neuroenergetics and neurotransmitter cycling, applications to neurological and psychiatric disease and brain cancer. NMR Biomed 2019;32(10):e4172. [DOI] [PubMed] [Google Scholar]
- 5.Lu M, Zhu XH, Zhang Y, Mateescu G, Chen W. Quantitative assessment of brain glucose metabolic rates using in vivo deuterium magnetic resonance spectroscopy. J Cereb Blood Flow Metab 2017;37:3518–3530. [DOI] [PMC free article] [PubMed] [Google Scholar]
- 6.Harris RK, Becker ED, Cabral de Menezes SM, Goodfellow R, Granger P. NMR nomenclature: nuclear spin properties and conventions for chemical shifts. IUPAC recommendations 2001. Pure Appl Chem 2001;73:1795–1818. [DOI] [PubMed] [Google Scholar]
- 7.de Graaf RA, Hendriks AD, Klomp DWJ, Kumaragamage C, Welting D, Arteaga de Castro CS, Brown PB, McIntyre S, Nixon TW, Prompers JJ, De Feyter HM. On the magnetic field dependence of deuterium metabolic imaging. NMR Biomed 2020;33:e4235. [DOI] [PMC free article] [PubMed] [Google Scholar]
- 8.Ruhm L, Avdievich N, Ziegs T, Nagel AM, De Feyter HM, de Graaf RA, Henning A. Deuterium metabolic imaging in the human brain at 9.4 Tesla with high spatial and temporal resolution. Neuroimage 2021;244:118639. [DOI] [PMC free article] [PubMed] [Google Scholar]
- 9.Kreis F, Wright AJ, Hesse F, Fala M, Hu DE, Brindle KM. Measuring tumor glycolytic flux in vivo by using fast deuterium MRI. Radiology 2020;294:289–296. [DOI] [PubMed] [Google Scholar]
- 10.Simões RV, Henriques RN, Cardoso BM, Fernandes FF, Carvalho T, Shemesh N. Glucose fluxes in glycolytic and oxidative pathways detected in vivo by deuterium magnetic resonance spectroscopy reflect proliferation in mouse glioblastoma. Neuroimage Clin 2022;33:102932. [DOI] [PMC free article] [PubMed] [Google Scholar]
- 11.Avdievich NI, Ruhm L, Dorst J, Scheffler K, Korzowski A, Henning A. Double-tuned 31/1H human head array with high performance at both frequencies for spectroscopic imaging at 9.4T. Magn Reson Med 2020;84:1076–1089. [DOI] [PubMed] [Google Scholar]
- 12.de Graaf RA. DMIWizard v1.3, available at https://medicine.yale.edu/lab/dmi/. 2021. [Google Scholar]
- 13.Hartsgrove G, Kraszewski A, Surowiec A. Simulated biological materials for electromagnetic radiation absorption studies. Bioelectromagnetics 1987;8:29–36. [DOI] [PubMed] [Google Scholar]
- 14.Duan Q, Duyn JH, Gudino N, de Zwart JA, van Gelderen P, Sodickson DK, Brown R. Characterization of a dielectric phantom for high-field magnetic resonance imaging applications. Med Phys 2014;41:102303. [DOI] [PMC free article] [PubMed] [Google Scholar]
- 15.Hoffmann J, Henning A, Giapitzakis IA, Scheffler K, Shajan G, Pohmann R, Avdievich NI. Safety testing and operational procedures for self-developed radiofrequency coils. NMR Biomed 2016;29:1131–1144. [DOI] [PubMed] [Google Scholar]
- 16.de Lange EE, Mugler JP 3rd, Bertolina JA, Gay SB, Janus CL, Brookeman JR. Magnetization prepared rapid gradient-echo (MP-RAGE) MR imaging of the liver: comparison with spin-echo imaging. Magn Reson Imaging 1991;9:469–476. [DOI] [PubMed] [Google Scholar]
- 17.de Graaf RA, Thomas MA, Behar KL, De Feyter HM. Characterization of kinetic isotope effects and label loss in deuterium-based isotopic labeling studies. ACS Chem Neurosci 2021;12:234–243. [DOI] [PMC free article] [PubMed] [Google Scholar]
- 18.Kaggie JD, Khan AS, Matys T, Schulte RF, Locke MJ, Grimmer A, Frary A, Menih IH, Latimer E, Graves MJ, McLean MA, Gallagher FA. Deuterium metabolic imaging and hyperpolarized 13C-MRI of the normal human brain at clinical field strength reveals differential cerebral metabolism. Neuroimage 2022;257:119284. [DOI] [PubMed] [Google Scholar]
- 19.Peters DC, Markovic S, Bao Q, Preise D, Sasson K, Agemy L, Scherz A, Frydman L. Improving deuterium metabolic imaging (DMI) signal-to-noise ratio by spectroscopic multi-echo bSSFP: A pancreatic cancer investigation. Magn Reson Med 2021;86:2604–2617. [DOI] [PubMed] [Google Scholar]
- 20.Mason GF, Falk Petersen K, de Graaf RA, Kanamatsu T, Otsuki T, Rothman DL. A comparison of 13C NMR measurements of the rates of glutamine synthesis and the tricarboxylic acid cycle during oral and intravenous administration of [1-13C]glucose. Brain Res Brain Res Protoc 2003;10:181–190. [DOI] [PubMed] [Google Scholar]
- 21.Liu Y, De Feyter HM, Fulbright RK, McIntyre S, Nixon TW, de Graaf RA. Interleaved Fluid-attenuated Inversion Recovery (FLAIR) MRI and Deuterium Metabolic Imaging (DMI) on human brain in vivo Magn Reson Med 2022;88:28–37. [DOI] [PMC free article] [PubMed] [Google Scholar]
- 22.Yu Z, Madelin G, Sodickson DK, Cloos MA. Simultaneous proton magnetic resonance fingerprinting and sodium MRI. Magn Reson Med 2020;83:2232–2242. [DOI] [PMC free article] [PubMed] [Google Scholar]
- 23.Niess F, Schmid AI, Bogner W, Wolzt M, Carlier P, Trattnig S, Moser E, Meyerspeer M. Interleaved 31P MRS/1H ASL for analysis of metabolic and functional heterogeneity along human lower leg muscles at 7T. Magn Reson Med 2020;83:1909–1919. [DOI] [PMC free article] [PubMed] [Google Scholar]
Associated Data
This section collects any data citations, data availability statements, or supplementary materials included in this article.