

Abstract
Background
Previous studies proved that AURKA functions as an oncogene in several cancers. This article aimed to probe the miRNA‐induced regulatory mechanism of AURKA in hepatocellular carcinoma (HCC).
Methods
Differentially expressed genes in TCGA‐LIHC dataset were screened by bioinformatics methods. Levels of miR‐199b‐3p and AURKA mRNA were examined by qRT‐PCR. Western blot was utilized to evaluate protein levels of AURKA, p‐AKT, and AKT. Dual‐luciferase assay was introduced to explore their interaction. MTT, colony formation, scratch healing, transwell, and flow cytometry assays were introduced into cell proliferation, migration, invasion, and apoptosis assessment. The impact of miR‐199b‐3p/AURKA axis on HCC tumor growth was determined in a tumor xenograft model.
Results
We found that AURKA was highly expressed in HCC and was coupled to poor prognosis of HCC. As manifested by cellular assays, compared to the normal cells HL‐7702, AURKA presented notably high expression in HCC cell lines. Overexpressed AURKA evidently impelled the proliferation, colony formation, migration, and invasion of HCC cells while suppressing apoptosis. The regulatory gene upstream of AURKA was predicted to be miR‐199b‐3p by bioinformatics method, and there was a markedly negative correlation between the two. Overexpressed miR‐199b‐3p constrained HCC cell proliferation, migration, and invasion while fostering apoptosis, which could be counteracted by upregulating AURKA. MiR‐199b‐3p repressed the tumor growth in vivo by targeting AURKA and affected PI3K/AKT signaling pathway.
Conclusion
To summarize, this study implied the regulatory mechanism of miR‐199b‐3p/AURKA axis in HCC, and supplied optional therapeutic targets for HCC patients.
Keywords: AURKA, hepatocellular carcinoma, invasion, migration, miR‐199b‐3p, proliferation
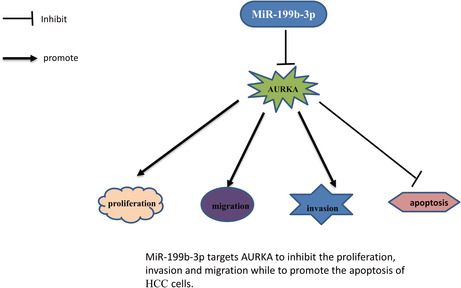
MiR‐199b‐3p targets AURKA to inhibit the proliferation, invasion, and migration to promote the apoptosis of HCC cells.
1. INTRODUCTION
AURKA is a highly conserved serine/threonine protein kinase. It participates in the process of mitosis, and its abnormal expression may result in cancers. 1 AURKA can phosphorylate RPS6KB1, thereby accelerating gastrointestinal cancer cell proliferation. 2 In ovarian cancer cells, overexpressed AURKA boosts cell proliferation while constraining cell apoptosis. 3 Inhibition of AURKA expression causes the cell proliferation of liver cancer cells to decrease. 4 Nevertheless, its mechanisms in HCC are not fully understood, which is why we focused on this gene as our research object. Here, we identified through bioinformatics analyses and experimental verifications that AURKA activated the malignant progression of HCC cells, which was regulated by the upstream miR‐199b‐3p.
A certain class of miRNAs can affect tumor growth by suppressing the expressions of the matching genes, 5 where these miRNAs serve as tumor promotors or suppressors. As the previous studies pointed out, miRNAs were considered as promising cancer biomarkers, potentially for the prognosis of HCC patients. 6 , 7 As can be seen, studying and clarifying molecular mechanisms of miRNA in cancer are much favorable for the development of cancer diagnosis, treatment, and prognosis strategies. A study published by Xiaoou Wang mentioned miR‐199b‐3p as a potential HCC prognostic biomarker based on his bioinformatics prediction. 8 Despite the above study, no study specifically studied the impact of miR‐199b‐3p on HCC, while in our work we identified its tumor suppressing roles in HCC to some extent.
Taking AURKA as the research object, this study explained the biological functions of AURKA in HCC and verified its upstream regulatory gene through bioinformatics analyses and dual‐luciferase assay. Our findings may offer new potential targets for targeted therapy of HCC.
2. MATERIALS AND METHODS
2.1. Bioinformatics analyses
Four sets of HCC mRNA chip data were acquired from the gene expression omnibus (GEO) database, namely GSE101728 (normal: 7, tumor: 7), GSE25097 (normal: 243, tumor: 268), GSE76427 (normal: 52, tumor: 115), and GSE84005 (normal: 38, tumor: 38). The R package “limma” was performed for the differential analysis on the four sets of chip data (|logFC| >1.0, p adj < 0.05), and then “RobustRankAggreg” was employed to perform RANK analysis on the results of the differential analysis to screen out the differential mRNAs in tumor tissue of HCC patients. The STRING database (https://string‐db.org/) was applied for the analysis of protein interaction network, and the confidence score more than or equal to 0.7 was selected as the threshold. Core degree of the gene was calculated to identify the target mRNA. At the same time, mature hepatocyte miRNA (normal: 50, tumor: 375), mRNA expression data (normal: 50, tumor: 374), and clinical data (April 27, 2020) were obtained from The Cancer Genome Atlas (TCGA). The “edgeR” package was employed to conduct differential analysis between the two groups (|logFC| >1, p adj < 0.05) to obtain differential miRNAs. StarBase and mirDIP databases were applied to predict upstream miRNAs of target mRNA, and then prediction results were intersected with differential miRNAs to identify the miRNA that has binding sites with target mRNA. The “survival” package was employed to perform survival analysis on the target mRNA and the corresponding miRNA in TCGA‐LIHC dataset. Meanwhile, the differential analysis of their expression levels was carried out to research the upstream regulatory miRNA and its target gene affecting HCC.
2.2. Cell cultivation
HCC cell lines HepG2 (BNCC250675), Hep3B (BNCC289780), and SK‐HEP1 (BNCC312361) were purchased from BeNa Culture Collection. HCC cell line Huh‐7 (CL0166) and human hepatic normal cell line HL‐7702 (CL0192) were acquired from Fenghui Biotechnology, Co., Ltd. Cells were incubated in Dulbecco's modified Eagle's medium (DMEM) plus 10% fetal bovine serum (FBS) (Gibco BRL) and stored at 37°C in an incubator with 5% CO2.
2.3. Clinical tissue samples
Thirty cases of HCC tumor tissue samples and paired adjacent tissue samples were collected in the Second Affiliated Hospital Zhejiang University School of Medicine from July 15, 2021 to September 15, 2021, marked as tumor and normal, respectively. The included patients did not receive any preoperative treatment and all signed written informed consent. The tissue specimens were immediately stored at −80°C until use. All experiments using patient samples were approved by the Ethics Committee of the Second Affiliated Hospital Zhejiang University School of Medicine.
2.4. Cell transfection
MiR‐199b‐3p and AURKA overexpression or silencing vectors, miR‐199b‐3p‐mimic (miR‐mimic) and its corresponding negative control NC‐mimic, miR‐199b‐3p‐agomir (miR‐agomir), NC‐agomir, miR‐199b‐3p‐inhibitor (miR‐inhibitor), and NC‐inhibitor were constructed. All vectors were obtained from GenePharma. MiR‐199b‐3p‐mimic, miR‐199b‐3p‐agomir, NC‐agomir, miR‐199b‐3p‐inhibitor, sh‐AURKA, and oe‐AURKA and their negative controls were transfected into the cell line HepG2 with Lipofectamine 2000 Reagent (Invitrogen, USA). Then, the transfected cells were placed 2 days under 37°C culture conditions with 5% CO2.
2.5. Isolation of total RNA and qRT‐PCR
The Trizol kit (Ambion) was employed for total RNA isolation. PrimeScript RT reagent kit (TaKaRa) was applied to synthesize complementary DNA (cDNA). Synergy Brands (SYBR) Premix ExTaq quantitative PCR kit (Thermo Fisher Scientific) and Light Cycler instrument (Roche, Switzerland) examined the levels of miR‐199b‐3p and AURKA mRNA. AURKA used GAPDH while miR‐199b‐3p applied U6 as an internal control. The 2−ΔΔCt value was applied to compare relative expression differences. The primer sequences are as given in Table 1.
TABLE 1.
qRT‐PCR primer sequences
| Gene | Primer sequence (5′ → 3′) |
|---|---|
| MiRNA‐199b‐3p | F: 5′‐GTCACAGTAGTCTGCACAT‐3′ |
| R: 5′‐GTGCAGGGTCCGAGGT‐3′ | |
| U6 | F: 5′‐TCCGACGCCGCCATCTCTA‐3′ |
| R: 5′‐TATCGCACATTAAGCCTCTA‐3′ | |
| AURKA | F: 5′‐GGAATATGCACCACTTGGAACA‐3′ |
| R: 5′‐TAAGACAGGGCATTTGCCAAT‐3′ | |
| GAPDH | F: 5′‐CAGGGCTGCTTTTAACTCTGGT‐3′ |
| R: 5′‐GATTTTGGAGGGATCTCGCT‐3′ |
2.6. Western blot
A protein extraction kit (Beyotime) was utilized to isolate total proteins from cells. Separated by 10% sodium dodecyl sulfate polyacrylamide gel electrophoresis, proteins were transferred to a polyvinylidene fluoride membrane. Then, the membrane was reacted with primary antibodies rabbit anti‐AURKA (1:1000, ab108353, Abcam), anti‐protein kinase B (AKT) (1:10,000, ab179463), anti‐phosphorylated‐AKT (p‐AKT) (1:1000, ab192623, Abcam), and rabbit anti‐GAPDH (1:10,000, ab8245, Abcam) at 4°C overnight. Subsequently, the membrane was incubated with secondary antibody goat anti‐rabbit IgG H&L (HRP) (1:2000, ab6721, Abcam) for 2 h at room temperature. Finally, an enhanced chemiluminescence kit (GE Healthcare) was applied to test protein expression.
2.7. MTT and colony formation assays
The transfected cells were seeded into 96‐well plates (2 × 10³ cells per well). At 1, 2, 3, and 4 days after cell seeding, 10 μl of MTT solution was added. Four hours later, 150 μl of dimethyl sulfoxide (DMSO) reagent (Sigma Aldrich) was supplemented to dissolve the crystals. The absorbance at 490 nm was assessed to evaluate cell proliferation.
5 × 10³ cells were plated to 6‐well plates and maintained at 37°C. Then, the cells were stained with 0.1% crystal violet (Sigma). The cell colonies which more than 50 cells were counted under the microscope.
2.8. Scratch healing and transwell assays
For scratch healing assay, the transfected cells were plated in six‐well plates with 2 × 10⁵ cells in each well. At 80% of cell confluence, a 200 μl pipette tip was employed to slowly and gently scratch across the center of the well to create the wound. After washing 3 times with medium without serum, the cells were cultivated on routine conditions. An optical microscope was implemented for observation at 0 and 24 h, respectively.
For transwell assay, transwell upper chamber was coated with a layer of matrix gel (BD Biosciences). Cells (1 × 10⁵) were suspended in serum‐free medium and seeded in the upper chamber, while DMEM with 10% FBS was put to the lower chamber. After cells were incubated under 5% CO2 and 37°C for 24 h, cells failed to invade to the other side were removed. Other cells were treated with Gentian Violet (Sigma, USA) for 10 min at room temperature, followed by cell counting using an optical microscope.
2.9. Flow cytometry
FITC‐annexinV apoptosis detection kit and propidium iodide (PI) (BioLegend) were applied for cell apoptosis detection. Specifically, cells (5 × 10⁵) were collected after 72 h of growth in fresh medium. Transfected cells were treated by trypsin, rinsed twice with cold phosphate buffer saline (PBS), and then resuspended in 500 μl of binding buffer. Thereafter, the cell suspension was cultured with Annexin V (1:20) for 5 min, and then supplemented with Annexin V‐FITC. Next, PI was employed to stain cells for additional 15 min. Flow cytometry (BD, USA) was utilized to detect cell apoptosis.
2.10. Dual‐luciferase assay
AURKA wild‐type (WT) and mutant (MUT) 3′‐untranslated regions (UTR) were cloned into the firefly luciferase expression vector psiCHECK (Sangon Co.). Using Lipofectamine 2000 (Invitrogen) reagent, miR‐199b‐3p‐mimic/NC‐mimic and psiCHECK‐AURKA WT/MUT were cotransfected into HepG2 cells. Dual‐Luciferase Reporter Assay System (Promega) measured luciferase activity.
2.11. Animal experiments
To confirm the role of miR‐199b‐3p/AURKA axis in HCC malignant progression, mice were divided into three groups (NC‐agomir + oe‐NC group, miR‐agomir + oe‐NC group, miR‐agomir + oe‐AURKA group), with five mice in each group. NC‐agomir + oe‐NC, miR‐agomir + oe‐NC, miR‐agomir + oe‐AURKA cells (1 × 10⁶ cells/0.1 ml PBS) were subcutaneously injected into BALB/c nude mice (female, 5 weeks old) inside the right thigh to generate a xenograft tumor transplantation model. Tumor volume was recorded every 3 days and mice were sacrificed 21 days after model establishment. Tumor tissue was separated from mice, and tumor weight was determined. Experiment was carried out in line with The Guide for Care and Use of Laboratory Animals of the National Institutes of Health and approved by the Ethics Committee of the Second Affiliated Hospital Zhejiang University School of Medicine.
2.12. Immunohistochemistry
Tumor tissue was embedded in paraffin and sectioned for subsequent immunohistochemistry for AURKA detection. After deparaffinization, hydration, antigen extraction, and blockage of sections, primary antibodies were added and incubated at 4°C overnight. Samples were then incubated with secondary antibody following manufacturer's instructions. Subsequently, DAB solution was added dropwise, followed by 10 min of incubation. Hematoxylin was utilized for 1 min of counterstain and then stopped staining. Photographs were taken under a microscope (Nikon, Japan). Anti‐AURKA was purchased from Abcam (ab52973).
2.13. Statistical analysis
GraphPad Prism 6.0 (La Jolla) was utilized for data analyses. Each assay was repeated three times, and outcomes were displayed by mean ± standard deviation. Intragroup comparison was the t test. p < 0.05 denoted a statistical significance.
3. RESULTS
3.1. AURKA is remarkably overexpressed in HCC tissue and cells
Abnormal level of mRNA in HCC was found through bioinformatics analyses. The specific methods were as follows: GEO multichip combined analysis screened out 59 upregulated mRNAs and 157 downregulated ones (Figure 1A). STRING database were utilized to build a protein interaction network for differential genes, where 134 nodes and 436 interactions were obtained (Figure 1B). Finally, the topological properties of the network (degree) were statistically analyzed. It turned out that AURKA was at the core of entire interaction network diagram (Figure 1C). Analysis results of TCGA‐LIHC dataset were consistent with those of GEO data: AURKA was notably overexpressed (p < 0.05) in tumor tissue (Figure 1D). We took AURKA as the research object and examined its expression in HCC tissue and cells. qRT‐PCR exhibited a notable high level of AURKA in HCC tumor tissue (p < 0.05; Figure 1E). Similarly, the outcomes of qRT‐PCR and western blot assays revealed that AURKA was prominently hastened in HCC cells both at mRNA and protein degree (p < 0.05; Figure 1F,G). Several studies proved the increased AURKA level in different tumor tissue and this was linked with unfavorable prognosis. 9 , 10 Besides, the relationship between AURKA expression and the survival of HCC patients was analyzed from the two databases, which turned out that, HCC patients with high level of AURKA in TCGA database had a low survival rate (p < 0.05). However, there was no remarkable relationship between AURKA expression and HCC patient survival in the GEO database (Figure 2A). At the same time, we analyzed the relationship between AURKA and different clinicopathological features and observed that there was no dramatic correlation between the two (Figure S1A,B). We also established a prognostic model for AURKA via multivariate Cox regression analysis, and AURKA could act as an independent prognostic factor for HCC as shown by the outcomes (Figure 2B). As uncovered by the above results, AURKA high expression in HCC was related to bad survival. To explain the influence of AURKA on HCC cells, we utilized HepG2 cells with the highest AURKA level and SK‐HEP1 cells with the lowest AURKA level for subsequent detection.
FIGURE 1.

High expression of AURKA in HCC cells. (A) Heat map of the top 20 differential genes screened by the combined analysis of the four groups of HCC mRNA chips in the GEO database. (B) The protein interaction network diagram of the differential gene. (C). Statistics of the core degree value (degree value) in the interaction network graph. Abscissa: degree value; Ordinate: gene name. (D) The expression of AURKA in TCGA‐LIHC dataset. Green: normal; Red: tumor. (E) AURKA mRNA expression in HCC tumor and adjacent normal tissue. Tumor: n = 30; Normal: n = 30. (F, G) AURKA mRNA and protein levels in human hepatic normal and HCC cell lines. *p < 0.05.
FIGURE 2.
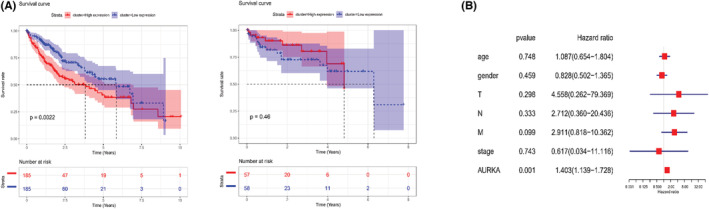
Patients with high AURKA expression have lower survival rate. (A) Survival curve of AURKA level on patient's prognosis in TCGA‐LIHC and GEO dataset. Red: high expression; Blue: low expression. (B) Multivariate Cox repression analysis of AURKA.
3.2. Overexpressed AURKA boosts the proliferation, migration, and invasion of HCC cells while repressing cell apoptosis
To probe impact of AURKA on biological functions of HCC cells, we constructed an AURKA overexpression HCC cell lines (HepG2 cell line and SK‐HEP1 cell line) for subsequent cellular function experiments. As shown on qRT‐PCR and western blot results, AURKA was markedly expressed at mRNA and protein level in oe‐AURKA group (p < 0.05; Figure 3A). MTT and cell colony formation assays indicated that forced expression of AURKA fostered the proliferative and cloning abilities of HCC cells (p < 0.05; Figure 3B,C). As unveiled in scratch healing and transwell assays, overexpressed AURKA prominently facilitated HCC cells migration and invasion (p < 0.05; Figure 4A,B). Apoptosis assay expressed that HCC cells apoptosis was repressed by AURKA overexpression (p < 0.05; Figure 4C). A study manifested that AURKA can affect tumor cell migration through the PI3K/AKT signaling pathway. 11 Thus, we assessed proteins related to PI3K/AKT signaling pathway and demonstrated that enforced expression of AURKA could facilitate the phosphorylation of AKT (p < 0.05; Figure 5). Meanwhile, we constructed HepG2 cells expressing sh‐NC or sh‐AURKA to examine the biological function, in which the results are consistent with the above (p < 0.05; Figure S2A–G). Above all, AURKA facilitated HCC cell phenotype progression and activated PI3K/AKT signaling pathway.
FIGURE 3.

Overexpressed AURKA fosters the proliferation of HCC cells. (A) The transfection efficiency of AURKA in HCC cell lines HepG2 and SK‐HEP1. (B) The proliferation of oe‐NC and oe‐AURKA groups of HCC cell lines HepG2 and SK‐HEP1. (C) The cloning ability of HepG2 cells and SK‐HEP1 cells. *p < 0.05.
FIGURE 4.

Overexpressed AURKA fosters the migration and invasion of HCC cells and restrains cell apoptosis. (A) The migration of HepG2 cells and SK‐HEP1 cells (40×). (B) The invasion of HepG2 cells and SK‐HEP1 cells (100×). (C) The apoptosis rate of HepG2 cells and SK‐HEP1 cells. *p < 0.05.
FIGURE 5.
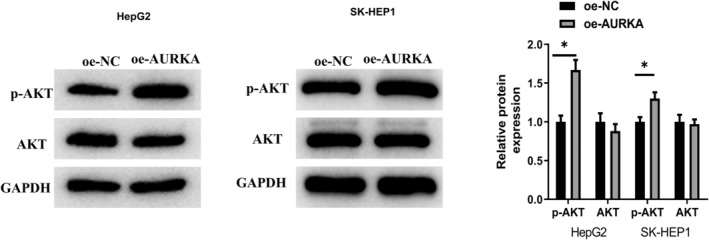
Overexpressed AURKA facilitates the phosphorylation of AKT. Western blot was applied to detect the expression of related proteins in the PI3K/AKT signaling pathway. *p < 0.05.
3.3. MiR‐199b‐3p is less expressed in HCC tissue and cells,and targeted to repress AURKA
The above experimental results proved the tumor promoting effects of AURKA on HCC. EdgeR differential analysis obtained a total of 282 differentially expressed miRNAs (Figure 6A). The top 10 differentially expressed genes were REG3G, PGC, REG3A, LGALS14, REG1B, CLPS, REG1A, LIN28B, PAEP, and DCAF4L2. StarBase and mirDIP databases were used for predicting upstream regulatory genes for AURKA. The predicted results and the downregulated 35 miRNAs were intersected and 5 differential miRNAs with binding sites with AURKA were acquired (Figure 6B). Pearson's analysis exhibited that miR‐199b‐3p was markedly negatively associated with AURKA (p = 0.003; Figure 6C), and it was dramatically suppressed in HCC tissue based on TCGA data (p ≤ 0.001; Figure 6D). After that, qRT‐PCR result uncovered that miR‐199b‐3p was conspicuously repressed in HCC lines (p < 0.05; Figure 6E). To validate the expression level of miR‐199b‐3p in clinical tissue, we collected adjacent tissue and tumor tissue from 30 HCC patients and detected the expression of miR‐199b‐3p. The outcomes revealed that miR‐199b‐3p presented notably low expression in tumor tissue compared with adjacent tissue (Figure 6F). StarBase database was applied to predict a binding site between miR‐199b‐3p and AURKA (Figure 6G). The dual‐luciferase assay proved that overexpression of miR‐199b‐3p restrained luciferase activity of AURKA‐WT but had no obvious impact on that of AURKA‐MUT (Figure 6H). Besides, qRT‐PCR detection demonstrated that in HepG2 cells and SK‐HEP1 cells, miR‐199b‐3p overexpression repressed AURKA mRNA (p < 0.05; Figure 6I). As suggested by western blot assay, miR‐199b‐3p upregulation restrained the protein expression of AURKA in HepG2 cells and SK‐HEP1 cells (Figure 7). Thus, miR‐199b‐3p was downregulated in HCC cells and could repress AURKA expression by targeting it.
FIGURE 6.

MiR‐199b‐3p is less expressed in HCC cells and negatively regulated AURKA. (A) Volcano map of the differential miRNAs in the HCC dataset. Red: upregulated miRNAs; Green: downregulated miRNAs. (B) Venn diagram of predicted upstream regulatory miRNAs of AURKA and downregulated differential miRNAs. (C) Pearson's correlation analysis between AURKA and miR‐199b‐3p. (D) MiR‐199b‐3p expression. Green: normal samples; Red: tumor samples. (E) MiRNA‐199p‐3b level in HCC tumor and adjacent normal tissue. Tumor: n = 30; Normal: n = 30. (F) MiR‐199b‐3p expression in human hepatic normal cell line HL‐7702 and HCC cell lines HepG2, Hep3B, SK‐HEP1, and Huh‐7. (G) Schematic diagram of bioinformatics analysis predicting the binding of AURKA‐WT and AURKA‐MUT to miR‐199b‐3p sequence. (H) The luciferase activity of HepG2 cells and SK‐HEP1 cells in NC‐mimic and miR‐mimic groups. (I) AURKA mRNA level in HepG2 cells and SK‐HEP1 cells. *p < 0.05.
FIGURE 7.

Overexpressed miR‐199b‐3p represses the protein level of AURKA. Western blot determined the expression of AURKA protein. *p < 0.05.
3.4. MiR‐199b‐3p targets AURKA and represses proliferation, migration, and invasion of HCC cells and induces cell apoptosis
To verify the role of miR‐199b‐3p/AURKA axis in HCC, we constructed HepG2 cell line with only overexpressed miR‐199b‐3p and HepG2 cell line with overexpressed AURKA and miR‐199b‐3p simultaneously. qRT‐PCR and western blot demonstrated that AURKA expression was prominently low in cells after overexpressing miR‐199b‐3p, while simultaneously overexpressing AURKA and miR‐199b‐3p resulted in a significant recovery of AURKA expression (p < 0.05; Figure 8A). MTT and cell colony formation assays unveiled that after upregulating miR‐199b‐3p, the proliferation of HCC cells was weakened, while after upregulating AURKA and miR‐199b‐3p at the same time, cell proliferative ability was restored (Figure 8B,C). Scratch healing and transwell assays proved that overexpression of miR‐199b‐3p reduced migration and invasion of HCC cells, and overexpression of miR‐199b‐3p and AURKA could counteract this inhibitory impact (Figure 8D,E). Similarly, flow cytometry was to assess cell apoptosis, uncovering that overexpression of miR‐199b‐3p significantly facilitated HCC cell apoptosis (p < 0.05), while after concomitantly overexpressing miR‐199b‐3p and AURKA, promoting impact was weakened (p < 0.05; Figure 8F). In addition, the phosphorylation level of AKT decreased when miR‐199b‐3p was overexpressed, but this effect was counteracted when AURKA level was forced concomitantly (p < 0.05; Figure 8G). Meanwhile, we constructed HepG2 cells expressing NC‐inhibitor + sh‐NC, miR‐inhibitor + sh‐NC, or miR‐inhibitor + sh‐AURKA to identify miRNA‐199b‐3p/AURKA axis again, in which the results are consistent with the above (Figure S3A–G). To sum up, miR‐199b‐3p suppressed proliferation, migration, and invasion of HCC cells, hasten cell apoptosis via targeting AURKA, and affect PI3K/AKT signaling pathway.
FIGURE 8.

MiR‐199b‐3p suppresses proliferation, migration, and invasion of HCC cells and stimulates apoptosis through suppressing AURKA. (A) AURKA expression in HepG2 cells in the NC‐mimic + oe‐NC, miR‐mimic + oe‐NC, and miR‐mimic + oe‐AURKA groups. (B) Proliferation of HepG2 cells. (C) Cloning ability of HepG2 cells. (D) The migration of HepG2 cells (40×). (E) Invasion of HepG2 cells (100×). (F) Apoptosis level of HepG2 cells. (G) p‐AKT and AKT protein levels in HepG2 cells. *p < 0.05.
3.5. MiR‐199b‐3p targets AURKA to repress HCC tumor growth in mice
To validate the impact of miR‐199b‐3p/AURKA axis on malignant progression of HCC tumor, we generated a mouse model of HCC tumor. Tumor volume was detected every 3 days and mice were sacrificed after 21 days. As illustrated in Figure 9A–C, the tumor volume and tumor weight of mice were significantly reduced in the miR‐agomir + oe‐NC group but were restored in the miR‐agomir + oe‐AURKA group when compared with the NC‐agomir + oe‐NC group (p < 0.05). AURKA level in HCC tumor tissue was assayed through qRT‐PCR and western blot, whose results are consistent with the trend of the results in cell experiments (Figure 9D,E). Immunochemistry staining illustrated that enforced expression of miR‐199b‐3p downregulated AURKA level, but concomitant overexpression of AURKA could restore AURKA level (p < 0.05; Figure 9F). Similarly, the phosphorylation level of AKT presented a similar trend to that in cell experiments, and PI3K/AKT signaling pathway was also affected (p < 0.05; Figure 9E). In summary, miR‐199b‐3p suppressed the AURKA expression in HCC and inhibited the malignant progression of HCC.
FIGURE 9.

MiR‐199b‐3p/AURKA axis inhibits malignant progression of HCC. (A) Image of mouse tumor. (B) The tumor growth was measured. Tumor volume was monitored every 3 days. (C) Changes of tumor weight within 3 weeks in nude mice. (D) AURKA level were performed by qRT‐PCR. (E) Levels of AURKA, p‐AKT, AKT at protein level were analyzed by western blot. (F) Representative images of immunochemistry staining of mice tumor sections. *p < 0.05.
4. DISCUSSION
HCC is a ubiquitous malignant tumor, which is a main cause of cancer death worldwide. 12 Many studies indicated that tumor development was activated at posttranscriptional degree, namely the certain mRNAs were abnormally modulated promoting tumor progression. 13 For example, low PHF2 level promotes HCC cell migration and is related to the poor overall survival of HCC patients. 14 MEG2 overexpression could suppress the metastasis and growth of HCC trough inhibition of AKT pathway. 15 Exploring the mRNA associated with the progression of HCC is helpful for us to have a more comprehensive understanding of HCC internal molecular mechanism.
The object of this study was AURKA, a tumor biomarker thought to be upregulated in different cancers. 16 In bladder cancer, overexpression of AURKA leads to enhanced cell proliferation. 17 In oral squamous cell carcinoma, downregulating AURKA can suppress cell proliferation, migration, and invasion. 18 In ovarian cancer, AURKA downregulation can evidently restrain cell progression in vitro. 19 These findings display that AURKA can promote the malignant progression of certain cancers. Overexpressed AURKA induces the epithelial–mesenchymal transition of HCC, 11 proving that it can modulate the process of HCC and has research potential. To verify influence of AURKA on biological functions of HCC cells, we overexpressed AURKA in HCC cells. The results of a series of biological experiments expressed that forced AURKA expression promoted the malignant progression of HCC cells, which were consistent with the previous findings. For instance, Zhang et al 20 unveiled that overexpressed AURKA facilitated phenotype progression of HCC, which supports our findings, proving that AURKA can also function as a tumor promote for HCC. Moreover, AURKA has been disclosed to correlate with the prognosis and clinical features of HCC. 21 Su et al 22 constructed the prognostic model for five genes including AURKA and identified its predictive performance. The outcomes manifested that this feature had a great predictive ability for HCC patients and could effectively classify HCC patients into high‐ and low‐risk groups. Wang et al 23 investigated four nucleotide polymorphisms in the AURKA gene and clinical outcomes in HCC patients. Genetic variation in the AURKA gene may serve as a critical predictor of early HCC as shown in the Results, which also support our investigation that AURKA is associated with the prognoses of HCC patients.
In an effort to find the upstream regulatory gene of AURKA in HCC, we obtained miR‐199b‐3p through bioinformatics analyses, which was remarkably negatively correlated with AURKA expression. Besides, we verified the binding relationship of AURKA and miR‐199b‐3p. Hence, it was believed that miR‐199b‐3p was the upstream regulatory gene of AURKA. Considering the results from several studies, miR‐199b‐3p was regarded as a tumor‐related miRNA. For instance, miR‐199b‐3p expression is suppressed in the miRNA differential expression profile of prolactinoma. 24 Moreover, miR‐199b‐3p is critical for biochemical recurrence‐free survival rate of prostate adenocarcinoma patients. 25 This study unveiled that miR‐199b‐3p level was decreased prominently in HCC. Overexpressed miR‐199b‐3p constrained phenotype progression of HCC cells. Similarly, Koshizuka et al found that overexpressed miR‐199b‐3p constrained the migration and invasion of head and neck cancer cells, 26 which is consistent with our results. In addition, we also proved that AURKA offset repressive effect of miR‐199b‐3p on HCC cell malignant progression, indicating that miR‐199b‐3p repressed HCC development by targeting AURKA. Furthermore, in tumor mouse models, overexpression of AURKA restored tumor growth capacity that was attenuated by miR‐199b‐3p overexpression. Additionally, Chen et al 11 presented that AURKA induced EMT and cell stemness in HCC via the PI3K/AKT signaling pathway, thus stimulating tumor metastasis. In this study, enforced expression of AURKA enhanced phosphorylation level of AKT, and forced expression of miR‐199b‐3p repressed phosphorylation level of AKT, suggesting that the miR‐199b‐3p/AURKA axis may affect the PI3K/AKT signaling pathway to influence HCC metastasis.
5. CONCLUSION
In short, we verified that AURKA was upregulated in HCC and functioned as an oncogene. Moreover, the miR‐199b‐3p/AURKA signal axis was discovered for the first time. MiR‐199b‐3p targeted and repressed AURKA expression to inhibit the malignant behaviors of HCC cells and influence PI3K/AKT signaling pathway. At present, few studies are on the regulatory mechanism of miR‐199b‐3p in cancer. The results of this article expand the research scope of miR‐199b‐3p and bolsters understanding of HCC molecular mechanism. The miR‐199b‐3p/AURKA axis has the potential as a prognostic marker indicator for HCC. But the effects of miR‐199b‐3p/AURKA axis on HCC malignant progression and PI3K/AKT signaling pathway are the subjects of ongoing investigation.
AUTHOR CONTRIBUTIONS
Guogang Li contributed to the study conceptualization, methodology, writing—original draft, and project administration. Yang Tian formally analyzed and visualized the study and carried out data curation. Zhenzhen Gao investigated, supervised, and carried out writing—review and editing. All authors agreed to be accountable for all aspects of the work.
FUNDING INFORMATION
This study was supported by the National Natural Science Foundation (No. 882000619). The funders had no role in the study design, data collection and analysis, decision to publish, or preparation of the manuscript.
CONFLICT OF INTEREST
The authors declare no conflicts of interest.
Supporting information
Figure S1
Figure S2
Figure S3
ACKNOWLEDGMENTS
Not applicable.
Li G, Tian Y, Gao Z. The role of AURKA/miR‐199b‐3p in hepatocellular carcinoma cells. J Clin Lab Anal. 2022;36:e24758. doi: 10.1002/jcla.24758
DATA AVAILABILITY STATEMENTS
The data that support the findings of this study are available on request from the corresponding author.
REFERENCES
- 1. Kollareddy M, Dzubak P, Zheleva D, Hajduch M. Aurora kinases: structure, functions and their association with cancer. Biomed Pap Med Fac Univ Palacky Olomouc Czech Repub. 2008;152(1):27‐33. [DOI] [PubMed] [Google Scholar]
- 2. Wang‐Bishop L, Chen Z, Gomaa A, et al. Inhibition of AURKA reduces proliferation and survival of gastrointestinal cancer cells with activated KRAS by preventing activation of RPS6KB1. Gastroenterology. 2019;156(3):662‐75 e7. [DOI] [PMC free article] [PubMed] [Google Scholar]
- 3. Li T, Chen Y, Zhang J, Liu S. LncRNA TUG1 promotes cells proliferation and inhibits cells apoptosis through regulating AURKA in epithelial ovarian cancer cells. Medicine. 2018;97(36):e12131. [DOI] [PMC free article] [PubMed] [Google Scholar]
- 4. Yuan YL, Yu H, Mu SM, Dong YD, Li Y. MiR‐26a‐5p inhibits cell proliferation and enhances doxorubicin sensitivity in HCC cells via targeting AURKA. Technol Cancer Res Treat. 2019;18:1533033819851833. [DOI] [PMC free article] [PubMed] [Google Scholar]
- 5. Iorio MV, Croce CM. MicroRNA dysregulation in cancer: diagnostics, monitoring and therapeutics. A comprehensive review. EMBO Mol Med. 2012;4(3):143‐159. [DOI] [PMC free article] [PubMed] [Google Scholar]
- 6. Nagy Á, Lánczky A, Menyhárt O, Győrffy B. Validation of miRNA prognostic power in hepatocellular carcinoma using expression data of independent datasets. Sci Rep. 2018;8(1):9227. [DOI] [PMC free article] [PubMed] [Google Scholar]
- 7. Li D, Zhang J, Li J. Role of miRNA sponges in hepatocellular carcinoma. Clin Chim Acta. 2020;500:10‐19. [DOI] [PubMed] [Google Scholar]
- 8. Wang X, Gao J, Zhou B, Xie J, Zhou G, Chen Y. Identification of prognostic markers for hepatocellular carcinoma based on miRNA expression profiles. Life Sci. 2019;232:116596. [DOI] [PubMed] [Google Scholar]
- 9. Eterno V, Zambelli A, Villani L, et al. AurkA controls self‐renewal of breast cancer‐initiating cells promoting wnt3a stabilization through suppression of miR‐128. Sci Rep. 2016;6:28436. [DOI] [PMC free article] [PubMed] [Google Scholar]
- 10. Goos JA, Coupe VM, Diosdado B, et al. Aurora kinase A (AURKA) expression in colorectal cancer liver metastasis is associated with poor prognosis. Br J Cancer. 2013;109(9):2445‐2452. [DOI] [PMC free article] [PubMed] [Google Scholar]
- 11. Chen C, Song G, Xiang J, Zhang H, Zhao S, Zhan Y. AURKA promotes cancer metastasis by regulating epithelial‐mesenchymal transition and cancer stem cell properties in hepatocellular carcinoma. Biochem Biophys Res Commun. 2017;486(2):514‐520. [DOI] [PubMed] [Google Scholar]
- 12. Cao MQ, You AB, Zhu XD, et al. Correction to: miR‐182‐5p promotes hepatocellular carcinoma progression by repressing FOXO3a. J Hematol Oncol. 2018;11(1):56. [DOI] [PMC free article] [PubMed] [Google Scholar]
- 13. Desterro J, Bak‐Gordon P, Carmo‐Fonseca M. Targeting mRNA processing as an anticancer strategy. Nat Rev Drug Discovery. 2020;19(2):112‐129. [DOI] [PubMed] [Google Scholar]
- 14. Fu Y, Liu M, Li F, et al. MiR‐221 promotes hepatocellular carcinoma cells migration via targeting PHF2. Biomed Res Int. 2019;2019:4371405‐4371411. [DOI] [PMC free article] [PubMed] [Google Scholar]
- 15. Ying D, Ruan Y, Zhou X. MEG2 inhibits the growth and metastasis of hepatocellular carcinoma by inhibiting AKT pathway. Gene. 2019;687:1‐8. [DOI] [PubMed] [Google Scholar]
- 16. Du R, Huang C, Liu K, Li X, Dong Z. Targeting AURKA in cancer: molecular mechanisms and opportunities for cancer therapy. Mol Cancer. 2021;20(1):15. [DOI] [PMC free article] [PubMed] [Google Scholar]
- 17. Guo M, Lu S, Huang H, et al. Increased AURKA promotes cell proliferation and predicts poor prognosis in bladder cancer. BMC Syst Biol. 2018;12(Suppl 7):118. [DOI] [PMC free article] [PubMed] [Google Scholar]
- 18. Xiao C, Hong H, Yu H, et al. MiR‐340 affects gastric cancer cell proliferation, cycle, and apoptosis through regulating SOCS3/JAK‐STAT signaling pathway. Immunopharmacol Immunotoxicol. 2018;40(4):278‐283. [DOI] [PubMed] [Google Scholar]
- 19. Wang C, Yan Q, Hu M, Qin D, Feng Z. Effect of AURKA gene expression knockdown on angiogenesis and tumorigenesis of human ovarian cancer cell lines. Target Oncol. 2016;11(6):771‐781. [DOI] [PubMed] [Google Scholar]
- 20. Zhang H, Bao J, Zhao S, Huo Z, Li B. MicroRNA‐490‐3p suppresses hepatocellular carcinoma cell proliferation and migration by targeting the aurora kinase a gene (AURKA). Arch Med Sci. 2020;16(2):395‐406. [DOI] [PMC free article] [PubMed] [Google Scholar]
- 21. Xiao J, Zhang Y. AURKB as a promising prognostic biomarker in hepatocellular carcinoma. Evol Bioinf. 2021;17:11769343211057589. [DOI] [PMC free article] [PubMed] [Google Scholar]
- 22. Su L, Zhang G, Kong X. A novel five‐gene signature for prognosis prediction in hepatocellular carcinoma. Front Oncol. 2021;11:642563. [DOI] [PMC free article] [PubMed] [Google Scholar]
- 23. Wang B, Hsu CJ, Chou CH, et al. Variations in the AURKA gene: biomarkers for the development and progression of hepatocellular carcinoma. Int J Med Sci. 2018;15(2):170‐175. [DOI] [PMC free article] [PubMed] [Google Scholar]
- 24. Chen YX, Li Q, Wang CD, et al. Differential expression analysis of prolactinoma‐related microRNAs. Zhonghua Yi Xue Za Zhi. 2012;92(5):320‐323. [PubMed] [Google Scholar]
- 25. Zhu Z, Wen Y, Xuan C, et al. Identifying the key genes and microRNAs in prostate cancer bone metastasis by bioinformatics analysis. FEBS Open Bio. 2020;10(4):674‐688. [DOI] [PMC free article] [PubMed] [Google Scholar]
- 26. Koshizuka K, Hanazawa T, Kikkawa N, et al. Regulation of ITGA3 by the anti‐tumor miR‐199 family inhibits cancer cell migration and invasion in head and neck cancer. Cancer Sci. 2017;108(8):1681‐1692. [DOI] [PMC free article] [PubMed] [Google Scholar]
Associated Data
This section collects any data citations, data availability statements, or supplementary materials included in this article.
Supplementary Materials
Figure S1
Figure S2
Figure S3
Data Availability Statement
The data that support the findings of this study are available on request from the corresponding author.