

Abstract
Background
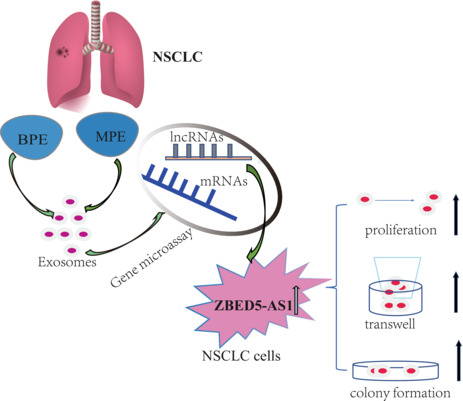
Lung adenocarcinoma (LUAD) is a highly malignant tumor with a very low five‐year survival rate. In this study, we aimed to identify differentially expressed long‐chain non‐coding RNA (lncRNAs) and mRNAs from benign and malignant pleural effusion exosomes.
Methods
We used gene microassay and quantitative real‐time reverse transcription polymerase chain reaction (RT‐qPCR) to detect and verify differentially expressed mRNAs and lncRNAs in benign and malignant pleural effusion exosomes. Gene Ontology (GO) functional significance and Kyoto Encyclopedia of Genes and Genomes (KEGG) pathway significance enrichment analyses were performed to identify the difference in biological processes and functions between different mRNAs. We selected the lncRNA ZBED5‐AS1 with an upregulated differential fold of 3.003 and conducted a preliminary study on its cellular function.
Results
Gene microassay results revealed that 177 differentially expressed lncRNAs were upregulated, and 215 were downregulated. The top 10 upregulated were FMN1, AL118505.1, LINC00452, AL109811.2, CATG00000040683.1, AC137932.1, AC008619.1, AL450344.1, AC092718.6, and ZBED5‐AS1. The top 10 downregulated were TEX41, G067726, JAZF1‐AS1, AC027328.1, AL445645.1, AL022345.4, AC008572.1, AC123777.1, AC093714.1, and PHKG1. For the mRNAs, 79 were upregulated, and 123 were notably downregulated. GO analysis revealed that the upregulated differential mRNAs were mainly involved in “cellular response to acidic pH” (biological processes), “endoplasmic reticulum part” (cellular components), and “at DNA binding, cyclase activity” (molecular functions). KEGG pathways were found to be related to V. cholerae infection, Parkinson's disease, and cell adhesion molecules. RT‐qPCR showed that ZBED5‐AS1 was highly expressed in LUAD tissues, cells, and benign and malignant pleural fluid exosomes. Overexpression of ZBED5‐AS1 could significantly promote the proliferation, migration, invasion, and colony formation of LUAD cells, and knockdown had the opposite consequence.
Conclusion
The pleural effusion exosomes from patients with LUAD include several improperly expressed genes, and lncRNA‐ZBED5‐AS1 is a new biomarker that aids in our understanding of the occurrence and progression of LUAD.
Keywords: exosomes, gene microassay, lncRNAs, lung adenocarcinoma, malignant pleural
We analyzed the differentially expressed genes in benign and malignant pleural effusions by gene microassay analysis, and selected lncRNA ZBED5‐AS1, which has not been reported at home and abroad, for preliminary validation in clinical tissue samples and lung adenocarcinoma cells. We found that ZBED5‐AS1 could promote the proliferation, migration, invasion and colony formation ability of lung adenocarcinoma cells. We believe that ZBED5‐AS1 is a potential biomarker for the differentiation and diagnosis of lung adenocarcinoma.
1. INTRODUCTION
Lung cancer is a highly malignant tumor that remains the leading cause of cancer‐related deaths worldwide. According to the pathological type, lung cancer is divided into non‐small cell lung cancer (NSCLC) and small cell lung cancer. Among them, NSCLC accounts for 80% of lung cancers. NSCLC includes large cell carcinoma, squamous cell carcinoma, and lung adenocarcinoma (LUAD). 1 LUAD accounts for 40% of all patients with lung cancer 2 and has no typical clinical symptoms in the early stages, with approximately 80% of patients already in the middle and late stages at the time of diagnosis, delaying the optimal time for treatment and significantly shortening the patients' life expectancy. 3 Pleural effusion is a common clinical symptom that can be caused by a variety of diseases and is particularly common in cancers. Malignant pleural effusion (MPE) caused by lung cancer is the most common symptom and may be the first manifestation in many cases. 4 Specific diagnostic methods to distinguish between MPE and benign pleural effusion (BPE) are urgently needed. The cytological examination can be used as a diagnostic basis to identify the nature of pleural effusion; unfortunately, however, the positive rate is only between 11 and 78%. Thoracoscopy has a diagnostic sensitivity of about 90%, 5 , 6 but this invasive test could not be widely used in clinical practice due to cost and technical requirements.
Currently, routine markers for pleural effusion detection include adenosine deaminase, lactate dehydrogenase, glucose, ferritin, carbohydrate antigen 19‐9 (CA‐199), and carbohydrate antigen 125 (CA‐125) 7 ; although, their sensitivity and specificity are low. Thus, the search for reliable biomarkers that can distinguish MPE continues.
Exosomes contain nucleic acids, proteins, lipids, and other components and can be used as biological markers. 8 , 9 Long‐chain non‐coding RNA (lncRNA)—greater than 200 nucleotides in length—is related to a variety of biological functions, including transcriptional interference, post‐transcriptional regulation, translation control, epigenetic modification, cell differentiation, and translation. 10 , 11 , 12 , 13 Exosomes can contain proteins, miRNAs, and lncRNAs, and LncRNA has been defined as a novel biomarker carried by tumor‐derived exosomes. 14 Exosomes can protect lncRNAs from degradation in circulation and can be used for early diagnosis of cancer. 15 , 16 Han et al. 17 showed that the diagnostic performance of MiR‐198 was the same as carcinoembryonic antigen (CEA) and cytokeratin 19 fragment 21‐1 (CYFRA21‐1). The combination of three markers has a better effect, with a sensitivity of 89.2% and a specificity of 85.0%. Another study found that the combination of CEA and three miRNAs improves diagnostic performance, with an area under curve of 0.942, a sensitivity of 91.9%, and a specificity of 92.5%. 18 In addition, a recent study found that combined nucleic acid in the plasma and exosome nucleic acid in the pleural fluid can be used to evaluate low‐abundant epidermal growth factor receptor (EGFR) mutant copies in NSCLC. 19 At present, there are few reports about lncRNA in pleural effusion exosomes, and further exploration is needed.
Functional enrichment analysis divides the gene or protein list into multiple parts for classification, and the classification standard is often defined according to the function of the gene. In other words, placing genes with similar functions together in a gene list and associating them with biological phenotypes. To solve the problem of classifying genes by function, scientists have developed many gene function annotation databases; more famous ones being the Gene Ontology (GO) and Kyoto Encyclopedia of Genes and Genomes (KEGG) databases. 20 , 21
Recently, the use of gene microarrays in pathological diagnosis has received increasing attention. Since its invention, gene microarray has been utilized extensively in scientific research, the biopharmaceutical industry, and medical diagnostics. By using gene microarrays technology, Zhumai et al. discovered that scavenger receptor class A member 5 (SCARA5) was a downstream driver of thrombospondin type 1 domain‐containing 7A (THSD7A) in esophageal squamous cell carcinoma (ESCC), and SCARA5 could promote the proliferation and migration of ESCC cells. 22 Cai et al. used protein and gene microarrays to compare wild‐type (WT) and drug‐resistant (DR) Pseudomonas aeruginosa. The results showed that there were 679 mutation sites in the DR Group, and the drug resistance rate of cefoperazone sodium/sulbactam sodium remained high from 2013 to 2015. 23
We screened differentially expressed lncRNAs and mRNAs, predicting the associated pathways using gene microarray technology in LUAD‐derived MPE. The lncRNA ZBED5‐AS1 is located on chromosome 11p15.4, with a length of 1113 bp, and only one bioinformatic study has shown that it was associated with the development of ovarian cancer. 24 We finally selected this novel gene among the differentially expressed lncRNAs for cellular functional verification, and the gene is expected to become a reliable biomarker in LUAD.
2. MATERIALS AND METHODS
2.1. Patients and clinical samples
Six pleural effusion specimens—three BPE from patients with lung pneumonia (XS16, XS25, and XS42) and three MPE from patients with LUAD (XS7, XS8, and Ca)—were collected from the First Affiliated Hospital of Wenzhou Medical University without anticoagulant tubes. Fifty‐three pairs of LUAD and paracancerous tissues were collected from patients who were diagnosed with LUAD and operated upon at the First Affiliated Hospital of Wenzhou Medical University from 2019 to 2020. All patients participating in this study agreed to participate, and the study was approved by the Ethics Committee of the First Affiliated Hospital of Wenzhou Medical University. The diagnosis of LUAD was confirmed by pleural effusion, pleural biopsy, or histopathological analysis of the tumor. Pleural effusion was centrifuged at 1000g for 10 min and then at 10,000g for 30 min, and the supernatant was stored at −80°C. Tissue samples were stored in liquid nitrogen.
2.2. Cell culture
All cells were purchased from the cell bank of the Cancer Hospital at the Chinese Academy of Medical Sciences. Human bronchial epithelial cells (BEAS‐2B) were cultured in Dulbecco's modified Eagle medium (DMEM; Thermo Fisher Scientific, USA) with 10% fetal calf serum or bovine serum (FBS). LUAD cells (HCC827, PC9, A549, and H1299) were cultured in RPMI‐1640 (Thermo Fisher Scientific, USA) with 10% FBS. For the exosome study, the conditioned medium was supplemented with 10% vesicle‐free FBS. Cells were placed in a CO2 incubator with constant 90% humidity and 5% CO2.
2.3. Exosome isolation
Pleural effusion samples: Exosomes were extracted by differential centrifugation from pleural effusion previously collected and stored at −80°C; the samples were centrifuged at 500g for 5 min and 2000g for 10 min to eliminate cells and then centrifuged for 30 min at 10,000g to eliminate microvesicles. We collected the supernatant and filtered it with a 0.22‐μm membrane filter. The filtered supernatant was transferred to a clean ultracentrifuge tube and ultracentrifuged at 4°C and 100,000g for 2 h. After discarding the supernatant, the pellet was centrifuged for 2 h at 100,000g. All the steps were carried out at 4°C, and the exosomes were resuspended in 1× phosphate‐buffered saline (PBS) and stored at −80°C for further use.
Cell line samples: After reaching 80% confluency in a Petri dish, LUAD cells (H1299, HCC827, A549, and PC9) were cultured in complete RPMI‐1640 medium without added serum, and BEAS‐2B cells were cultured in DMEM. The cell culture supernatant was collected 48 h later and centrifuged at 300g for 15 min, 2000g for 15 min, and 10,000g for 30 min. The supernatants were filtrated through a 0.22‐mm polyvinylidene difluoride filter (Millipore, USA). Then, the supernatants were harvested to isolate exosomes by ultracentrifugation at 120,000g for 70 min twice, resuspending the exosomes in 1× PBS, and storing them at −80°C for further use.
2.4. Transmission electron microscopy (TEM)
For the TEM morphology investigation, 10 μl of the exosome pellet was placed on formvar carbon‐coated 200‐mesh copper electron microassay grids, incubated for 5 min at 26°C, and then subjected to standard 1% uranyl acetate staining for 1 min. The grid was washed three times with PBS and allowed to semi‐dry at room temperature before observation by TEM.
2.5. Western blotting
Exosomes and cells were lysed with RIPA (Beyotime, China) extraction reagent plus protease inhibitor PMSF (Beyotime, China). Protein concentration was determined using the BCA protein assay kit from Beyotime Biotechnology. Total proteins were isolated by 10% sodium dodecyl‐sulfate‐polyacrylamide gel electrophoresis (SDS‐PAGE) and transferred to a 0.22‐μm polyvinylidene difluoride membrane (Millipore, USA). The exosomal protein samples were incubated with anti‐TSG101 (Proteintech, USA), Calnexina (Proteintech, USA), and anti‐CD9 (Proteintech, USA) primary antibodies, washed with tris‐buffered saline Tween‐20 (TBST), and incubated with horseradish peroxidase‐labeled goat anti‐rabbit secondary antibodies (Beyotime, China); β‐actin (Beyotime, China) was used as an internal control. Protein bands were displayed using a fully automatic chemiluminescence imager.
2.6. RNA extraction and quality control
Total RNA was isolated from exosomes using TRIzol (Invitrogen Life Technologies, CA, USA). RNA quantity and quality were measured by NanoDrop ND‐1000. RNA was then extracted into cDNA using RT Kit (Thermo Scientific), according to the manufacturer's instructions. RNA integrity was assessed by standard denaturing agarose gel electrophoresis or an Agilent 2100 Bioanalyzer.
2.7. Gene microarray of exosomes and data processing and analysis
Sample labeling and array hybridization were performed according to the Agilent One‐Color Microarray‐Based Gene Expression Analysis protocol (Agilent Technology) with minor modifications. Agilent Feature Extraction software (version 11.0.1.1) was used to analyze the acquired array images. Differentially expressed lncRNAs and mRNAs with statistical significance between the two groups were identified through p‐value/false discovery rate filtering. Differentially expressed lncRNAs and mRNAs between the two samples were identified through fold‐change filtering. Pathway analysis and GO analysis were applied to determine the roles of these differentially expressed mRNAs in biological pathways or GO terms. Hierarchical clustering and combined analysis were performed using in‐house scripts. Statistical analysis was performed for the comparison of two groups using the Student's t‐test and one‐way analysis of variance for group differences from normally distributed data. The threshold value we used to mark differential expression of lncRNAs and mRNAs was a fold change of ≥2.0 or ≤0.5 (p < 0.05). Differences with p < 0.05 were considered statistically significant in both cases.
2.8. Quantitative real‐time reverse transcription polymerase chain reaction (RT‐qPCR)
All different RNA expressions were measured by RT‐qPCR on the ABI 7500 analyzer. The primers of these lncRNAs are shown in Table 1. RT‐qPCR was carried out in a total volume of 10 μl, including 5 μl SYBR premix (2×), 1 μl cDNA template, 0.4 μl meaningful primer (10 mmol/L), 0.4 μl antisense primer (10 mmol/L), 0.2 μl ROX II, and 3 μl double distilled water. The RT‐qPCR reaction was set at an initial denaturation step of 10 min at 95°C, followed by 40 cycles at 95°C for 30 s with a final extension step at 72°C for 5 min. All experiments were conducted in triplicate, and the median of each triplicate was used to calculate the relative mRNA concentration relative to β‐actin (ΔCt = Ct median mRNAs‐Ct median β‐actin) using the 2−ΔΔCt formula for the relative expression.
TABLE 1.
RNA quantification and quality assurance by NanoDrop ND‐1000
| Sample ID | OD260/280 (Ratio) | OD260/230 (Ratio) | Conc. (ng/μl) | Volume (μl) | Quantity (ng) | QC purity (Pass or Fail) |
|---|---|---|---|---|---|---|
| XS7 | 1.7 | 0.21 | 68.59 | 20 | 1371.8 | Pass |
| XS8 | 1.82 | 0.24 | 72.19 | 15 | 1082.85 | Pass |
| XS16 | 1.91 | 0.44 | 185.27 | 15 | 2779.05 | Pass |
| XS25 | 1.6 | 0.97 | 60.99 | 15 | 914.85 | Pass |
| XS42 | 1.71 | 1.87 | 145.43 | 15 | 2181.45 | Pass |
| Ca | 1.7 | 0.27 | 111.25 | 15 | 1668.75 | Pass |
2.9. Cell transfection
The lncRNA ZBED5‐AS1‐silencing RNA (si‐ZBED5‐AS1), and its control empty vector (si‐vector), and the ZBED5‐AS1‐overexpressing RNA (oe‐ZBED5‐AS1), and its control empty vector (oe‐vector), lentiviral particles were purchased from GeneChem Co. (Shanghai, China). Lentiviral transduction of LUAD cells was carried out with complete medium of RPMI‐1640 containing 10% FBS; the medium was changed after 8–12 h, and the transduction was determined by RT‐qPCR technology and green fluorescence protein (GFP) expression abundance under fluorescence microscope 72 h after infection, using 2 μg/ml puromycin to screen stably transfected cell lines. The sequences of si‐ZBED5‐AS1 and si‐vector were CCTGTTCAGTTCTGCCAAT and TTCTCCGAACGTGTCACGT, respectively.
2.10. Cell proliferation assay
Transfected cells (2 × 10³/well) were seeded in 96‐well plates, supplemented with a complete medium to a total volume of 100 μl per well, and four replicate wells were set up for each group for the experiment. After the cells were fully attached, the ability of the cells to proliferate was determined using the Cell Counting Kit‐8 (CCK8; Dojindo, Japan) according to the protocol provided by the manufacturer. In brief, the cells were incubated with 10% CCK‐8 reaction solution for 1–3 h at 37°C, and the optical density (OD) values were measured at a wavelength of 450 nm to quantify the proliferation ability of the cells. The data were monitored continuously for four days, and the results were processed with GraphPad Prism.
2.11. Cell migration and invasion
Experiments were performed using transwell chambers with a pore size of 8 μm. Cell invasion required spreading 40 μl in the bottom of the chamber with a 1:8 ratio of serum‐free medium and Matrigel; the chamber was then placed in an incubator at 37°C for 1–4 h to completely solidify. Transfected cells were resuspended with serum‐free RPMI‐1640 to the upper chamber (3 × 10⁴ cells/well, 200 μl), and 600 μl of culture medium with 20% FBS was added to the bottom well of the system. After incubation at 37°C for 24 h, each transwell insert was washed with PBS, and the cells on both sides of the transwell membrane were fixed with 4% paraformaldehyde at 37°C for 30 min and stained with 0.1% crystal violet (Beyotime, China) for 30 min at room temperature. The cells that did not cross the membrane on the upper side were gently removed with a cotton swab, and the number of invading cells in five random fields was counted under an inverted microscope. Matrigel is not required for cell migration, and other processes are consistent with cell invasion.
2.12. Colony‐formation assay
LUAD cells were resuspended with RPMI‐1640 medium containing 10% FBS and seeded into 6‐well plates (500 cells/well). Plates were maintained at 37°C in a 5% CO2 incubator for ten days, and colonies of more than 50 cells were counted. Cells were then washed with PBS and fixed with 4% paraformaldehyde for 30 min. Cell colonies were stained with 0.1% crystal violet solution (Beyotime, China) for 30 min and then photographed and counted under natural light.
2.13. Statistical analysis
The results are represented as the mean ± standard error of the mean. Comparisons between two groups were performed using Student's t‐test, and differences were considered significant at p < 0.05. The data were analyzed and mapped using the SPSS 22.0 system (SPSS, Inc. Chicago, IL, USA) and GraphPad Prism software (San Diego, CA, USA).
3. RESULTS
3.1. Successful exosome isolation
We used differential centrifugation to extract exosomes from six cases of BPE and MPE collected from the First Affiliated Hospital of Wenzhou Medical University. Under the electron microscope, the structure of exosomes was complete, the appearance was round, and the particle diameter was between 50 and 150 nm (Figure 1A–C). Meanwhile, Western blotting further confirmed that the exosome markers TSG101 and CD9 were positively expressed in our pleural effusion, while calnexin was negatively expressed. (Figure 1D). These results indicated the successful isolation of exosomes from pleural effusion.
FIGURE 1.
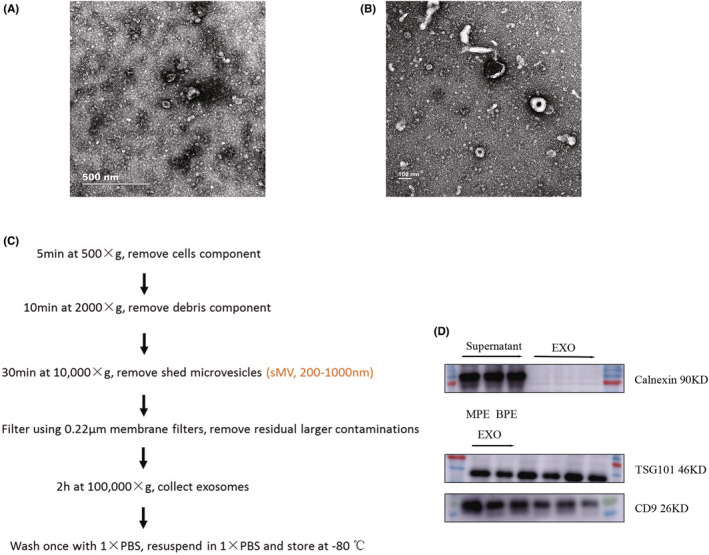
Characteristics of exosomes. (A) TEM images of exosomes secreted by BPE. (B) TEM images of exosomes secreted by MPE. (C) Exosome extraction process. (D) The expression of exosome characteristic proteins TSG101, CD9, and calnexin were detected by Western blotting.
3.2. RNA quality assurance and quality control results
After high‐quality total RNA was extracted, rRNA was removed from total RNA to purify mRNA (mrN‐only™ Eukaryotic mRNA Isolation Kit, Epicentre). The ratio of the absorbance (A260/A280) of the RNA solution should be between 1.8 and 2.1. Our extracted RNA qualified (Table 2) and could be sequenced, and the specific activity (pmol dye/μg cRNA) of the labeled RNA was obtained by following Table 3. Our specific activity was >9.0 pmol Cy3/μg, and cRNA could proceed to the hybridization step.
TABLE 2.
Labeling efficiency—QC
| Sample ID | Dye name | Dye pmol/μl | cRNA concentration (μg/μl) | Specific activity a , b (pmol Dye/μg cRNA) | Volume (μl) | Total amount (μg) |
|---|---|---|---|---|---|---|
| XS16 | Cy3 | 9.2 | 0.75 | 12.25 | 20 | 15.02 |
| XS25 | Cy3 | 9.32 | 0.7 | 13.33 | 20 | 13.98 |
| XS42 | Cy3 | 9.68 | 0.71 | 13.65 | 20 | 14.18 |
| XS7 | Cy3 | 9.15 | 0.69 | 13.26 | 20 | 13.81 |
| XS8 | Cy3 | 8.78 | 0.69 | 12.7 | 20 | 13.83 |
| Ca | Cy3 | 8.8 | 0.7 | 12.62 | 20 | 13.95 |
For two color, if the yield is <825 ng and the specific activity is <8.0 pmol Cy3 or Cy5 per μg cRNA do not proceed to the hybridization step. Repeat cRNA preparation.
For one color, if the yield is <1.65 μg and the specific activity is <9.0 pmol Cy3 or Cy5 per μg cRNA do not proceed to the hybridization step. Repeat cRNA preparation.
TABLE 3.
Some upregulated and downregulated differentially expressed LncRNAs
| Fold change | Regulation | Transcript_ID | GeneID | GeneSymbol | Type |
|---|---|---|---|---|---|
| 6.8224334 | up | ENST00000559150 | ENSG00000248905 | FMN1 | lncRNA |
| 4.7070894 | up | ENST00000619370 | ENSG00000278192 | AL118505.1 | lncRNA |
| 4.6001742 | up | compmerge.1918.pooled.chr13 | ENSG00000229373 | LINC00452 | lncRNA |
| 4.112919 | up | ENST00000435388 | ENSG00000230337 | AL109811.2 | lncRNA |
| 4.0438243 | up | ENCT00000213629 | CATG00000040683 | CATG00000040683.1 | lncRNA |
| 3.6926778 | up | ENST00000564394 | ENSG00000260279 | AC137932.1 | lncRNA |
| 3.4604343 | up | ENST00000524312 | ENSG00000253858 | AC008619.1 | lncRNA |
| 3.4312238 | up | ENST00000456018 | ENSG00000224029 | AL450344.1 | lncRNA |
| 3.3780431 | up | ENST00000568362 | ENSG00000261838 | AC092718.6 | lncRNA |
| 3.0036884 | up | compmerge.1425.pooled.chr11 | ENSG00000247271 | ZBED5‐AS1 | lncRNA |
| 2.8095972 | up | ENST00000632196 | ENSG00000282602 | Z82244.2 | lncRNA |
| 2.7601381 | up | ENST00000635432 | ENSG00000282916 | AP003171.3 | lncRNA |
| 2.6999693 | up | ENST00000422740 | ENSG00000212978 | AC016747.1 | lncRNA |
| 2.4666272 | up | ENST00000446687 | ENSG00000231605 | LINC01363 | lncRNA |
| 2.4239297 | up | ENST00000428590 | ENSG00000232046 | LINC01798 | lncRNA |
| 1.5001362 | down | ENST00000414195 | ENSG00000226674 | TEX41 | lncRNA |
| 1.5002085 | down | T289688 | G067726 | G067726 | lncRNA |
| 1.500596 | down | ENST00000436758 | ENSG00000234336 | JAZF1‐AS1 | lncRNA |
| 1.5069038 | down | ENST00000505784 | ENSG00000249782 | AC027328.1 | lncRNA |
| 1.5070809 | down | ENST00000451318 | ENSG00000224992 | AL445645.1 | lncRNA |
| 1.5081176 | down | ENST00000649715 | ENSG00000285884 | AL022345.4 | lncRNA |
| 1.5092072 | down | ENST00000507269 | ENSG00000253613 | AC008572.1 | lncRNA |
| 1.5092504 | down | ENST00000534827 | ENSG00000254813 | AC123777.1 | lncRNA |
| 1.512115 | down | ENST00000470532 | ENSG00000240973 | AC093714.1 | lncRNA |
| 1.5214485 | down | NR_047689 | ENSG00000164776 | PHKG1 | lncRNA |
3.3. Gene microarray
We used gene microarray technology to study the lncRNA and mRNA expression profiles of exosomes. Compared with the BPE group, the expression of 392 lncRNAs (177 upregulated and 215 downregulated) in the MPE exosomes were significantly changed (2‐fold change, p < 0.05; Figure 2A,B). In addition, the expression of 202 mRNAs (79 upregulated and 123 downregulated) were significantly changed (Figure 2C). The upregulated and downregulated differentially expressed genes (DEGs) are listed in Tables 4 and 5.
FIGURE 2.
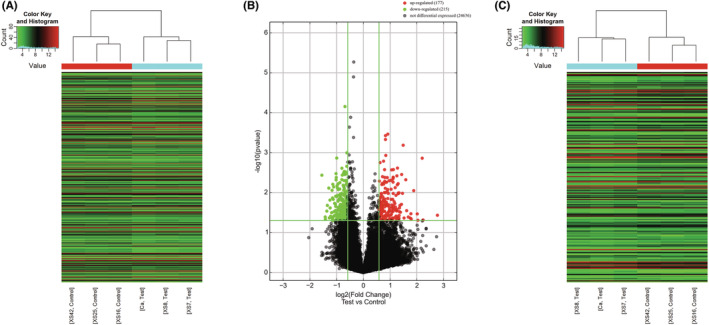
RNA gene microassay. (A and B) Heat map and volcano plots of differentially expressed lncRNAs in exosomes of MPE and BPE. (C) Heat map of differentially expressed mRNAs in exosomes of MPE and BPE.
TABLE 4.
Some upregulated and downregulated differentially expressed mRNAs
| Fold change | Regulation | Transcript_ID | GeneID | GeneSymbol | Type |
|---|---|---|---|---|---|
| 4.4286646 | up | ENST00000623960 | ENSG00000277117 | FP565260.3 | protein_coding |
| 4.3201504 | up | ENST00000491148 | ENSG00000153002 | CPB1 | protein_coding |
| 3.1587791 | up | ENST00000597630 | ENSG00000268041 | AC010616.1 | protein_coding |
| 3.1306366 | up | ENST00000304283 | ENSG00000168096 | ANKS3 | protein_coding |
| 2.9906999 | up | ENST00000473414 | ENSG00000114744 | COMMD2 | protein_coding |
| 2.8067314 | up | ENST00000323110 | ENSG00000179142 | CYP11B2 | protein_coding |
| 2.7368841 | up | ENST00000359562 | ENSG00000164107 | HAND2 | protein_coding |
| 2.7148518 | up | ENST00000284440 | ENSG00000154277 | UCHL1 | protein_coding |
| 2.5492268 | up | ENST00000400377 | ENSG00000160223 | ICOSLG | protein_coding |
| 2.5238625 | up | NM_001352769 | ENSG00000228696 | ARL17B | protein_coding |
| 1.5000265 | down | ENST00000263346 | ENSG00000141002 | TCF25 | protein_coding |
| 1.5011773 | down | ENST00000311764 | ENSG00000175213 | ZNF408 | protein_coding |
| 1.5034306 | down | ENST00000302287 | ENSG00000170419 | VSTM2A | protein_coding |
| 1.5068701 | down | ENST00000357726 | ENSG00000116726 | PRAMEF12 | protein_coding |
| 1.5094658 | down | ENST00000231188 | ENSG00000113262 | GRM6 | protein_coding |
| 1.5099763 | down | ENST00000373044 | ENSG00000196449 | YRDC | protein_coding |
| 1.5119604 | down | ENST00000380739 | ENSG00000021355 | SERPINB1 | protein_coding |
| 1.5173339 | down | ENST00000368009 | ENSG00000158793 | NIT1 | protein_coding |
| 1.5189563 | down | ENST00000511217 | ENSG00000156463 | SH3RF2 | protein_coding |
| 1.5260833 | down | ENST00000222250 | ENSG00000105643 | ARRDC2 | protein_coding |
TABLE 5.
Primer sequence of upregulated lncRNAs to be verified
| Primer(F) | Sequence (5′ to 3′) | Primer (R) | Sequence (5′ to 3′) |
|---|---|---|---|
| LINC00452‐F | TGTGAGTGACCAGTGCATCC | LINC00452‐R | GCTGCCCATTCCCTTACCTT |
| AC137932.1‐F | AGGAGACACAGGCCACGATA | AC137932.1‐R | TTCCATGAGCTGTAACCGCC |
| ZBED5‐AS1‐F | CTCAAACTTCACTAGCCCCGT | ZBED5‐AS1‐R | GAATGGGATGGGAGGACACA |
| AL118505.1‐F | GACTGGAAGCCCAATTGGTAGA | AL118505.1‐R | GGTCCACACACATGCGTCA |
| FMN1‐F | GCTCAGTCGATCCTGACCTG | FMN1‐R | GGGTCCCTAGCTTCCTTTCAC |
| AL109811.2‐F | TCGTCCAGAATCCATCAGCC | AL109811.2‐R | ACCTCTATGTCCCACTGATGC |
| CATG00000040683.1‐F | TTCATGATTCCCCCAGGTGC | CATG00000040683.1‐R | GGTGATTCCTAACGGGCACA |
| Z82244.2‐F | CTCCCCGCACCACTGTTTTA | Z82244.2‐R | ACAGATGCCCCTCCATTTGA |
| AC016747.1‐F | CGGGACAGAAAAGCCTGAGAT | AC016747.1‐R | GAGTGCGGAAACATGACTGG |
| LINC01363‐F | GGATGCTAGCAGTACCCAGG | LINC01363‐R | CTGTTGGTAGTCATGGGCCT |
| LINC01798‐F | AGACTGGGAGACCCAAACCA | LINC01798‐R | CTGAAGAATCCCAAAGCCGC |
3.4. GO enrichment analysis of DEGs
We analyzed these differentially expressed mRNA through GO enrichment analysis of biological process (BP), cellular component (CC), and molecular function (MF).
The results showed that upregulated genes were involved in response to acidic PH, cartilage morphogenesis, response to potassium ion, and other BPs (Figure 3A). Some of the upregulated DEGs were related to CC, including endoplasmic reticulum, nuclear outer membrane‐endoplasmic reticulum membrane network, sarcoplasmic reticulum membrane, and NLRP3 inflammasome complex (Figure 3B). In addition, some upregulated DEGs were involved in MFs in cells, such as DNA binding, cyclase activity, ion‐antiporter activity, and activating transcription factor binding (Figure 3C).
FIGURE 3.
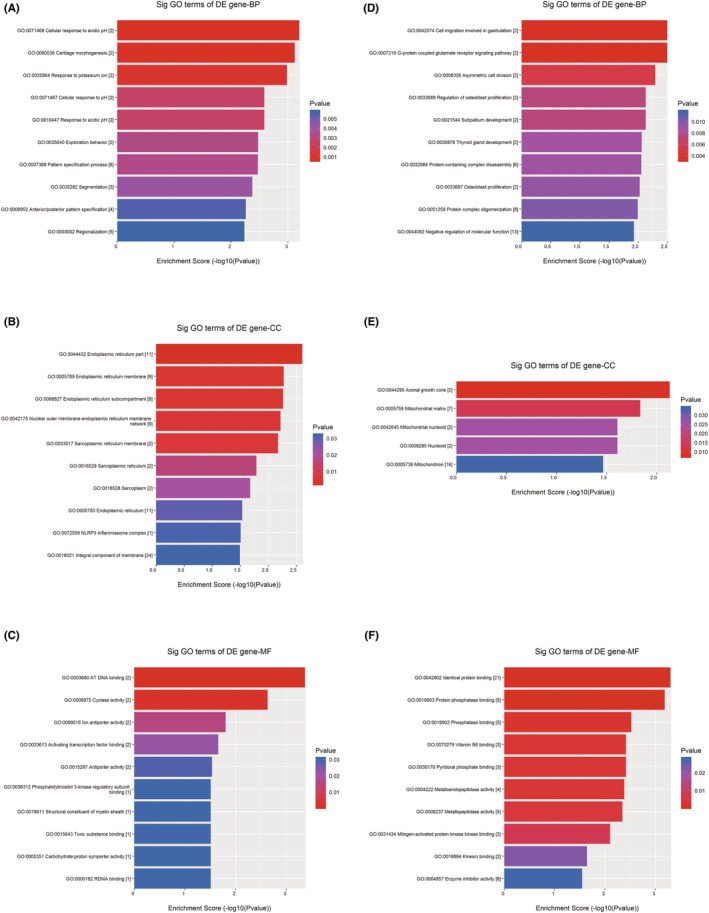
GO enrichment analysis of DEGs. (A) BPs related to upregulated genes. (B) CCs related to upregulated genes. (C) MFs related to upregulated genes. (D) BPs related to downregulated genes. (E) CCs related to downregulated genes. (F) MFs related to downregulated genes.
The downregulated DEGs involved in BPs included cell migration, G‐protein coupled glutamate receptor signaling pathway, cell division asymmetry, regulation of osteoblast proliferation, and subcortical development (Figure 3D). Some genes were related to CC—axonal growth cone and mitochondrial matrix (Figure 3E). Finally, the downregulated genes involved in MFs were identical protein binding, protein phosphatase binding, phosphatase binding, vitamin B6 binding, and pyridoxal phosphate binding (Figure 3F).
3.5. KEGG pathway analysis of DEGs
We conducted pathway analysis of differentially expressed mRNAs through the KEGG pathway database, and the results showed that upregulated genes were involved in a total of 20 regulatory pathways, among which V. cholerae infection, Parkinson's disease, cell adhesion molecules (CAMs), and Cushing's syndrome pathways were most likely involved (Figure 4A,C). Downregulated genes were involved in 13 pathways, including glyoxylate and dicarboxylate metabolism, rheumatoid arthritis and glycine, and the serine and threonine metabolism pathway (Figure 4B,D).
FIGURE 4.
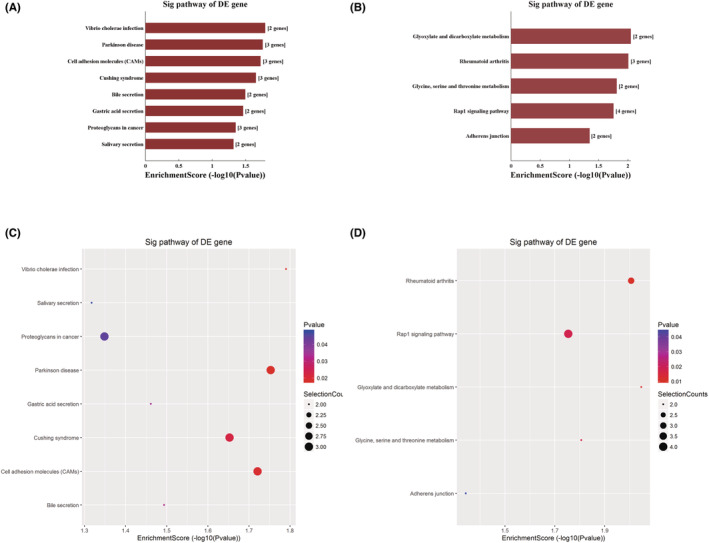
KEGG pathway analysis of DEGs. (A) Significantly upregulated genes. (B) Downregulated genes. (C and D) KEGG pathway enrichment dot plot of the significantly (C) upregulated genes and (D) downregulated genes.
3.6. Verification of upregulated lncRNA expression
For some upregulated lncRNAs expressed in the gene microarray analysis, we extracted the exosomes of BPE and MPE and performed RT‐qPCR to verify the consistency of expression. We found that the RT‐qPCR results of these lncRNAs were generally consistent with the results of gene microassay, with significantly higher expression in MPE than in BPE—LINC00452 (p = 0.014), AC137932.1 (p = 0.014), ZBED5‐AS1 (p < 0.05), AL118505.1 (p = 0.014), FMN1 (p < 0.05), AL109811.2 (p = 0.014), CATG00000040683.1 (p < 0.05), Z82244.2 (p = 0.014), AC016747.1 (p = 0.037), LINC01363 (p = 0.014), and LINC01798 (p = 0.037) (Figure 5A).
FIGURE 5.
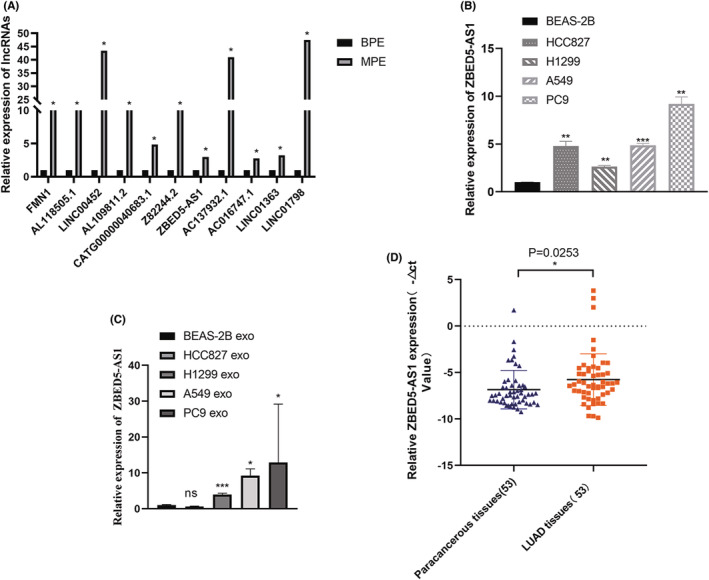
Verification of lncRNA ZBED5‐AS1 expression. (A) The expression of MPE was significantly higher than that of BPE, which was consistent with the results of gene microassay. (B) The expression of ZBED5‐AS1 in HCC827, A549, PC9, H1299, and BEAS‐2B cell lines. (C) Expression of ZBED5‐AS1 in exosomes of LUAD cells. (D) The expression of ZBED5‐AS1 in LUAD and adjacent tissues. *p < 0.05, **p < 0.01, ***p < 0.001, ****p < 0.0001.
3.7. Verification of lncRNA ZBED5‐AS1 expression
Notably, lncRNA ZBED5‐AS1 was significantly upregulated in malignant pleural exosomes by up to three times compared with benign pleural exosomes (Figure 5A). Subsequently, we detected the relative expression of lncRNA ZBED5‐AS1 in four LUAD cell lines (A549, PC9, HCC827, and H1299) and BEAS‐2B cells using RT‐qPCR. The results showed that the expression of lncRNA ZBED5‐AS1 in LUAD cells was higher than that of BEAS‐2B cells (Figure 5B). In addition, we detected the expression of ZBED5‐AS1 in the exosomes of LUAD cells and found that the expression in PC9 cell‐secreted exosomes was the highest, and the expression in A549 and H1299 cell‐secreted exosomes decreased successively. However, the expression of ZBED5‐AS1 in exosomes secreted by HCC827 cells was not statistically significant compared with that in BEAS‐2B cells (Figure 5C). In addition, we examined lncRNA ZBED5‐AS1 expression in LUAD via RT‐qPCR and discovered that lncRNA ZBED5‐AS1 was expressed significantly higher in 53 LUAD tissues compared with their counterparts (Figure 5D). The lncRNA ZBED5‐AS1 is expected to be a new biomarker for the diagnosis and treatment of patients with LUAD.
3.8. The effect of ZBED5‐AS1 on the function of LUAD cells
To further understand the effect of ZBED5‐AS1 on LUAD cell function, we selected HCC827, A549, and H1299 lines for lentiviral transfection. HCC827 was transfected with oe‐ZBED5‐AS1 for ZBED5‐AS1 overexpression, whereas A549 and H1299 were transfected with si‐ZBED5‐AS1 for knockdown. Transfection efficiency was verified using RT‐qPCR and GFP expression (Figure 6A,B) at 72 h after transfection, which indicated successful transfection. In addition, we confirmed that the oe‐ZBED5‐AS1 group significantly promoted the proliferation (Figure 6C), invasion, migration (Figure 6D), and colony formation (Figure 6E) ability of HCC827 cells compared with the oe‐vector group. However, in A549 and H1299 cells, si‐ZBED5‐AS1 had an inhibitory effect on these abilities compared with the si‐vector (Figure 6C–E).
FIGURE 6.
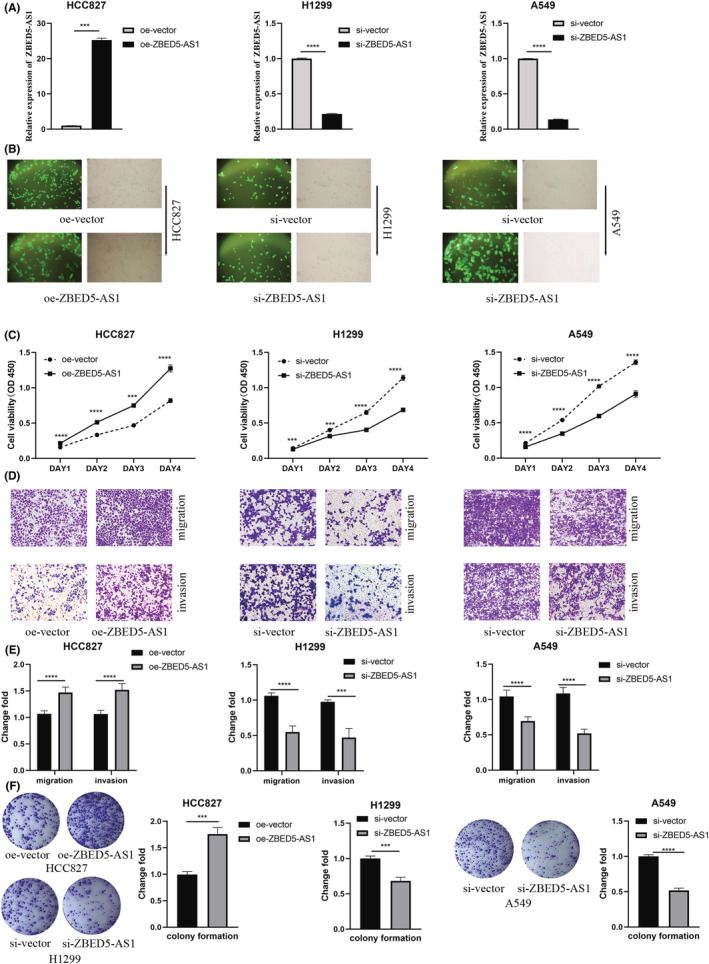
Verification of the cellular functional role of ZBED5‐AS1. (A, B) Lentivirus‐mediated ZBED5‐AS1 overexpression in HCC827 cells examined by RT‐qPCR and GFP expression map. (C) Absorbance of cells at 450 nm after ZBED5‐AS1 overexpression or knockdown in HCC827, A549, and H1299 cells. (D, E) Cell invasion and migration were detected by transwell assays after ZBED5‐AS1 overexpression or knockdown in HCC827, A549, and H1299 cells. (F) Colony‐forming ability of ZBED5‐AS1 after overexpression or knockdown in HCC827, A549, and H1299 cells. *p < 0.05, **p < 0.01, ***p < 0.001, ****p < 0.0001.
4. DISCUSSION
Lung cancer is the most common cause of MBP, and the presence of MBP indicates that the tumor has spread or has progressed to an advanced stage. 25 Tumor‐derived exosomes are involved in transducing intercellular information and promoting the growth and metastasis of tumor cells. 26 Studies have shown that human body fluid exosomes contain lncRNA, which can be used as a biomarker to diagnose cancer and predict prognosis. 27
In this study, we extracted exosomes and RNAs from BPE and MPE and used gene microassay to detect DEGs. The results showed that among the differentially expressed lncRNAs in BPE and MPE exosomes, 177 were upregulated, and 215 were downregulated, and for the mRNAs, 79 were upregulated and 123 were significantly downregulated.
Based on GO and KEGG pathways, which cluster functional genes into different biological processes, efficient clustering of functional genes can help to address complex issues. 28 The top three GO terms that derive the optimal feature set among the upregulated DEGs are1 BPs: “cellular response to acidic pH,” “cartilage morphogenesis,” and “response to potassium ion”;2 CCs: “endoplasmic reticulum part,” “endoplasmic reticulum membrane,” and “endoplasmic reticulum subcompartment”; and3 MFs: “at DNA binding,” “cyclase activity,” and “ion antiporter activity.” Thus, the endoplasmic reticulum plays a major role in cell function, and Li et al. have verified the necessity of subcellular localization in the study. 29 Furthermore, Hu et al. summarized the regulatory network of intracellular Ca+ homeostasis centered on the endoplasmic reticulum and highlight antitumor therapeutic strategies based on the regulation of Ca+ homeostasis. 30
Eight KEGG pathways, including V. cholerae infection, Parkinson's disease, CAMs, Cushing's syndrome, bile secretion, gastric acid secretion, proteoglycans in cancer, and salivary secretion, were associated with upregulated DEGs in MPE. Exosomes may offer a potential pathway for the spread of pathogenic α‐synuclein throughout the brain, according to recent reviews. Exosomes can transfer proteins and genetic material between cells, including mRNAs and miRNAs linked to pathology of Parkinson's disease, which is crucial for understanding how exosomes contribute to the development of certain diseases. 31 Adhesion molecules operate as mediators for interactions with the extracellular matrix and other cells in the microenvironment. These interactions between cells and the matrix control cell proliferation, differentiation, survival, and migration because of the connection between cell adhesion receptors and signal transduction pathways. As a result, immune evasion and metastasis are directly impacted by changes in the expression of CAMs and their ligands. 32 , 33 In a hepatocellular carcinoma study, NRAS, ITGA5, SEC14L2, SLC12A5, and SMAD2 were identified as prognostic factors that may affect patients through proteoglycans in cancer pathways. 34
We extracted exosomal RNA from BPE and MPE and identified 11 lncRNAs with the highest expression in the microarray results when analyzed using RT‐qPCR, including LINC00452, AC137932.1, ZBED5‐AS1, AL118505.1, FMN1, AL109811.2, CATG00000040683.1, Z82244.2, AC016747.1, LINC01363, and LINC01798. The RT‐qPCR results of most candidate lncRNAs were found to be correlated with the gene microassay results.
Tissue mechanics and metabolism is known to influence proliferation as well as migration and invasion, making them defining hallmarks of cancer. The majority of tumor factors exacerbate malignancies by promoting the growth, invasion, and migration of cancer cells. 35 A recent study showed that through suppressing miR‐188‐5p, the lncRNA DARS‐AS1 contributed to boosting LUAD proliferation, invasion, and migration. In addition, KLF12 was a downstream target of miR‐188‐5p as a result of research on DARS‐AS1/miR‐188‐5p, and this regulatory pathway was identified as DARS‐AS1/miR‐188‐5p/KLF12. 36 Moreover, WNT5A controls cell invasion and migration via bidirectionally regulating the epithelial–mesenchymal transition of mammary epithelial cells. 37
To confirm that ZBED5‐AS1 can facilitate LUAD cell proliferation, migration, and invasion in vitro, we created lentivirus knockdown and overexpression cell lines. RT‐qPCR results showed that lncRNA ZBED5‐AS1 was highly expressed in LUAD cells, tissues, and benign and malignant pleural fluid exosomes. In addition, we performed lentiviral transfection of LUAD cells to study the effect of ZBED5‐AS1 on cell function, and the results showed that ZBED5‐AS1 overexpression could significantly promote the proliferation, colony formation, migration, and invasion ability of LUAD cells, while knockdown had the opposite effect. Therefore, it is suggested that exosomal ZBED5‐AS1 plays an important role in the development of LUAD, and its mechanism needs to be further studied.
5. CONCLUSIONS
This study revealed the differential expression profiles of lncRNAs and mRNAs in exosomes of MPE and BPE, suggesting that exosomal lncRNA ZBED5‐AS1 is a non‐invasive biomarker for MPE in LUAD. Although there are no clear findings addressing the precise role of ZBED5‐AS1 in malignancies, preliminary validation from previous work has led us to assume it is a promising potential biomarker in LUAD.
AUTHOR CONTRIBUTIONS
All authors have reviewed the data analyses. XH, HZ, XY, FJ, and YW designed and conducted experiments, analyzed data, and wrote the article. XH, HZ, XY, WS, LH, and JW drafted and revised the article. XH, FZ, FS, FJ, and YW designed the study, supervised the research, and revised the article. All authors read and approved the final article.
FUNDING INFORMATION
This study was financially supported by the Zhejiang Provincial Natural Science Foundation (LQ22H200005), the Wenzhou Municipal Science and Technology Bureau of China (Y20210244), and the Zhejiang Provincial Research Center for Cancer Intelligent Diagnosis and Molecular Technology (JBZX‐202003).
CONFLICT OF INTEREST
The authors have no conflict of interest to declare.
Supporting information
Appendix S1. Supporting Information.
ACKNOWLEDGMENT
We would like to thank all colleagues of the Medical Laboratory Center of the First Affiliated Hospital of Wenzhou Medical University for their contributions.
Huang X, Zhou H, Yang X, et al. Construction and analysis of expression profile of exosomal lncRNAs in pleural effusion in lung adenocarcinoma. J Clin Lab Anal. 2022;36:e24777. doi: 10.1002/jcla.24777
Xiaolu Huang and Huixin Zhou contributed equally.
Contributor Information
Feng Jiang, Email: jiangfeng5945@126.com.
Yumin Wang, Email: wangyumin0577@wmu.edu.cn.
DATA AVAILABILITY STATEMENT
Requests for data, resources, and reagents should be directed to the corresponding author Yumin Wang (wangyumin0577@wmu.edu.cn).
REFERENCES
- 1. Zang J, Hu Y, Xu X, et al. Elevated serum levels of vascular endothelial growth factor predict a poor prognosis of platinum‐based chemotherapy in non‐small cell lung cancer. Onco Targets Ther. 2017;10:409‐415. [DOI] [PMC free article] [PubMed] [Google Scholar]
- 2. Denisenko TV, Budkevich IN, Zhivotovsky B. Cell death‐based treatment of lung adenocarcinoma. Cell Death Dis. 2018;9(2):117. [DOI] [PMC free article] [PubMed] [Google Scholar]
- 3. Allemani C, Matsuda T, Di Carlo V, Harewood R, Matz M, Nikšić M. Global surveillance of trends in cancer survival 2000–14 (CONCORD‐3): analysis of individual records for 37 513 025 patients diagnosed with one of 18 cancers from 322 population‐based registries in 71 countries. Lancet. 2018;391(10125):1023‐1075. [DOI] [PMC free article] [PubMed] [Google Scholar]
- 4. Zhang H, Li C, Hu F, et al. Auxiliary diagnostic value of tumor biomarkers in pleural fluid for lung cancer‐associated malignant pleural effusion. Respir Res. 2020;21(1):284. [DOI] [PMC free article] [PubMed] [Google Scholar]
- 5. Braunschweig R, Yan P, Guilleret I, et al. Detection of malignant effusions: comparison of a telomerase assay and cytologic examination. Diagn Cytopathol. 2001;24(3):174‐180. [DOI] [PubMed] [Google Scholar]
- 6. Zhang Y, Kwon W, Lee HY, et al. Imaging assessment of visceral pleural surface invasion by lung cancer: comparison of CT and contrast‐enhanced radial T1‐weighted gradient Echo 3‐tesla MRI. Korean J Radiol. 2021;22(5):829‐839. [DOI] [PMC free article] [PubMed] [Google Scholar]
- 7. Feng M, Ye X, Chen B, et al. Detection of circulating genetically abnormal cells using 4‐color fluorescence in situ hybridization for the early detection of lung cancer. J Cancer Res Clin Oncol. 2021;147(8):2397‐2405. [DOI] [PMC free article] [PubMed] [Google Scholar]
- 8. Keerthikumar S, Chisanga D, Ariyaratne D, et al. ExoCarta: a web‐based compendium of Exosomal cargo. J Mol Biol. 2016;428(4):688‐692. [DOI] [PMC free article] [PubMed] [Google Scholar]
- 9. Lima LG, Ham S, Shin H, et al. Tumor microenvironmental cytokines bound to cancer exosomes determine uptake by cytokine receptor‐expressing cells and biodistribution. Nat Commun. 2021;12(1):3543. [DOI] [PMC free article] [PubMed] [Google Scholar]
- 10. Worku T, Bhattarai D, Ayers D, et al. Long non‐coding RNAs: the new horizon of Gene regulation in ovarian cancer. Cell Physiol Biochem. 2017;44(3):948‐966. [DOI] [PubMed] [Google Scholar]
- 11. Su W, Wang L, Zhao H, et al. LINC00857 interacting with YBX1 to regulate apoptosis and autophagy via MET and phosphor‐AMPKa signaling. Mol Ther Nucleic Acids. 2020;22:1164‐1175. [DOI] [PMC free article] [PubMed] [Google Scholar]
- 12. Han F, Yang S, Wang W, Huang X, Huang D, Chen S. Silencing of lncRNA LINC00857 enhances BIRC5‐dependent radio‐sensitivity of lung adenocarcinoma cells by recruiting NF‐kappaB1. Mol Ther Nucleic Acids. 2020;22:981‐993. [DOI] [PMC free article] [PubMed] [Google Scholar] [Retracted]
- 13. Wang A, Zhang T, Wei W, et al. The long noncoding RNA LINC00665 facilitates c‐Myc transcriptional activity via the miR‐195‐5p MYCBP Axis to promote progression of lung adenocarcinoma. Front Oncol. 2021;11:666551. [DOI] [PMC free article] [PubMed] [Google Scholar]
- 14. de Abreu RC, Fernandes H, da Costa Martins PA, Sahoo S, Emanueli C, Ferreira L. Native and bioengineered extracellular vesicles for cardiovascular therapeutics. Nat Rev Cardiol. 2020;17(11):685‐697. [DOI] [PMC free article] [PubMed] [Google Scholar]
- 15. Li Y, Zheng Q, Bao C, et al. Circular RNA is enriched and stable in exosomes: a promising biomarker for cancer diagnosis. Cell Res. 2015;25(8):981‐984. [DOI] [PMC free article] [PubMed] [Google Scholar]
- 16. Hu F, Liu J, Liu H, et al. Role of Exosomal non‐coding RNAs in gastric cancer: biological functions and potential clinical applications. Front Oncol. 2021;11:700168. [DOI] [PMC free article] [PubMed] [Google Scholar]
- 17. Han HS, Yun J, Lim SN, et al. Downregulation of cell‐free miR‐198 as a diagnostic biomarker for lung adenocarcinoma‐associated malignant pleural effusion. Int J Cancer. 2013;133(3):645‐652. [DOI] [PubMed] [Google Scholar]
- 18. Shin YM, Yun J, Lee OJ, et al. Diagnostic value of circulating extracellular miR‐134, miR‐185, and miR‐22 levels in lung adenocarcinoma‐associated malignant pleural effusion. Cancer Res Treat. 2014;46(2):178‐185. [DOI] [PMC free article] [PubMed] [Google Scholar]
- 19. Kim Y, Shin S, Lee KA. Exosome‐based detection of EGFR T790M in plasma and pleural fluid of prospectively enrolled non‐small cell lung cancer patients after first‐line tyrosine kinase inhibitor therapy. Cancer Cell Int. 2021;21(1):50. [DOI] [PMC free article] [PubMed] [Google Scholar]
- 20. Gene Ontology Consortium . Gene ontology consortium: going forward. Nucleic Acids Res. 2015;43(Database issue):D1049‐D1056. [DOI] [PMC free article] [PubMed] [Google Scholar]
- 21. Kanehisa M, Sato Y, Kawashima M, Furumichi M, Tanabe M. KEGG as a reference resource for gene and protein annotation. Nucleic Acids Res. 2016;44(D1):D457‐D462. [DOI] [PMC free article] [PubMed] [Google Scholar]
- 22. Jumai K, Zhang T, Qiao B, et al. Highly expressing SCARA5 promotes proliferation and migration of esophageal squamous cell carcinoma. J Immunol Res. 2022;2022:2555647. [DOI] [PMC free article] [PubMed] [Google Scholar]
- 23. Cai S, Zhang K, Wei F, et al. Differential proteomic and genomic comparison of resistance mechanism of Pseudomonas aeruginosa to Cefoperazone sodium/sulbactam sodium. An Acad Bras Cienc. 2022;94(3):e20211160. [DOI] [PubMed] [Google Scholar]
- 24. Li N, Zhan X. Identification of clinical trait‐related lncRNA and mRNA biomarkers with weighted gene co‐expression network analysis as useful tool for personalized medicine in ovarian cancer. EPMA J. 2019;10(3):273‐290. [DOI] [PMC free article] [PubMed] [Google Scholar]
- 25. Feng M, Zhu J, Liang L, et al. Diagnostic value of tumor markers for lung adenocarcinoma‐associated malignant pleural effusion: a validation study and meta‐analysis. Int J Clin Oncol. 2017;22(2):283‐290. [DOI] [PubMed] [Google Scholar]
- 26. Barros FM, Carneiro F, Machado JC, Melo SA. Exosomes and immune response in cancer: friends or foes? Front Immunol. 2018;9:730. [DOI] [PMC free article] [PubMed] [Google Scholar]
- 27. Kok VC, Yu CC. Cancer‐derived exosomes: their role in cancer biology and biomarker development. Int J Nanomedicine. 2020;15:8019‐8036. [DOI] [PMC free article] [PubMed] [Google Scholar]
- 28. Liang L, Yu J, Li J, et al. Integration of scRNA‐seq and bulk RNA‐seq to analyse the heterogeneity of ovarian cancer immune cells and establish a molecular risk model. Front Oncol. 2021;11:711020. [DOI] [PMC free article] [PubMed] [Google Scholar]
- 29. Li G, Li M, Wang J, Wu J, Wu FX, Pan Y. Predicting essential proteins based on subcellular localization, orthology and PPI networks. BMC Bioinformatics. 2016;17(Suppl 8):279. [DOI] [PMC free article] [PubMed] [Google Scholar]
- 30. Zheng S, Wang X, Zhao D, Liu H, Hu Y. Calcium homeostasis and cancer: insights from endoplasmic reticulum‐centered organelle communications. Trends Cell Biol. 2022. doi: 10.1016/j.tcb.2022.07.004 [DOI] [PubMed] [Google Scholar]
- 31. Pinnell JR, Cui M, Tieu K. Exosomes in Parkinson disease. J Neurochem. 2021;157(3):413‐428. [DOI] [PMC free article] [PubMed] [Google Scholar]
- 32. Strilic B, Offermanns S. Intravascular survival and extravasation of tumor cells. Cancer Cell. 2017;32(3):282‐293. [DOI] [PubMed] [Google Scholar]
- 33. Cooper J, Giancotti FG. Integrin signaling in cancer: Mechanotransduction, stemness, epithelial plasticity, and therapeutic resistance. Cancer Cell. 2019;35(3):347‐367. [DOI] [PMC free article] [PubMed] [Google Scholar]
- 34. Zhou D, Dong L, Yang L, et al. Identification and analysis of circRNA‐miRNA‐mRNA regulatory network in hepatocellular carcinoma. IET Syst Biol. 2020;14(6):391‐398. [DOI] [PMC free article] [PubMed] [Google Scholar]
- 35. Zanotelli MR, Zhang J, Reinhart‐King CA. Mechanoresponsive metabolism in cancer cell migration and metastasis. Cell Metab. 2021;33(7):1307‐1321. [DOI] [PMC free article] [PubMed] [Google Scholar]
- 36. Liu YLL, Ji L, Zhang F, Chen D, Duan S. Potentiated lung adenocarcinoma (LUAD) cell growth, migration and invasion by lncRNA DARS‐AS1 via miR‐188‐5p/ KLF12 axis. Aging (Albany NY). 2021;13(19):23376‐23392. [DOI] [PMC free article] [PubMed] [Google Scholar]
- 37. Prasad CP, Chaurasiya SK, Guilmain W, Andersson T. WNT5A signaling impairs breast cancer cell migration and invasion via mechanisms independent of the epithelial‐mesenchymal transition. J Exp Clin Cancer Res. 2016;35(1):144. [DOI] [PMC free article] [PubMed] [Google Scholar]
Associated Data
This section collects any data citations, data availability statements, or supplementary materials included in this article.
Supplementary Materials
Appendix S1. Supporting Information.
Data Availability Statement
Requests for data, resources, and reagents should be directed to the corresponding author Yumin Wang (wangyumin0577@wmu.edu.cn).