


Abstract
Despite being a member of the chromodomain helicase DNA-binding protein family, little is known about the exact role of CHD6 in chromatin remodeling or cancer disease. Here we show that CHD6 binds to chromatin to promote broad nucleosome eviction for transcriptional activation of many cancer pathways. By integrating multiple patient cohorts for bioinformatics analysis of over a thousand prostate cancer datasets, we found CHD6 expression elevated in prostate cancer and associated with poor prognosis. Further comprehensive experiments demonstrated that CHD6 regulates oncogenicity of prostate cancer cells and tumor development in a murine xenograft model. ChIP-Seq for CHD6, along with MNase-Seq and RNA-Seq, revealed that CHD6 binds on chromatin to evict nucleosomes from promoters and gene bodies for transcriptional activation of oncogenic pathways. These results demonstrated a key function of CHD6 in evicting nucleosomes from chromatin for transcriptional activation of prostate cancer pathways.
INTRODUCTION
Many investigations suggested epigenetic reprogramming, along with the acquisition of genomic mutations, to be a hallmark of cancers (1–4). As one of the major mechanisms in epigenetic reprogramming (5,6), chromatin remodeling includes assembling, evicting, and sliding nucleosomes on DNA by remodeling factors (7,8). It occurs in many cellular processes including cell survival (9), cell differentiation (10), and tumor development (11). The remodeling factors are proteins that utilize the energy released by ATP hydrolysis to remodel nucleosome positioning (12). Such remodeling of nucleosome positioning on cis-regulatory elements in the genome consequently influences the binding of transcription factors and transcriptional machinery, and thereby leads to either transcriptional activation or repression of associated genes (13). Dysregulation of chromatin remodeling in cancer can cause both aberrant activation and improper silencing of important cancer pathways (14–16). Emerging evidence suggests that chromatin remodeling orchestrates multiple facets of cancer progression, such as oncogenic transformation (17), metastases (18), and development of drug resistance (14).
Four families of chromatin remodeling factors have been characterized, including the switching defective/sucrose nonfermenting (SWI/SNF) (19,20), imitation switch (ISWI) (21), inositol requiring 80 (INO80) (22), and chromodomain helicase DNA-binding protein (CHD) families (23). The CHD family includes nine members, each featured with two chromodomains and an ATPase-helicase domain (24). The proteins in this family were found to play important functions and be associated with multiple diseases. For instance, mutations of CHD6 were reported in patients with intellectual disability (25), mental retardation (26,27), Hallermann-Streiff syndrome (28), and might be associated with motor coordination (29,30). Transcriptome analysis indicated that CHD6 expression is associated with porcine embryonic muscle development (31) and preadipocyte differentiation in the chicken (32). CHD6 is a DNA-dependent ATPase (33). It was reported to play important roles in DNA damage and repair (34) and could be induced by treating cells with low-dose irradiation (35). CHD6 promotes cell survival when cells suffer chronic oxidative stress, as it functions as a key component of the oxidative DNA damage response (9). It acts as a transcriptional repressor of different viruses including influenza and papilloma viruses (36–40). For instance, the interaction of the papillomavirus E8–E2C protein with the cellular CHD6 protein contributes to transcriptional repression (40). Meanwhile, the interaction with CHD6 is required for activation of transcription by the transcription factor Nrf2 (41). In vitro biochemical analysis of purified CHD6, CHD7, and CHD8 indicated that CHD7 and CHD8 slide nucleosomes to alter nucleosome position, whereas CHD6 disrupts nucleosomes in a non-sliding manner (23). A previous investigation at the CFTR locus indicated that CHD6 could interact with multiple transcription complexes to regulate three-dimensional chromatin structure (42). ChIP-Seq analysis of six CHD family proteins in mouse embryonic stem cells indicated that CHD6 could bind both the + 1 and -1 nucleosomes flanking the nucleosome free region near the transcription start site (43). Intriguingly, although CHD6 appears to bind promoter of active genes, transcriptome analysis indicated that depletion of CHD6 is also associated with up regulation of bivalent genes in embryonic stem cells (43). Therefore, the binding of CHD6 and its effect on nucleosome positioning or gene expression across the human genome is yet unclear and awaiting a meticulous investigation.
Multiple members of the CHD family have been reported to play oncogenic or tumor suppressive roles in cancers. CHD1 functions as a tumor suppressor in prostate cancer by modulating the recruitment of androgen receptor (AR) to promoters of AR-responsive tumor suppressor genes (44). CHD1 is a synthetic-essential gene in PTEN-deficient prostate cancer cells and functions by remodeling the immunosuppressive tumor microenvironment (14,45,46). CHD1 loss results in the redistribution of AR to accessible DNAs enriched with the oncogenic AR cofactor HOXB13, which leads to the activation of tumor-promoting pathways (14,15). CHD5 was also considered as a tumor suppressor in a variety of cancers (47). It was reported that CHD5 positively regulates the p53-mediated pathway in controlling cell proliferation, apoptosis, and senescence (48). On the other hand, CHD4 was found to be an oncogene that silences tumor suppressor genes in colorectal cancer (49). In contrast to these other CHD proteins, the role of CHD6 in cancer remains unappreciated. Liquid chromatography and tandem mass spectrometry analysis of plasma samples revealed that CHD6 is one of the many proteins showing a changed abundance of peptides in ovarian patient plasma when compared to control plasma (50). Genomic analysis revealed CHD6 as one of the many genes likely affected by mutations in bladder cancer (51,52) and colorectal cancer (53,54). A case report based on fluorescence in situ hybridization (FISH) analysis of a 78-year-old acute myeloid leukemia patient suggested that a genomic translocation likely resulted in a LMBRD1–CHD6 fusion (55). Despite these observed associations, the function of CHD6 in cancer and the associated mechanism are not yet reported.
Transcription factors in the E2F family orchestrate the expression of genes crucial for cell cycle progression (56). Dysregulation of the cell cycle contributes to the uncontrolled proliferation of tumor cells and cancer metastasis (56,57). Aberrant activity of E2F1 has been observed in many cancers including breast cancer, non-small cell lung carcinoma, and prostate cancer (58). For instance, E2F1 interacts with ACTR, a member of the p160/SRC nuclear coactivator family, and is recruited to the promoter of genes that promote the proliferation of breast cancer cells (59). E2F1 was reported to transcriptionally activate EZH2, which is required for the proliferation of cancer cells (60,61). E2F1 was negatively regulated by the tumor suppressor gene Retinoblastoma 1 (RB1), whose loss in prostate cancer confers resistance to antiandrogen therapy (62). Intriguingly, of the 18 most common alternations of genes and pathways in metastatic castration-resistant prostate cancer patients, RB1 loss was found to show the strongest correlation with poor clinical outcomes (63). While transcriptional regulation of E2F1 by some transcriptional factors was reported before, the alteration of chromatin structure around the E2F1 locus and how this contributes to tumor progression is unclear.
Despite successes of radiation therapy, chemotherapy, and androgen depletion therapy for many patients, prostate cancer still represents the leading malignancy and cancer-related death in males worldwide (64). Understanding the full molecular mechanisms underlying prostate cancer is fundamental for developing new therapeutic strategies toward a complete cure. Here, we report the unappreciated role of the CHD family protein CHD6 as a new oncogene in prostate cancer, illustrate how CHD6 functions epigenetically in transcriptional activation of many crucial cancer pathways, and demonstrate how depletion of CHD6 impairs oncogenic features of RB1-deficient prostate cancer.
MATERIALS AND METHODS
Cell culture
Human prostate cancer cell lines C4-2 was a kind gift from Dr. Leland Chung and PC-3 was purchased from ATCC. Benign prostatic hyperplasia epithelial cell line BPH-1 was a kind gift from Dr. Xuesen Dong. All the three cell lines were cultured in RPMI-1640 complete medium with 10% FBS. The cell line HEK293T was purchased from ATCC and grown in DMEM complete medium with 10% FBS. Platinum-A cell was a kind gift from Dr. Xianchang Li and grown in DMEM complete medium supplemented with 10% FBS and 10 μg/mL Blasticidin. All the cells were incubated at 37°C with 5% CO2 and continuously cultured for less than 2 months. The cell line identity was authenticated by short tandem repeat (STR) genotyping provided by the University of Arizona Genetics Core. Cell lines were mycoplasma-negative in routine tests.
Plasmids, transfection, lentiviral and retroviral production, and infection
The CHD6, E2F1 and RB1 shRNA plasmids were obtained from MISSION shRNA library (Sigma). To construct CHD6 overexpression plasmid, DNA fragment of CHD6 coding DNA sequence (NCBI Gene, NM032221.5) with 3 × FLAG was cloned into pMYs-IRES-GFP vector. To construct E2F1 overexpression plasmid, DNA fragment of E2F1 coding DNA sequence (NCBI Gene, NM_005225.3) was cloned into pMYs-IRES-GFP vector. Primers using for cloning are:
| Primers | Sequences |
|---|---|
| E2F1 CDS cloning-F | ATAGGATCCATGGCCTTGGCCGGGGCC |
| E2F1 CDS cloning-R | CCAGGAATTCTCAGAAATCCAGGGGGGTG |
| CHD6 CDS cloning-F (Tags included) | TGACGAATTCGCCACCATGAAAATGAAAATACAGAAAAAAGAGAAGCAGTTGTCAAATTTAAAAGTTTTGAATCACTCCCCAATGTCTGATGCCT |
| CHD6 CDS cloning-R (Tags included) | TACAGCGGCCGCTCACTTGTCATCGTCATCCTTGTAGTCGATGTCATGATCTTTATAATCACCGTCATGGTCTTTGTAATCCTCGAGAAGCTTATTGGTGTCGTTGTTGGAGTCTT |
Lentivirus was produced by co-transfection of shRNA plasmids with packaging plasmids pMD2.G and psPAX2 into HEK293T cells on 6-well plate. Briefly, for each virus, 70% confluence HEK293T cells were transfected with 1μg target plasmid, 250 ng pMD2.G, 750 ng psPAX2, 4 μL Lipofectamine 3000 and 4 μL P3000 reagent (Life Technologies). Fresh DMEM complete medium with 10% FBS was added to HEK293T cells 24 hours after transfection. After 48 hours, viral supernatants were harvested and centrifuged at 800 g for 10 min to pellet cell debris and used for infection. To make retrovirus, the target plasmid was transfected into Platinum-A cells by using Lipofectamine 3000 reagent. After the first 24 hours of transfection, the medium was changed to fresh DMEM complete medium with 10% FBS, and 48 and 72 hours after transfection, the supernatants were pooled, centrifuged at 800 g for 10 min, and used for infection.
For infection, a total of 3 × 10⁵ C4-2, PC-3 or BPH-1 cells were seeded on 6-well plate one day prior to transduction. The virus was supplemented with 10 μg/mL polybrene and added to cells. After 24 hours, medium was changed to fresh RPMI-1640 complete medium with 10% FBS and cells were harvested for assays at 48 hours after infection.
RT-qPCR and western blot
Total RNA was isolated from cells using the RNA MiniPrep kit (ZYMO Research) and cDNA was generated by using amfiRivert cDNA Synthesis Platinum Master Mix (GenDEPOT). qPCR was performed using SYBR Green PCR Master Mix (Bio-Rad, Hercules, CA, USA).
To extract protein, cells were treated in cold RIPA buffer containing protease inhibitor. The cell lysate was gathered using scraper followed by homogenization with 27-gauge needle and 30-gauge needle for eight times, respectively. To denature proteins, lysates were added to 4 × loading buffer and heated to 95°C for 10 min. Total cell lysate (30–50 μg) were loaded onto SDS PAGE gels, and then transferred to PVDF membranes. Blots were incubated with primary antibodies overnight at 4°C, followed by detection with secondary antibody.
The qPCR primers include:
| Primers | Sequences |
|---|---|
| CHD6 qPCR-F | GGAGAACCTCCGTTCGACTTG |
| CHD6 qPCR-R | CAGGCTCCGTAAAAATGTGCT |
| E2F1 qPCR-F | ACAACATCCAGTGGGTAGGC |
| E2F1 qPCR-R | GTTGGCCTTGTCCTCAGTCA |
| RB1 qPCR-F | CTCTCGTCAGGCTTGAGTTTG |
| RB1 qPCR-R | GACATCTCATCTAGGTCAACTGC |
| hGAPDH qPCR-F | GTCTCCTCTGACTTCAACAGCG |
| hGAPDH qPCR-R | ACCACCCTGTTGCTGTAGCCAA |
| hHPRT qPCR-F | TTCCTTGGTCAGGCAGTATAATCC |
| hHPRT qPCR-R | AGTCTGGCTTATATCCAACACTTCG |
| mGAPDH qPCR-F | GAGTTGCTGTTGAAGTCGCA |
| mGAPDH qPCR-R | TGTAGACCATGTAGTTGAGGTCA |
The antibodies used for western blot and Chip include:
| Target | Company | Catalog No. | Source | Dilution |
|---|---|---|---|---|
| CHD6 | Bethyl | A301-221A | Rabbit | WB: 1:1000; ChIP: 10 μg/mg lysate |
| IgG | Millipore | 12-370 | Rabbit | ChIP: 10 μg/mg lysate |
| E2F1 | Cell Signaling | 3742S | Rabbit | WB: 1:1000 |
| RB1 | Cell Signaling | 9309S | Mouse | WB: 1:1000 |
| GAPDH | Santa Cruz | SC-32233 | Mouse | WB: 1:5000 |
Cell function assay
To assess cell growth, cells after viral infection were seeded in a 96-well plate at a density of 3000 cells per well in RPMI-1640 complete medium with 10% FBS. Cells were allowed to attach for 24 hours and then cell viability was monitored utilizing CellTiter-Glo® Luminescent Cell Viability Assay (Promega, Madison, WI, USA) for 4–6 days. For colony formation, 500 cells were seeded in 6-well plate and cultured for one week. Colonies were fixed using 1% formaldehyde for at least 30 min and then stained with 0.1% crystal violet overnight.
For wound healing assay, cells were pre-treated with 0.5 μM mitomycin (MMC) and plated in a Culture-Insert (ibidi) at a density of 3 × 10⁴ cells per well. Once at full confluence, cells were starved with RPMI-1640 without FBS overnight. The insert was removed to create the gap. Cells were monitored immediately after the gap creation by using IncuCyte. Cell invasion assays were performed by using Trans-well chambers (ThinCerts TC Inserts, 8μm pores). A total of 1 × 10⁵ cells after viral transduction were suspended in 300 μL RPMI-1640 with no FBS but 0.2% BSA. The cells were added to the upper chamber which was pre-coated with 5% Matrigel containing RPMI-1640 without FBS. Complete RPMI-1640 medium (800 μL) were added to the bottom wells of the chambers. After 18 to 24 hours which depends on cell type, the chambers were taken out and fixed with 90% ethanol and stained with 0.1% crystal violet. The cells that had not invaded were removed from the upper surface of the membrane using cotton swabs. The invasive cells were counted in three randomly selected areas from each membrane by ImageJ.
Tumor xenograft
NSG mice were kind gift from Dr. Jenny Chang. Animal care and use conditions were followed in accordance with institutional and National Institutes of Health protocols and guidelines. All the studies were approved by Houston Methodist Institution Animal Care and Use Committee. Briefly, mice were anesthetized using 2% isoflurane (inhalation) and 6 × 10⁶ C4-2 prostate cancer cells mixed 1:1 with Matrigel were implanted subcutaneously into the dorsal flank on right sides of the male mice. The tumor volume was calculated as (length × width2)/2 every 3 days. Eight weeks after injection, mice were euthanized, and the primary tumors and lungs were harvested for histologic analysis and micrometastasis detection.
Chick chorioallantoic membrane (CAM) assay
A total of 2 × 10⁶ GFP labeled C4-2 control or CHD6 knockdown cells in 50% of matrigel were inoculated on the chick chorioallantoic membrane. The lower CAM membrane, chick lung and liver from each embryo were harvested 17 days post inoculation. Representative green fluorescent images showed the micrometastasis of GFP-labeled C4-2 cells in the lower CAM membrane. Genomic DNA from chick lung and liver were extracted for detecting human Alu gene by qPCR.
Gaussia luciferase reporter assay
Lentivirus expressing shScr or CHD6 shRNA were added to C4-2 control or E2F1 overexpression cells. 24 hours after infection, the E2F1 gaussian luciferase (GLuc) reporter was co-transfected with internal control Secreted Alkaline Phosphatase (SEAP) at a ratio of 1:10 into cells. Cells were lysed 48 hours later and conducted using the Secrete-Pair Gaussia Luciferase Assay Kit (LF031, GeneCopoeia). The gaussian luciferase activity was normalized with SEAP activity.
Chromatin immunoprecipitation (ChIP)
ChIP was performed using the EZ-Magna ChIP A/G Chromatin Immunoprecipitation Kit (Millipore, Cat. 17–10085) with the procedure provided by the manufacturer. DNA enrichment of target regions was assessed by qPCR using SYBR Green Master Mix Kit. Primers used for the target regions include:
RNA-Seq analysis
RNA-Seq raw reads were mapped to the human genome version hg19 using TopHat version 2.1.1 with default parameter values (65). Expression value (number of raw reads) for each gene was determined by the software HTSeq version 0.9.1 with default parameter values (65). Normalized (the TMM method) expression values and differentially expressed genes were determined by edgeR version 3.10.5 ran with an R version 3.2.1. The MeV version 4.8.1 was used to draw the heatmaps (66). We used the function genomeCoverageBed in BEDTools Version 2.16.2 (67), along with the nor2total function in DANPOS version 2.2.2 (68,69), and the tool bedGraphToBigWig (https://www.encodeproject.org/software/bedgraphtobigwig/) to generate a BigWig file that contains RNA-Seq signal (read density) at each base pair across the genome (70). The BigWig file was then submitted to the UCSC Genome Browser to visualize RNA-Seq signal at individual genes.
ChIP-Seq analysis
ChIP-Seq raw reads were mapped to the human genome version hg19 using Bowtie version 1.2.2 with default parameter values (65). We then submitted the mapped reads to the Dregion function in DANPOS version 2.2.2 (https://sites.google.com/site/danposdoc/) to calculate ChIP-Seq signal (read density) at each base pair of the genome (68,69), subtract background (input) signal, normalize read number, and define individual enrichment peaks. The Dregion stored the signal value at each base pair in a Wiggle format file, which we next converted to bigWig format using the tool WigToBigWig (https://www.encodeproject.org/software/wigtobigwig/). The bigWig files were submitted to the UCSC Genome Browser (https://genome.ucsc.edu) to visualize ChIP-Seq signal at each base pair (71,72). The Dregion also stored individual feature values for each enrichment peak of ChIP-Seq signal. These feature values include peak width, height, and total signal. To calculate signal value at each base pair across each gene, we used the Profile function in DANPOS version 2.2.2 (68,69). The Profile function in DANPOS 2.2.2 was also used to calculate average ChIP-Seq signal at each gene group (68,69).
Micrococcal nuclease (MNase) digestion
MNase digestion was performed as in Cui et al. (73). Briefly, 20 million cells were harvested and cross-linked by adding formaldehyde to 1% and incubating for 10 min at room temperature. After washing with PBS, cells were lysed in 1 × PBS with 0.5% Triton X-100 for 3 min on ice. Nuclei were pelleted at 500 g for 5 min at 4°C. Nuclei were then gently resuspended in MNase digestion buffer and the final Ca2+ concentration was adjusted to 1mM. Next, the nuclei suspension was aliquoted to 100 μL per tube and 2U of MNase was added. Nuclei were then incubated for 15 min (replicate 1) or 60 min (replicate 2) at 37°C. Reaction was terminated by adding stopping buffer with 0.5mg/mL Protease K, followed by incubation at 65°C for 6 hours or overnight. DNA was extracted using phenol:chloroform:isoamyl for high-throughput sequencing.
MNase-Seq analysis
MNase-Seq raw reads were mapped to the human genome version hg19 using Bowtie version 1.2.2 with default parameter values (65). We then submitted the mapped reads to the Dpos function (parameter: –smooth_width 0 -c 50000000 -u 1 –pheight 1e-200) in DANPOS version 2.2.2 (https://sites.google.com/site/danposdoc/) to calculate MNase-Seq signal (read density) at each base pair of the genome (68,69). The pipeline to observe MNase-Seq read density is the same as that described above for ChIP-Seq. The Profile function in DANPOS 2.2.2 was also used to calculate average MNase-Seq signal at each gene group (68,69).
Pathway Enrichment analysis
GO and KEGG pathway analyses were performed using the DAVID database version 6.8 (https://david.ncifcrf.gov). For GSEA analysis, we generated GCT file for each expression dataset and ranked all genes in the whole set of RefSeq reference genes by the Signal2Noise method.
Statistical analysis
For all experimental data, at least three independent biological replicates were performed at different times and the representative results were shown with the mean and its standard derivations. Comparisons of two groups were analyzed using unpaired two-tailed student's t-test. The difference was considered significant when P < 0.05 (*, P < 0.05; **, P < 0.01; ***, P < 0.001).
RESULTS
CHD6 is upregulated in prostate cancer and associated with poor prognosis
We initially analyzed the expression levels of all CHD family members (CHD1-CHD9) in both the TCGA and Taylor datasets of the prostate cancer (74,75). Only CHD6 was significantly (one tail Wilcoxon test P < 0.05) elevated in primary prostate tumors compared with control tissues, while the expression of CHD3, CHD4, and CHD9 was significantly reduced (Supplementary Figure S1A-S1B). The expression data of CHD5 was included in the TCGA database but not in the original Taylor database, which might be due to its relatively low gene expression level. We continued to analyze the Grasso dataset (76), and found the expression level of CHD6 further elevated in metastatic samples (Figure 1A), suggesting a strong association of CHD6 expression with prostate tumor progression. In addition, we analyzed the SU2C dataset (77), and found that CHD6 expression level was also positively correlated with tumor content in the prostate samples (Figure 1B). We further examined the correlation between CHD6 level and the clinicopathologic features of prostate cancer patients. Higher expression level of CHD6 was associated with elevated PSA level which was known to indicate poorer prognosis for prostate cancer patients (Figure 1C), as indicated by the analysis of TCGA data (74). Further, the prostate cancer patients with advanced pathological stage in the Taylor dataset (75) exhibited higher expression level of CHD6 (Figure 1D). Taken together, these findings suggested that the expression level of CHD6 is significantly increased in prostate cancer and is associated with prognosis in prostate cancer.
Figure 1.

Elevation of CHD6 expression promotes prostate cancer. (A) CHD6 RNA expression level in benign prostate tissues (BP, n = 28), localized prostate cancer (PC, n = 59) and metastatic prostate cancer (mPC, n = 35) in a public dataset (GEO accession number GSE35988). (B) Scatter plot showing the relationship between CHD6 RNA expression and tumor content in SU2C metastatic prostate cancer patients, with Spearman correlation coefficient (r) and P value indicated. (C) CHD6 RNA expression level in prostate cancer patients with high and low PSA level in the TCGA data. (n(low) = 181, n(high) = 46). (D) CHD6 RNA expression level in prostate cancer patients with high and low tumor stages in the Taylor dataset. (n(low) = 86, n(high) = 55). (E) Expression level of CHD6 mRNA determined by RT-qPCR (top panel) and protein determined by Western blot (bottom panel) in C4-2 cells under individual conditions. (F, G) Colony formation (F) and proliferation (G) of C4-2 cells under individual conditions. (H) Transwell invasion of C4-2 cells under individual conditions. Proliferation (I) and wound healing assay (J) of C4-2 cells under 0.5 μM mitomycin c (MMC) treatment. Percent of wound closure at individual time points was calculated relative to the time point at 0h. (K) Wound healing assay of BPH-1 cells under individual conditions. (L) Transwell invasion of BPH-1 cells under individual conditions. OE, overexpression; Vec, empty vector; sh, shRNA; shScr, scramble control for shRNA. P values determined by one tail Wilcoxon test (A, C, D) or two-tailed student's t-test based on technical replicates (different biological samples analyzed in parallel) (E-L); n = 3 (E-L) in the t tests; *, P < 0.05; **, P < 0.01; ***, P < 0.001; n.s., not significant. Scale bar: 100 μm.
CHD6 sustains the growth and aggressiveness of prostate cancer cells in vitro
To investigate the function of CHD6 in prostate cancer cells, we developed two CHD6 knockdown sublines by transfecting human prostate cancer cells C4-2 with two shRNAs targeting different regions of the CHD6 mRNA. RT-qPCR and western blot indicated lower levels of CHD6 mRNA and protein in these sublines (Figure 1E), respectively, confirming the efficiency of CHD6 knockdown. CHD6 depletion resulted in significantly fewer and smaller colonies in colony formation assay (Figure 1F). Knockdown of CHD6 also dramatically decreased the proliferation rate of C4-2 cells as determined by the total cell viability over a period of four days (Figure 1G). We further repeated the same experimental approaches in another human prostate cancer cell line PC-3 and observed consistent results (Supplementary Figures S1C-E), suggesting that CHD6 is required to sustain the rapid proliferation of prostate cancer cells.
As our bioinformatics analysis indicated that CHD6 expression is also associated with the metastasis of prostate cancer, we next assessed the role of CHD6 in modulating cell motility and invasiveness. CHD6 knockdown reduced the number of C4-2 cells invading through the Matrigel-coated transwell chamber (Boyden Chamber Invasion assay) (Figure 1H). To further investigate the role of CHD6 in the migration of prostate cancer cells, we performed the wound healing assay using both C4-2 and PC-3 cells. We treated the cells with 0.5μM mitomycin c (MMC) to ensure that wounds will be closed due to cell migration but not proliferation (Figure 1I, Supplementary Figure S1F). The result showed that knockdown of CHD6 in C4-2 cells led to slower wound closure (Figure 1J). In PC-3 cells, the wound was also closed more slowly in the CHD6 knockdown group compared with control group within 36 hours after the wound was created (Supplementary Figure S1G, H). Also, CHD6 knockdown resulted in dramatic decrease of invasive PC-3 in transwell assay (Supplementary Figure S1I, J). These results indicated that CHD6 expression is required to sustain the motility and invasion of prostate cancer cells in vitro.
To further investigate the role of CHD6 in oncogenic transformation, we overexpressed CHD6 in non-cancer prostatic hyperplasia epithelial cell line BPH-1. The overexpression of CHD6 in BPH-1 cells was confirmed by western blot (Supplementary Figure S1K). The result indicated that overexpression of CHD6 in BPH-1 cells resulted in faster wound closure (Figure 1K) and increased cell invasion (Figure 1L). Intriguingly, BPH-1 cells with overexpressed CHD6 showed a mild or non-detectable change in cell proliferation when compared to the control BPH-1 cells (Supplementary Figures S1L-N).
CHD6 is required for the growth and aggressiveness of prostate cancer in vivo
We next performed murine xenograft assay to examine the role of CHD6 in prostate cancer in vivo. Control C4-2 cells or CHD6 knockdown C4-2 cells stably expressing luciferase were implanted subcutaneously into the dorsal flank of 5-week-old male NSG mice. All eight mice developed tumors after injecting control cells, whereas only two of eight mice developed tumors, with remarkably smaller size, after injecting CHD6 knockdown cells (Figure 2A, B). The tumor growth curve indicated that the C4-2 knockdown cells formed detectable tumors 4 weeks later than the control cells (Figure 2C, D). A consistent result was observed in tumor weight analysis (Figure 2E). We further found that the human tumor cell content, as indicated by abundance of human genomic DNA sequence analyzed at the HPRT gene locus, was significantly lower in the lungs of mice injected with CHD6 knockdown cells when compared to those injected with control cells (Figure 2F). This result suggested that lung metastases of C4-2 were impaired by CHD6 knockdown. Histological analysis showed that while more than half of the control tumors invaded the adjacent muscle tissues, tumors derived from CHD6 knockdown cells were well encapsulated with no sign of invasion (Figure 2G).
Figure 2.

CHD6 ablation impairs growth and metastasis of tumors derived from prostate cancer cells in mouse xenograft model. (A, B) Tumors formed by C4-2 control and CHD6 knockdown cells. (C-E) Volume (C), luminescent intensity (D), and weight (E) of tumors derived from C4-2 control and CHD6 knockdown cells. (F) Human genomic DNA content determined by qPCR at the HPRT gene locus in lungs of mice bearing C4-2 control and CHD6 knockdown cells. (G) Hematoxylin and eosin staining of tumors derived from C4-2 cells. Red arrows, areas of muscle invasion. Quantification was shown in table. (H) Representative images of C4-2-GFP control and CHD6 knockdown cells in lower CAM membrane. Green fluorescent dots: GFP labeled C4-2 cells, black: blood vessels. (I, J) qPCR quantification of human genomic DNA content at the Alu gene locus in chicken lungs (I) and livers (J) from CAM tumor models. sh, shRNA; shScr, scramble control of shRNA; P value determined by two tails student's t test. N = 8 for mice experiments (A-C). N = 5, N = 5, and N = 6 for the control, sh2, and sh1 embryos (H-J), with three technical replicates for each embryo. *, P < 0.05; **, P < 0.01; ***, P < 0.001; n.s., not significant. Scale bar: 100 μm.
To further investigate the role of CHD6 in metastases of prostate cancer, we performed Chick chorioallantoic membrane (CAM) assay. We observed that knockdown of CHD6 dramatically attenuated the migration of C4-2-GFP-luciferase cells to the lower CAM membrane (Figure 2H). The lungs and livers of the developing chick were harvested 17 days post-inoculation. The metastatic C4-2 cells in chicken lungs and livers were quantified by qPCR for amplification of human Alu genomic DNA. Human Alu genomic DNA was undetectable in the lungs and livers of CHD6 knockdown groups but detectable in those of the control group (Figure 2I-J), suggesting that knockdown of CHD6 impaired the ability of distal organ migration of C4-2 cells in CAM model. Taken together, these results from mouse and CAM models suggested that CHD6 plays an essential role in tumor growth and metastasis of prostate cancer cells in vivo.
Expression of the genes activated by CHD6 are associated with poor clinical outcome
To explore the transcriptional program regulated by CHD6, we performed RNA-Seq for C4-2 cells with two different CHD6 shRNAs and a shScramble as the control. We observed a widespread alteration of gene expression in response to the knockdown, with 904 genes downregulated and 740 genes upregulated (FDR < 0.01) (Figure 3A). Hereafter, the downregulated genes and upregulated genes upon CHD6 knockdown were referred to as CHD6-activated and -repressed genes, respectively. There were more CHD6-activated genes than CHD6-repressed genes. This trend became more obvious when we defined differential genes using more stringent cutoffs, with activated genes 2 folds more than repressed genes (146 versus 62) when defined by an FDR cutoff 1 × 10⁻⁹ (Figure 3B). KEGG pathway enrichment analysis revealed that CHD6-activated genes were associated with cancer pathways as well as Cell cycle, DNA replication, and DNA repair pathways, whereas the CHD6-repressed genes were enriched in pathways such as lysosome and human cytomegalovirus infection pathways (Figure 3C). To better capture the clinical importance of CHD6-activated genes, we defined a CHD6 activation signature as the top 100 CHD6-activated genes ranked by FDR from the most to the least significant. TCGA prostate cancer patients with higher expression level of CHD6 activation signature exhibited worse disease-free survival as well as worse overall survival (Figure 3D and Supplementary Figure S2A). Prostate cancer patients with an advanced pathological state (Figure 3E), higher PSA levels (Figure 3F), or greater Gleason score (Supplementary Figure S2B) showed elevated expression level of CHD6 activation signature. Similar correlation between the high expression level of CHD6 activation signature and poor prognosis was observed in the Taylor dataset (75) (Supplementary Figures S2C-E). Intriguingly, Gene Ontology analysis indicated that CHD6-activated genes were associated with cancer-related pathways such as DNA replication, cell cycle, DNA repair pathways, cell proliferation, cell metastasis and cell migration (Figure 3G and Supplementary Figure S2F-H). Moreover, the analysis showed that CHD6-activated genes were involved in processes of transcriptional regulation, e.g. positive regulation of transcription from RNA polymerase II promoter (GO:0045944) (Figure 3G).
Figure 3.

Expression of the genes activated by CHD6 is associated with poor outcome of prostate cancer patients. (A) Heatmap to show expression level of genes down- or up-regulated by CHD6 knockdown in C4-2 cells. (B) Number of genes activated or repressed by CHD6 when defined with individual FDR cutoffs in C4-2 cells. (C) KEGG pathway analysis of genes activated or repressed by CHD6 in C4-2 cells. (D) Kaplan-Meier plot of disease-free survival rate in prostate cancer patients with high or low RNA expression of CHD6 activation signature genes in the TCGA data. (E) RNA expression level of CHD6 activation signature genes at different tumor stages in the TCGA data. (n(low) = 186, n(middle) = 293, n(high) = 10). (F) RNA expression level of CHD6 activation signature genes in patients with low and high PSA level in the TCGA data. (n(low) = 181, n(high) = 46). (G) Gene ontology analysis of genes activated by CHD6. P values determined by one tail Wilcoxon test (E, F). sh, shRNA; shScr, scramble control of shRNA. *, P < 0.05; **, P < 0.01; ***, P < 0.001; n.s., not significant. The results were generated based on integration of three independent biological replicates.
The oncogene E2F1 is transcriptionally regulated by CHD6 in prostate cancer
Motivated by the enrichment of CHD6-activated genes in Gene Ontology terms related to transcriptional regulation, we continued to analyze the expression patterns of the 1,639 known transcription factors in the human genome (78). Gene set enrichment analysis (GSEA) suggested that these transcription factors were significantly enriched in CHD6-activated genes (Figure 4A). Moreover, the 70 transcription factors significantly (FDR < 0.001) activated by CHD6 were enriched in KEGG pathways regulating multiple types of cancers, including the prostate cancer pathway (Figure 4B). In contrast, we did not observe any cancer pathway enriched in CHD6 repressed transcription factors (Supplementary Figure S2I). These results suggested that CHD6 may play an important role in modulating transcriptional program in prostate cancer cells.
Figure 4.

Many oncogenic transcription factors are downstream targets of CHD6. (A) GSEA analysis showing enrichment of 1,639 transcription factors in genes regulated by CHD6 in C4-2 cells. (B) KEGG pathway analysis of 70 transcription factors activated by CHD6 in C4-2 cells. (C) Volcano plot to show expression change of transcription factors upon knockdown of CHD6 in C4-2 cells. (D, E) Genome browser track to show RNA-Seq data at the CHD6 (D) and E2F1 (E) loci in individual samples. (F) Protein levels of CHD6 and E2F1 in C4-2 cells under individual conditions. (G) GSEA analysis showing enrichment of the E2F1-activated and -repressed genes in genes regulated by CHD6 in C4-2 cells. (H) Proliferation of C4-2 cells under individual conditions. (I) Transwell invasion assay of C4-2 cells under individual conditions. TF, transcription factor; sh, shRNA; shScr, scramble control of shRNA. Two tails student's t test P value were shown (H and I); n = 3 technical replicates (different samples analyzed in parallel); *, P < 0.05; **, P < 0.01; ***, P < 0.001; n.s., not significant.
E2F1 is known to play a critical role in prostate tumorigenesis and is among the top-ranked transcription factors activated by CHD6 (Figure 4C). RNA-Seq analysis showed that E2F1 knockdown did not affect CHD6 expression, while CHD6 knockdown resulted in a remarkable decrease of E2F1 expression (Figure 4D, E). This pattern of RNA expression change was verified by RT-qPCR (Supplementary Figure S3A). Consistent with the RNA expression change, CHD6 knockdown decreased E2F1 protein level, while E2F1 knockdown did not alter the CHD6 protein level (Figure 4F), suggesting that E2F1 is a downstream target of CHD6. Intriguingly, CHD6-activated genes were enriched with E2F1-activated genes, and CHD6-repressed genes were enriched with E2F1-repressed genes (Figure 4G and Supplementary Figure S3B). Moreover, the CHD6 activation signature was enriched with E2F1-activated genes (Supplementary Figure S3C). Therefore, CHD6 and E2F1 shared common downstream targets and may regulate prostatic oncogenesis through some common pathways. Further, knockdown of CHD6 significantly decreased the growth of C4-2 cells, whereas E2F1 overexpression partially rescued the growth inhibition by CHD6 inhibition (Figure 4H). Similarly, restoration of E2F1 expression in CHD6 knockdown cells rescued the decrease of the number of invaded cells in transwell assay (Figure 4I). Further, E2F1 reporter activity was significantly downregulated upon knockdown of CHD6, whereas overexpression of E2F1 in CHD6 knockdown cells restored the activity of E2F1 reporter (Supplementary Figure S3D and E). Taken together, the results above demonstrated that the tumor-promotion effects of CHD6 is dependent on E2F1.
The tumor suppressor RB1 binds to the E2F1 protein to inhibit the role of E2F1 in activation of transcription at target genes (56). Loss of RB1 releases the oncogenic function of E2F1 and is frequently observed in metastatic prostate cancer (79,80). Because our results demonstrated that CHD6 expression is required for the expression of E2F1, we hypothesized that the oncogenic effect of RB1 loss would be dependent upon CHD6 expression. We first verified that RB1 knockdown led to significant increase of cell proliferation, whereas knockdown of CHD6 in these cells dramatically inhibited the cell proliferation (Supplementary Figures S3F and G). Knockdown of RB1 also caused a modest increase of cell invasion in transwell assay, whereas the cells with knockdown of both CHD6 and RB1 were scarcely observed in the membrane coated with Matrigel (Supplementary Figure S3H). Furthermore, whereas knockdown of RB1 increased cell migration, further knocking down CHD6 reversed this effect (Supplementary Figure S3I). Thus, CHD6 depletion impaired the oncogenic effect of RB1 loss in prostate cancer cells. These results indicated that CHD6 might be a potential therapeutic target in RB1-defficient prostate cancer patients.
Binding of CHD6 on chromatin is associated with transcriptional activation of cancer pathways
Because CHD6 is a member of the CHD family, we performed ChIP-Seq for CHD6 to analyze its binding sites across the human genome. We observed broad enrichment of CHD6 ChIP-Seq reads density at CHD6-activated genes from the upstream to the downstream regions in wild type C4-2 cells when compared to random control genes (Figure 5A). In contrast, CHD6-repressed genes exhibited slightly lower CHD6 ChIP-Seq reads density when compared to random control genes (Figure 5A). For instance, the CHD6-activated gene E2F1 displayed enrichment of CHD6 ChIP-Seq reads around transcription start site and transcription termination site when compared to the reads from input sample (Figure 5B, top panel), while little enrichment of CHD6 ChIP-Seq reads was observed on the gene body of SGK1, which is a CHD6-repressed gene (Figure 5B, bottom panel). To verify the ChIP-Seq results, we performed ChIP-qPCR in shScr and CHD6 knockdown cells. Two pairs of primers targeting different enrichment peaks of CHD6 ChIP-Seq reads on E2F1 gene body were designed (Figure 5B). A region on E2F1 gene body without CHD6 ChIP-Seq enrichment peak was chosen as one negative control site. One pair of primers targeting the promoter of CHD6 repressed gene SGK1, which showed no CHD6 ChIP-Seq enrichment peaks, was designed as another negative control site (Figure 5C). In C4-2 shScr cells, ChIP-qPCR signals for CHD6 were enriched at the two sites located in the ChIP-Seq enrichment peaks, whereas no enrichment of ChIP-qPCR signal was observed at the two negative control sites. Further, CHD6 knockdown remarkably abolished the enrichment of ChIP-qPCR signals for CHD6 at the ChIP-Seq enrichment peaks (Figure 5C). GSEA analysis also demonstrated that CHD6-activated genes were enriched in the genes with high coverage of CHD6 ChIP-Seq reads (Figure 5D left panel), whereas CHD6-repressed genes did not show significant enrichment (Figure 5D right panel). KEGG pathway analysis showed that the genes with high coverage of CHD6 ChIP-Seq reads were enriched in multiple cancer pathways (Supplementary Figure S4A). In contrast, the genes with low coverage of CHD6 ChIP-Seq reads did not show enrichment in cancer pathways (Supplementary Figure S4B). Together, these results indicated that the binding intensity of CHD6 at gene loci correlates positively with the transcriptional activation of the genes in many cancer pathways.
Figure 5.
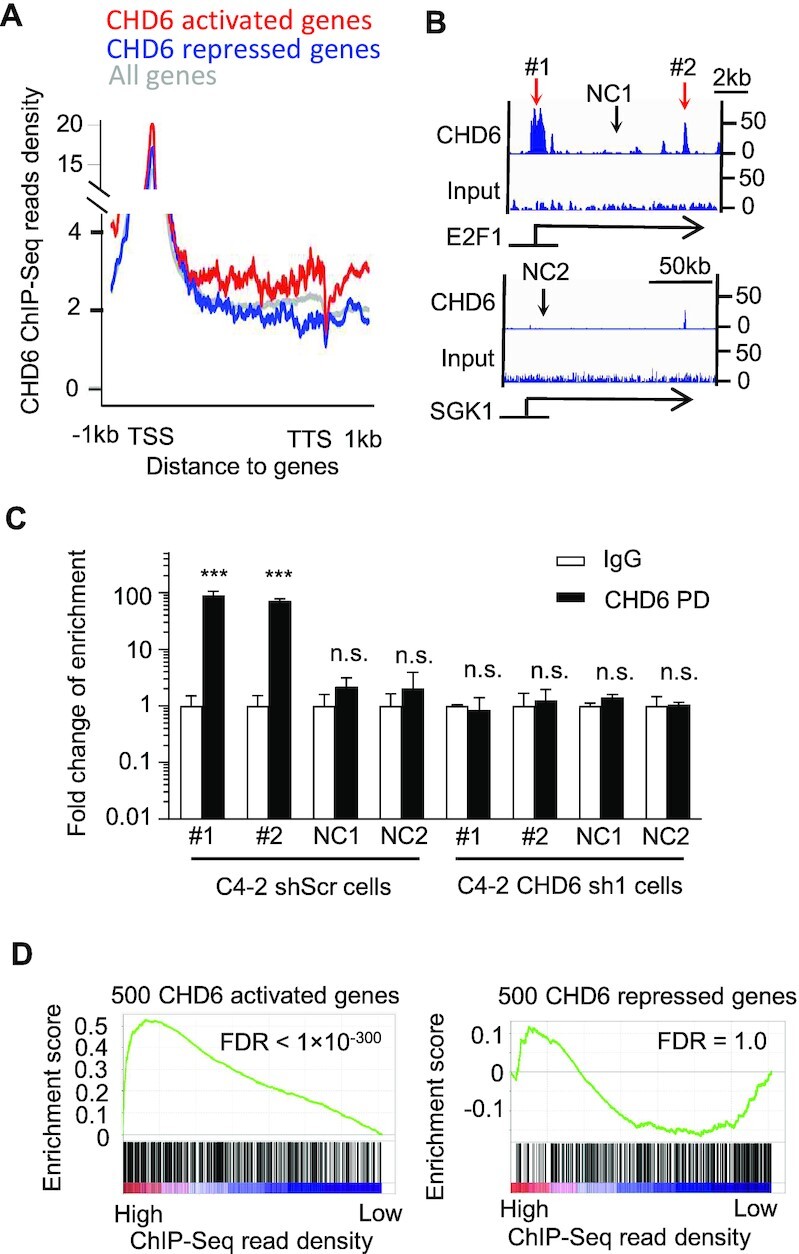
Binding of CHD6 protein on chromatin is linked to transcriptional activation of the target genes in C4-2 cells. (A) CHD6 ChIP-Seq read density on gene body and flanking regions of individual gene groups in C4-2 cells. (B) Genome browser tracks showing CHD6 ChIP-Seq read density at example genes in C4-2 cells. (C) ChIP-qPCR to verify CHD6 ChIP-Seq enrichment sites in C4-2 control and CHD6 knockdown cells. (D) GSEA analysis to show enrichment of CHD6-activated or -repressed genes as a function of CHD6 ChIP-Seq read density on gene body. NC, negative control. P value determined by two tails student's t-test (C) and KS test (D); n = 3 (C); *, P < 0.05; **, P < 0.01; ***, P < 0.001; n.s., not significant. The results were generated based on integration of three independent biological replicates.
Binding of CHD6 on chromatin is required to evict nucleosome for active transcription
Given that CHD6 is an ATPase dependent nucleosome remodeler, we reasoned that CHD6 ablation might alter the occupancy of nucleosome at CHD6 binding sites. To map nucleosome occupancy on chromatin, we performed micrococcal nuclease digestion followed by high-throughput sequencing (MNase-Seq) in both C4-2 control cells and CHD6 knockdown cells. Nucleosome positions defined by enrichment peaks of MNase-Seq reads showed depletion of CHD6 binding events, as indicated by depletion of ChIP-Seq reads (Figure 6A). Moreover, the occupancy of nucleosomes at CHD6 binding sites was increased in response to CHD6 knockdown (Figure 6B). These results indicated that the binding of CHD6 correlated with nucleosome eviction. In line with the results observed in whole genome analysis, the overall nucleosome occupancy across the promoter and gene body of E2F1 was increased significantly upon CHD6 knockdown in C4-2 cells (Figure 6C), while no significant change was observed across the SGK1 gene locus (Figure 6D). This phenomenon was clearly observed by visual inspection at individual binding sites of CHD6 (Figure 6E). KEGG and GO pathways analysis demonstrated that the genes with binding of CHD6 and increased MNase peak upon CHD6 knockdown were enriched in cancer pathways and cancer-related pathways such as cell migration, cell proliferation, and Wnt signaling pathways (Figure 6F-G). In addition, GSEA analysis showed that the genes activated by CHD6 (Figure 6H upper panel) were enriched in the genes showing increased nucleosome occupancy upon CHD6 knockdown. In contrast, the genes repressed by CHD6 did not show significant enrichment in genes showing increase or decrease of nucleosome occupancy upon CHD6 knockdown in C4-2 cells (Figure 6H lower panel). These observations were reproducible when we performed MNase-Seq experiment with different MNase digestion times, i.e. 15 minutes for one experiment (Figure 6) and 60 minutes for the other experiment (Supplementary Figure S5). Together, these results indicated that the binding of CHD6 facilitates the transcription of target genes and is associated with nucleosome eviction at these loci.
Figure 6.

Binding of CHD6 protein on chromatin is linked to nucleosome eviction at active genes in C4-2 cells. (A) Average MNase-seq and CHD6 ChIP-Seq read density plotted around MNase-Seq enrichment peaks in C4-2 control cells. (B) Average MNase-Seq read density in C4-2 control cells and CHD6 knockdown cells around CHD6 ChIP-Seq enrichment peaks defined in control cells. (C, D) MNase-seq read density plotted around E2F1 gene body (C) and SGK1 gene body (D) in C4-2 control cells and CHD6 knockdown cells. A boxplot was added to the top right corner to further show difference in MNase-Seq Read density. (E) Genome browser tracks to show MNase-Seq, CHD6 ChIP-seq and input read density in individual genomic regions. (F, G) KEGG (F) and GO (G) pathway analysis of the genes with binding of CHD6 and increased MNase peak upon CHD6 knockdown. (H) GSEA analysis to show the enrichment of CHD6-activated genes (upper panel) or CHD6-repressed genes (lower panel) in genes that display an increase or decrease of MNase-Seq signal. MNase-Seq analyses were based on integration of three independent biological replicates, in which the chromatins were digested with MNase for 15 minutes (MNase-Seq analysis based on 60 minutes digestion is in Supplementary Figure S5). P value was determined by one tail KS test (D, F).
DISCUSSION
The progression of most tumors is typically orchestrated by a widespread reprogramming of transcription in the genome. A key to the functional annotation of human genome is to understand the regulation of transcription (81–83), of which the epigenetic activity of chromatin is of fundamental importance (84–86). Dysregulation of RNA expression can be prognostic markers and therapy targets (87). Recent studies suggested that compared with non-malignant cells, cancer cells have a more active transcriptome to provide materials and bioenergy for aberrant cellular processes (88). Moreover, it was reported that a more accessible chromatin structure is associated with prostate cancer oncogenesis and progression (89). Here, we demonstrated that the chromatin remodeler CHD6 regulated the transcription of one to two thousand genes, which accounts for about 10% of all known protein-coding genes in the human genome. Such widespread transcriptional reprogramming is associated with the binding of CHD6 on specific genomic locus. Interestingly, we failed to identify a conservative motif for CHD6 binding (data not shown), which suggested complicated mechanism awaiting future investigations for CHD6 binding to DNA. CHD6 was reported to bind the promoter region of active genes in mouse embryonic stem cells, whereas depletion of CHD6 was associated with up regulation of bivalent genes (43). Our results in prostate cancer cell further revealed that the binding of CHD6 was enriched in both the promoter region and gene body. Furthermore, we found that the binding of CHD6 at gene loci correlates positively with the transcriptional activation of genes in many cancer pathways, whereas the genes activated by depletion of CHD6 showed a low binding intensity of CHD6. CHD6 binding correlated with the depletion of nucleosomes from those genes. The nucleosome occupancy is negatively associated with the accessibility of chromatin. A more accessible chromatin is known to facilitate the entry of transcriptional machinery. Therefore, it is reasonable to speculate that CHD6 maintains an accessible chromatin structure for the transcriptional activation of target genes.
Chromatin remodelers tend to each be a multi-subunits protein complex which regulates nucleosome positioning and remodels chromatin, thereby regulating transcription of target genes. To date, three ATPase-dependent remodeling complexes, including SWI/SNF, NuRD and CHRAC, have been reported to play important roles in cancer progression (16,90–92). For example, CHD4 was identified to be the core component of the NuRD complex, which cooperates with other transcriptional factors like DNMTs or ZEB1 to maintain the silencing of key tumor suppressors in cancers (18,93). It is of great importance to test in the future if CHD6 may also act with components of the NuRD complex to silence target genes. Meanwhile, a significant number of genes were upregulated upon CHD6 knockdown but showed a low level of CHD6 binding in the wild type cell, suggesting an indirect role of CHD6 in the regulation of these genes. In contrast, our data revealed that CHD6 can activate multiple transcription factors related to prostate cancer pathways. E2F1 and E2F2 are both among the top ranked transcription factors activated by CHD6, and are known to have overlapped function in prostate cancer. Intriguingly, E2F1 and E2F2 are known to bind their own promoter regions and regulate the expression of themselves (94). Further, a large number of genes were transcriptionally activated with the binding of CHD6 proteins, suggesting that CHD6 might form a complex distinct from NuRD complex for transcriptional activation. Ana Sancho et al. demonstrated that CHD6 cooperates with CTCF and recruits other transcription factors to form a long range chromatin loop in the CFTR locus (42). It is questionable if this mechanism could be generalized to the transcriptional activation of other CHD6-activated genes. An exploration of the BioGRID database suggested that CHD6 might interact with EZH2 to modulate their downstream signaling (data not shown). However, our co-immunoprecipitation result failed to confirm a physical interaction between CHD6 and EZH2 proteins (data not shown). A comprehensive analysis of the interactome of CHD6 in different contexts can be a key to further understanding the role of CHD6 in cancer progression.
We demonstrated that the expression of CHD6 is upregulated in prostate cancer samples and required for the rapid growth and motility of prostate cancer cells. The mechanism responsible for the elevation of CHD6 expression in prostate cancer cells remains to be determined. Androgen receptor plays a key role in prostate cancer (95). The expression level of CHD6 positively correlated with AR expression in prostate cancer samples and knockdown of CHD6 failed to affect the expression level of AR (data not shown), which suggests that AR might upregulate CHD6 in prostate cancer. These observations provide a potential explanation for increased CHD6 activity in prostate cancer. We also found that the gene expression level of CHD3, CHD4, and CHD9 was significantly reduced in primary prostate tumors compared with control tissues. Although those three CHD family members have several reported roles in other cancer types, it will be interesting to further investigate their downregulation in prostate cancer and the underlying mechanism in future. Emerging evidence showed that malfunction of chromatin remodeling factors contributes to drug resistance. Zeda Zhang et al. reported that loss of CHD1 in CRPC caused the dysregulation of chromatin structure, resulting in elevated expression of transcription factors that contribute to anti-androgen drug resistance (14). In contrast to CHD1, our preliminary data showed that CHD6 was further upregulated in CRPC, indicating a distinct role of CHD6 in the development of CRPC and emergence of resistance to anti-androgen therapy.
DATA AVAILABILITY
The next-generation sequencing datasets have been deposited to the Gene Expression Omnibus (GEO: https://www.ncbi.nlm.nih.gov/geo/) with the accession number GSE214212.
Supplementary Material
ACKNOWLEDGEMENTS
Author contributions: K.C., L.Z., and Q.C. conceived the project. K.C., D.Z., and S.H. designed bioinformatics analysis and interpreted the data. K.C., L.Z., Q.C. and M.Z. designed the experiments and interpreted the data. M.Z., Q.L.,W.J. and S.Z. performed the experiments and analyzed the data. K.C., L.Z., M.Z. and D.Z. wrote the manuscript with input from Q.C., S.H. and Y.L. and comments from D.K.
Contributor Information
Dongyu Zhao, Department of Biomedical Informatics, MOE Key Lab of Cardiovascular Sciences, School of Basic Medical Sciences, Peking University Health Science Center, Beijing, 100191, China; Prostate Cancer Program, Dana-Farber and Harvard Cancer Center, Harvard University, Boston, MA 02115, USA; Basic and Translational Research Division, Department of Cardiology, Boston Children's Hospital, Boston, MA 02115, USA; Department of Cardiovascular Sciences, Houston Methodist Research Institute, Houston, TX 77030, USA; Department of Pediatrics, Harvard Medical School, Boston, MA 02115, USA.
Min Zhang, Department of Cardiovascular Sciences, Houston Methodist Research Institute, Houston, TX 77030, USA.
Shaodong Huang, Department of Biomedical Informatics, MOE Key Lab of Cardiovascular Sciences, School of Basic Medical Sciences, Peking University Health Science Center, Beijing, 100191, China.
Qi Liu, Department of Urology, and Robert H. Lurie Comprehensive Cancer Center, Feinberg School of Medicine, Northwestern University, Chicago, IL 60611, USA.
Sen Zhu, Department of Cardiovascular Sciences, Houston Methodist Research Institute, Houston, TX 77030, USA.
Yanqiang Li, Prostate Cancer Program, Dana-Farber and Harvard Cancer Center, Harvard University, Boston, MA 02115, USA; Basic and Translational Research Division, Department of Cardiology, Boston Children's Hospital, Boston, MA 02115, USA; Department of Cardiovascular Sciences, Houston Methodist Research Institute, Houston, TX 77030, USA; Department of Pediatrics, Harvard Medical School, Boston, MA 02115, USA.
Weihua Jiang, Center for Inflammation and Epigenetics, Houston Methodist Research Institute, Houston, TX 77030, USA.
Daniel L Kiss, Department of Cardiovascular Sciences, Houston Methodist Research Institute, Houston, TX 77030, USA.
Qi Cao, Center for Inflammation and Epigenetics, Houston Methodist Research Institute, Houston, TX 77030, USA; Department of Urology, and Robert H. Lurie Comprehensive Cancer Center, Feinberg School of Medicine, Northwestern University, Chicago, IL 60611, USA.
Lili Zhang, Basic and Translational Research Division, Department of Cardiology, Boston Children's Hospital, Boston, MA 02115, USA; Department of Cardiovascular Sciences, Houston Methodist Research Institute, Houston, TX 77030, USA; Department of Pediatrics, Harvard Medical School, Boston, MA 02115, USA.
Kaifu Chen, Prostate Cancer Program, Dana-Farber and Harvard Cancer Center, Harvard University, Boston, MA 02115, USA; Basic and Translational Research Division, Department of Cardiology, Boston Children's Hospital, Boston, MA 02115, USA; Department of Cardiovascular Sciences, Houston Methodist Research Institute, Houston, TX 77030, USA; Department of Pediatrics, Harvard Medical School, Boston, MA 02115, USA.
SUPPLEMENTARY DATA
Supplementary Data are available at NAR Online.
FUNDING
NIH [R01GM125632 to K.C., R01GM138407 to K.C., R01HL133254 to K.C., R01HL148338 to K.C., R01CA208257 to Q.C., R01CA256741 to Q.C., in part]; U.S. Department of Defense [W81XWH-17-1-0357 to Q.C., W81XWH-19-1-0563 to Q.C., W81XWH-20-1-0504 to Q.C.]; Prostate SPOREP50CA180995 Development Research Program (to Q.C.); Polsky Urologic Cancer Institute of the Robert H. Lurie Comprehensive Cancer Center of Northwestern University at Northwestern Memorial Hospital (to Q.C.) [R01HL155632 to L.Z., R35GM137819 to D.L.K.]. Funding for open access charge: startup funds.
Conflict of interest statement. The authors have no competing financial interests that might influence the performance or presentation of the work described in this manuscript.
REFERENCES
- 1. Shen H., Laird P.W.. Interplay between the cancer genome and epigenome. Cell. 2013; 153:38–55. [DOI] [PMC free article] [PubMed] [Google Scholar]
- 2. Houlahan K.E., Shiah Y.J., Gusev A., Yuan J., Ahmed M., Shetty A., Ramanand S.G., Yao C.Q., Bell C., O’Connor E.et al.. Genome-wide germline correlates of the epigenetic landscape of prostate cancer. Nat. Med. 2019; 25:1615–1626. [DOI] [PMC free article] [PubMed] [Google Scholar]
- 3. Ramanand S.G., Chen Y., Yuan J., Daescu K., Lambros M.B., Houlahan K.E., Carreira S., Yuan W., Baek G., Sharp A.et al.. The landscape of RNA polymerase II-associated chromatin interactions in prostate cancer. J. Clin. Invest. 2020; 130:3987–4005. [DOI] [PMC free article] [PubMed] [Google Scholar]
- 4. Natesan R., Aras S., Effron S.S., Asangani I.A.. Epigenetic regulation of chromatin in prostate cancer. Adv. Exp. Med. Biol. 2019; 1210:379–407. [DOI] [PubMed] [Google Scholar]
- 5. Feinberg A.P., Koldobskiy M.A., Gondor A.. Epigenetic modulators, modifiers and mediators in cancer aetiology and progression. Nat. Rev. Genet. 2016; 17:284–299. [DOI] [PMC free article] [PubMed] [Google Scholar]
- 6. Stelloo S., Nevedomskaya E., Kim Y., Schuurman K., Valle-Encinas E., Lobo J., Krijgsman O., Peeper D.S., Chang S.L., Feng F.Y.et al.. Integrative epigenetic taxonomy of primary prostate cancer. Nat. Commun. 2018; 9:4900. [DOI] [PMC free article] [PubMed] [Google Scholar]
- 7. Wilson B.G., Roberts C.W.. SWI/SNF nucleosome remodellers and cancer. Nat. Rev. Cancer. 2011; 11:481–492. [DOI] [PubMed] [Google Scholar]
- 8. Hargreaves D.C., Crabtree G.R.. ATP-dependent chromatin remodeling: genetics, genomics and mechanisms. Cell Res. 2011; 21:396–420. [DOI] [PMC free article] [PubMed] [Google Scholar]
- 9. Moore S., Berger N.D., Luijsterburg M.S., Piett C.G., Stanley F.K.T., Schrader C.U., Fang S., Chan J.A., Schriemer D.C., Nagel Z.D.et al.. The CHD6 chromatin remodeler is an oxidative DNA damage response factor. Nat. Commun. 2019; 10:241. [DOI] [PMC free article] [PubMed] [Google Scholar]
- 10. Ho L., Crabtree G.R.. Chromatin remodelling during development. Nature. 2010; 463:474–484. [DOI] [PMC free article] [PubMed] [Google Scholar]
- 11. Ding Y., Li N., Dong B., Guo W., Wei H., Chen Q., Yuan H., Han Y., Chang H., Kan S.et al.. Chromatin remodeling ATPase BRG1 and PTEN are synthetic lethal in prostate cancer. J. Clin. Invest. 2019; 129:759–773. [DOI] [PMC free article] [PubMed] [Google Scholar]
- 12. Papamichos-Chronakis M., Peterson C.L.. Chromatin and the genome integrity network. Nat. Rev. Genet. 2013; 14:62–75. [DOI] [PMC free article] [PubMed] [Google Scholar]
- 13. Cairns B.R. Emerging roles for chromatin remodeling in cancer biology. Trends Cell Biol. 2001; 11:S15–S21. [DOI] [PubMed] [Google Scholar]
- 14. Zhang Z., Zhou C., Li X., Barnes S.D., Deng S., Hoover E., Chen C.C., Lee Y.S., Zhang Y., Wang C.et al.. Loss of CHD1 promotes heterogeneous mechanisms of resistance to AR-Targeted therapy via chromatin dysregulation. Cancer Cell. 2020; 37:584–598. [DOI] [PMC free article] [PubMed] [Google Scholar]
- 15. Augello M.A., Liu D., Deonarine L.D., Robinson B.D., Huang D., Stelloo S., Blattner M., Doane A.S., Wong E.W.P., Chen Y.et al.. CHD1 loss alters AR binding at lineage-specific enhancers and modulates distinct transcriptional programs to drive prostate tumorigenesis. Cancer Cell. 2019; 35:603–617. [DOI] [PMC free article] [PubMed] [Google Scholar]
- 16. Cai Y., Geutjes E.J., de Lint K., Roepman P., Bruurs L., Yu L.R., Wang W., van Blijswijk J., Mohammad H., de Rink I.et al.. The NuRD complex cooperates with DNMTs to maintain silencing of key colorectal tumor suppressor genes. Oncogene. 2014; 33:2157–2168. [DOI] [PMC free article] [PubMed] [Google Scholar]
- 17. Sandoval G.J., Pulice J.L., Pakula H., Schenone M., Takeda D.Y., Pop M., Boulay G., Williamson K.E., McBride M.J., Pan J.et al.. Binding of TMPRSS2-ERG to BAF chromatin remodeling complexes mediates prostate oncogenesis. Mol. Cell. 2018; 71:554–566. [DOI] [PMC free article] [PubMed] [Google Scholar]
- 18. Manshouri R., Coyaud E., Kundu S.T., Peng D.H., Stratton S.A., Alton K., Bajaj R., Fradette J.J., Minelli R., Peoples M.D.et al.. ZEB1/NuRD complex suppresses TBC1D2b to stimulate E-cadherin internalization and promote metastasis in lung cancer. Nat. Commun. 2019; 10:5125. [DOI] [PMC free article] [PubMed] [Google Scholar]
- 19. Mashtalir N., D’Avino A.R., Michel B.C., Luo J., Pan J., Otto J.E., Zullow H.J., McKenzie Z.M., Kubiak R.L., St Pierre R.et al.. Modular organization and assembly of SWI/SNF family chromatin remodeling complexes. Cell. 2018; 175:1272–1288. [DOI] [PMC free article] [PubMed] [Google Scholar]
- 20. Peterson C.L., Workman J.L.. Promoter targeting and chromatin remodeling by the SWI/SNF complex. Curr. Opin. Genet. Dev. 2000; 10:187–192. [DOI] [PubMed] [Google Scholar]
- 21. Dann G.P., Liszczak G.P., Bagert J.D., Muller M.M., Nguyen U.T.T., Wojcik F., Brown Z.Z., Bos J., Panchenko T., Pihl R.et al.. ISWI chromatin remodellers sense nucleosome modifications to determine substrate preference. Nature. 2017; 548:607–611. [DOI] [PMC free article] [PubMed] [Google Scholar]
- 22. Aramayo R.J., Willhoft O., Ayala R., Bythell-Douglas R., Wigley D.B., Zhang X.. Cryo-EM structures of the human INO80 chromatin-remodeling complex. Nat. Struct. Mol. Biol. 2018; 25:37–44. [DOI] [PMC free article] [PubMed] [Google Scholar]
- 23. Manning B.J., Yusufzai T.. The ATP-dependent chromatin remodeling enzymes CHD6, CHD7, and CHD8 exhibit distinct nucleosome binding and remodeling activities. J. Biol. Chem. 2017; 292:11927–11936. [DOI] [PMC free article] [PubMed] [Google Scholar]
- 24. Marfella C.G., Imbalzano A.N.. The chd family of chromatin remodelers. Mutat. Res. 2007; 618:30–40. [DOI] [PMC free article] [PubMed] [Google Scholar]
- 25. Zahir F.R., Tucker T., Mayo S., Brown C.J., Lim E.L., Taylor J., Marra M.A., Hamdan F.F., Michaud J.L., Friedman J.M.. Intragenic CNVs for epigenetic regulatory genes in intellectual disability: survey identifies pathogenic and benign single exon changes. Am. J. Med. Genet. A. 2016; 170:2916–2926. [DOI] [PubMed] [Google Scholar]
- 26. Yamada K., Fukushi D., Ono T., Kondo Y., Kimura R., Nomura N., Kosaki K.J., Yamada Y., Mizuno S., Wakamatsu N.. Characterization of a de novo balanced t(4;20)(q33;q12) translocation in a patient with mental retardation. Am. J. Med. Genet. A. 2010; 152A:3057–3067. [DOI] [PubMed] [Google Scholar]
- 27. Kalscheuer V.M., Feenstra I., Van Ravenswaaij-Arts C.M., Smeets D.F., Menzel C., Ullmann R., Musante L., Ropers H.H.. Disruption of the TCF4 gene in a girl with mental retardation but without the classical pitt-hopkins syndrome. Am. J. Med. Genet. A. 2008; 146A:2053–2059. [DOI] [PubMed] [Google Scholar]
- 28. Kargapolova Y., Rehimi R., Kayserili H., Bruhl J., Sofiadis K., Zirkel A., Palikyras S., Mizi A., Li Y., Yigit G.et al.. Overarching control of autophagy and DNA damage response by CHD6 revealed by modeling a rare human pathology. Nat. Commun. 2021; 12:3014. [DOI] [PMC free article] [PubMed] [Google Scholar]
- 29. Fliers E.A., Vasquez A.A., Poelmans G., Rommelse N., Altink M., Buschgens C., Asherson P., Banaschewski T., Ebstein R., Gill M.et al.. Genome-wide association study of motor coordination problems in ADHD identifies genes for brain and muscle function. World J. Biol. Psychiatry. 2012; 13:211–222. [DOI] [PubMed] [Google Scholar]
- 30. Lathrop M.J., Chakrabarti L., Eng J., Rhodes C.H., Lutz T., Nieto A., Liggitt H.D., Warner S., Fields J., Stoger R.et al.. Deletion of the chd6 exon 12 affects motor coordination. Mamm. Genome. 2010; 21:130–142. [DOI] [PMC free article] [PubMed] [Google Scholar]
- 31. Zhang X., Cai S., Chen L., Yuan R., Nie Y., Ding S., Fang Y., Zhu Q., Chen K., Wei H.et al.. Integrated miRNA-mRNA transcriptomic analysis reveals epigenetic-mediated embryonic muscle growth differences between wuzhishan and landrace pigs1. J. Anim. Sci. 2019; 97:1967–1978. [DOI] [PMC free article] [PubMed] [Google Scholar]
- 32. Zhang T., Zhang X., Han K., Zhang G., Wang J., Xie K., Xue Q.. Genome-Wide analysis of lncRNA and mRNA expression during differentiation of abdominal preadipocytes in the chicken. G3 (Bethesda). 2017; 7:953–966. [DOI] [PMC free article] [PubMed] [Google Scholar]
- 33. Lutz T., Stoger R., Nieto A.. CHD6 is a DNA-dependent ATPase and localizes at nuclear sites of mRNA synthesis. FEBS Lett. 2006; 580:5851–5857. [DOI] [PubMed] [Google Scholar]
- 34. Stanley F.K., Moore S., Goodarzi A.A.. CHD chromatin remodelling enzymes and the DNA damage response. Mutat. Res. 2013; 750:31–44. [DOI] [PubMed] [Google Scholar]
- 35. Wang H.P., Long X.H., Sun Z.Z., Rigaud O., Xu Q.Z., Huang Y.C., Sui J.L., Bai B., Zhou P.K.. Identification of differentially transcribed genes in human lymphoblastoid cells irradiated with 0.5 gy of gamma-ray and the involvement of low dose radiation inducible CHD6 gene in cell proliferation and radiosensitivity. Int. J. Radiat. Biol. 2006; 82:181–190. [DOI] [PubMed] [Google Scholar]
- 36. He Y., Fu W., Cao K., He Q., Ding X., Chen J., Zhu L., Chen T., Ding L., Yang Y.et al.. IFN-kappa suppresses the replication of influenza a viruses through the IFNAR-MAPK-Fos-CHD6 axis. Sci. Signal. 2020; 13:eaaz3381. [DOI] [PubMed] [Google Scholar]
- 37. Marcos-Villar L., Pazo A., Nieto A.. Influenza virus and chromatin: role of the CHD1 chromatin remodeler in the virus life cycle. J. Virol. 2016; 90:3694–3707. [DOI] [PMC free article] [PubMed] [Google Scholar]
- 38. Alfonso R., Rodriguez A., Rodriguez P., Lutz T., Nieto A.. CHD6, a cellular repressor of influenza virus replication, is degraded in human alveolar epithelial cells and mice lungs during infection. J. Virol. 2013; 87:4534–4544. [DOI] [PMC free article] [PubMed] [Google Scholar]
- 39. Alfonso R., Lutz T., Rodriguez A., Chavez J.P., Rodriguez P., Gutierrez S., Nieto A.. CHD6 chromatin remodeler is a negative modulator of influenza virus replication that relocates to inactive chromatin upon infection. Cell Microbiol. 2011; 13:1894–1906. [DOI] [PubMed] [Google Scholar]
- 40. Fertey J., Ammermann I., Winkler M., Stoger R., Iftner T., Stubenrauch F.. Interaction of the papillomavirus E8–E2C protein with the cellular CHD6 protein contributes to transcriptional repression. J. Virol. 2010; 84:9505–9515. [DOI] [PMC free article] [PubMed] [Google Scholar]
- 41. Nioi P., Nguyen T., Sherratt P.J., Pickett C.B.. The carboxy-terminal neh3 domain of nrf2 is required for transcriptional activation. Mol. Cell Biol. 2005; 25:10895–10906. [DOI] [PMC free article] [PubMed] [Google Scholar]
- 42. Sancho A., Li S., Paul T., Zhang F., Aguilo F., Vashisht A., Balasubramaniyan N., Leleiko N.S., Suchy F.J., Wohlschlegel J.A.et al.. CHD6 regulates the topological arrangement of the CFTR locus. Hum. Mol. Genet. 2015; 24:2724–2732. [DOI] [PMC free article] [PubMed] [Google Scholar]
- 43. de Dieuleveult M., Yen K., Hmitou I., Depaux A., Boussouar F., Bou Dargham D., Jounier S., Humbertclaude H., Ribierre F., Baulard C.et al.. Genome-wide nucleosome specificity and function of chromatin remodellers in ES cells. Nature. 2016; 530:113–116. [DOI] [PMC free article] [PubMed] [Google Scholar]
- 44. Burkhardt L., Fuchs S., Krohn A., Masser S., Mader M., Kluth M., Bachmann F., Huland H., Steuber T., Graefen M.et al.. CHD1 is a 5q21 tumor suppressor required for ERG rearrangement in prostate cancer. Cancer Res. 2013; 73:2795–2805. [DOI] [PubMed] [Google Scholar]
- 45. Zhao D., Cai L., Lu X., Liang X., Li J., Chen P., Ittmann M., Shang X., Jiang S., Li H.et al.. Chromatin regulator CHD1 remodels the immunosuppressive tumor microenvironment in PTEN-Deficient prostate cancer. Cancer Discov. 2020; 10:1374–1387. [DOI] [PMC free article] [PubMed] [Google Scholar]
- 46. Zhao D., Lu X., Wang G., Lan Z., Liao W., Li J., Liang X., Chen J.R., Shah S., Shang X.et al.. Synthetic essentiality of chromatin remodelling factor CHD1 in PTEN-deficient cancer. Nature. 2017; 542:484–488. [DOI] [PMC free article] [PubMed] [Google Scholar]
- 47. Kolla V., Zhuang T., Higashi M., Naraparaju K., Brodeur G.M.. Role of CHD5 in human cancers: 10 years later. Cancer Res. 2014; 74:652–658. [DOI] [PMC free article] [PubMed] [Google Scholar]
- 48. Mallette F.A., Richard S.. JMJD2A promotes cellular transformation by blocking cellular senescence through transcriptional repression of the tumor suppressor CHD5. Cell Rep. 2012; 2:1233–1243. [DOI] [PubMed] [Google Scholar]
- 49. Xia L., Huang W., Bellani M., Seidman M.M., Wu K., Fan D., Nie Y., Cai Y., Zhang Y.W., Yu L.R.et al.. CHD4 has oncogenic functions in initiating and maintaining epigenetic suppression of multiple tumor suppressor genes. Cancer Cell. 2017; 31:653–668. [DOI] [PMC free article] [PubMed] [Google Scholar]
- 50. Dufresne J., Bowden P., Thavarajah T., Florentinus-Mefailoski A., Chen Z.Z., Tucholska M., Norzin T., Ho M.T., Phan M., Mohamed N.et al.. The plasma peptides of ovarian cancer. Clin. Proteomics. 2018; 15:41. [DOI] [PMC free article] [PubMed] [Google Scholar]
- 51. Nickerson M.L., Witte N., Im K.M., Turan S., Owens C., Misner K., Tsang S.X., Cai Z., Wu S., Dean M.et al.. Molecular analysis of urothelial cancer cell lines for modeling tumor biology and drug response. Oncogene. 2017; 36:35–46. [DOI] [PMC free article] [PubMed] [Google Scholar]
- 52. Gui Y., Guo G., Huang Y., Hu X., Tang A., Gao S., Wu R., Chen C., Li X., Zhou L.et al.. Frequent mutations of chromatin remodeling genes in transitional cell carcinoma of the bladder. Nat. Genet. 2011; 43:875–878. [DOI] [PMC free article] [PubMed] [Google Scholar]
- 53. Mouradov D., Sloggett C., Jorissen R.N., Love C.G., Li S., Burgess A.W., Arango D., Strausberg R.L., Buchanan D., Wormald S.et al.. Colorectal cancer cell lines are representative models of the main molecular subtypes of primary cancer. Cancer Res. 2014; 74:3238–3247. [DOI] [PubMed] [Google Scholar]
- 54. Hassan Ali, Mokhtar N.Z., Sin Kok, MohamedRose T., Sagap I., Harun I., Jamal R. Integrated analysis of copy number variation and genome-wide expression profiling in colorectal cancer tissues. PLoS One. 2014; 9:e92553. [DOI] [PMC free article] [PubMed] [Google Scholar]
- 55. Douet-Guilbert N., De Braekeleer E., Tous C., Gueganic N., Basinko A., Le Bris M.J., Morel F., De Braekeleer M.. A novel translocation (6;20)(q13;q12) in acute myeloid leukemia likely results in LMBRD1-CHD6 fusion. Leuk Lymphoma. 2015; 56:527–528. [DOI] [PubMed] [Google Scholar]
- 56. Chen H.Z., Tsai S.Y., Leone G.. Emerging roles of E2Fs in cancer: an exit from cell cycle control. Nat. Rev. Cancer. 2009; 9:785–797. [DOI] [PMC free article] [PubMed] [Google Scholar]
- 57. Basak S., Jacobs S.B., Krieg A.J., Pathak N., Zeng Q., Kaldis P., Giaccia A.J., Attardi L.D.. The metastasis-associated gene prl-3 is a p53 target involved in cell-cycle regulation. Mol. Cell. 2008; 30:303–314. [DOI] [PMC free article] [PubMed] [Google Scholar]
- 58. Poppy Roworth A., Ghari F., La Thangue N.B.. To live or let die - complexity within the E2F1 pathway. Mol. Cell Oncol. 2015; 2:e970480. [DOI] [PMC free article] [PubMed] [Google Scholar]
- 59. Louie M.C., Zou J.X., Rabinovich A., Chen H.W.. ACTR/AIB1 functions as an E2F1 coactivator to promote breast cancer cell proliferation and antiestrogen resistance. Mol. Cell Biol. 2004; 24:5157–5171. [DOI] [PMC free article] [PubMed] [Google Scholar]
- 60. Bracken A.P., Pasini D., Capra M., Prosperini E., Colli E., Helin K.. EZH2 is downstream of the pRB-E2F pathway, essential for proliferation and amplified in cancer. EMBO J. 2003; 22:5323–5335. [DOI] [PMC free article] [PubMed] [Google Scholar]
- 61. Jin X., Ding D., Yan Y., Li H., Wang B., Ma L., Ye Z., Ma T., Wu Q., Rodrigues D.N.et al.. Phosphorylated RB promotes cancer immunity by inhibiting NF-kappaB activation and PD-L1 expression. Mol. Cell. 2019; 73:22–35. [DOI] [PMC free article] [PubMed] [Google Scholar]
- 62. Mu P., Zhang Z., Benelli M., Karthaus W.R., Hoover E., Chen C.C., Wongvipat J., Ku S.Y., Gao D., Cao Z.et al.. SOX2 promotes lineage plasticity and antiandrogen resistance in TP53- and RB1-deficient prostate cancer. Science. 2017; 355:84–88. [DOI] [PMC free article] [PubMed] [Google Scholar]
- 63. Abida W., Cyrta J., Heller G., Prandi D., Armenia J., Coleman I., Cieslik M., Benelli M., Robinson D., Van Allen E.M.et al.. Genomic correlates of clinical outcome in advanced prostate cancer. Proc. Natl. Acad. Sci. USA. 2019; 116:11428–11436. [DOI] [PMC free article] [PubMed] [Google Scholar]
- 64. Watson P.A., Arora V.K., Sawyers C.L.. Emerging mechanisms of resistance to androgen receptor inhibitors in prostate cancer. Nat. Rev. Cancer. 2015; 15:701–711. [DOI] [PMC free article] [PubMed] [Google Scholar]
- 65. Trapnell C., Roberts A., Goff L., Pertea G., Kim D., Kelley D.R., Pimentel H., Salzberg S.L., Rinn J.L., Pachter L.. Differential gene and transcript expression analysis of RNA-seq experiments with tophat and cufflinks. Nat. Protoc. 2012; 7:562–578. [DOI] [PMC free article] [PubMed] [Google Scholar]
- 66. Howe E.A., Sinha R., Schlauch D., Quackenbush J.. RNA-Seq analysis in meV. Bioinformatics. 2011; 27:3209–3210. [DOI] [PMC free article] [PubMed] [Google Scholar]
- 67. Quinlan A.R., Hall I.M.. BEDTools: a flexible suite of utilities for comparing genomic features. Bioinformatics. 2010; 26:841–842. [DOI] [PMC free article] [PubMed] [Google Scholar]
- 68. Chen K., Chen Z., Wu D., Zhang L., Lin X., Su J., Rodriguez B., Xi Y., Xia Z., Chen X.et al.. Broad H3K4me3 is associated with increased transcription elongation and enhancer activity at tumor-suppressor genes. Nat. Genet. 2015; 47:1149–1157. [DOI] [PMC free article] [PubMed] [Google Scholar]
- 69. Chen K., Xi Y., Pan X., Li Z., Kaestner K., Tyler J., Dent S., He X., Li W.. DANPOS: dynamic analysis of nucleosome position and occupancy by sequencing. Genome Res. 2013; 23:341–351. [DOI] [PMC free article] [PubMed] [Google Scholar]
- 70. Kent W.J., Zweig A.S., Barber G., Hinrichs A.S., Karolchik D. BigWig and bigbed: enabling browsing of large distributed datasets. Bioinformatics. 2010; 26:2204–2207. [DOI] [PMC free article] [PubMed] [Google Scholar]
- 71. Kent W.J., Sugnet C.W., Furey T.S., Roskin K.M., Pringle T.H., Zahler A.M., Haussler D. The human genome browser at UCSC. Genome Res. 2002; 12:996–1006. [DOI] [PMC free article] [PubMed] [Google Scholar]
- 72. Raney B.J., Dreszer T.R., Barber G.P., Clawson H., Fujita P.A., Wang T., Nguyen N., Paten B., Zweig A.S., Karolchik D.et al.. Track data hubs enable visualization of user-defined genome-wide annotations on the UCSC genome browser. Bioinformatics. 2014; 30:1003–1005. [DOI] [PMC free article] [PubMed] [Google Scholar]
- 73. Cui K., Zhao K.. Genome-wide approaches to determining nucleosome occupancy in metazoans using MNase-Seq. Methods Mol. Biol. 2012; 833:413–419. [DOI] [PMC free article] [PubMed] [Google Scholar]
- 74. Hoadley K.A., Yau C., Hinoue T., Wolf D.M., Lazar A.J., Drill E., Shen R., Taylor A.M., Cherniack A.D., Thorsson V.et al.. Cell-of-Origin patterns dominate the molecular classification of 10,000 tumors from 33 types of cancer. Cell. 2018; 173:291–304. [DOI] [PMC free article] [PubMed] [Google Scholar]
- 75. Taylor B.S., Schultz N., Hieronymus H., Gopalan A., Xiao Y., Carver B.S., Arora V.K., Kaushik P., Cerami E., Reva B.et al.. Integrative genomic profiling of human prostate cancer. Cancer Cell. 2010; 18:11–22. [DOI] [PMC free article] [PubMed] [Google Scholar]
- 76. Grasso C.S., Wu Y.M., Robinson D.R., Cao X., Dhanasekaran S.M., Khan A.P., Quist M.J., Jing X., Lonigro R.J., Brenner J.C.et al.. The mutational landscape of lethal castration-resistant prostate cancer. Nature. 2012; 487:239–243. [DOI] [PMC free article] [PubMed] [Google Scholar]
- 77. Robinson D., Van Allen E.M., Wu Y.M., Schultz N., Lonigro R.J., Mosquera J.M., Montgomery B., Taplin M.E., Pritchard C.C., Attard G.et al.. Integrative clinical genomics of advanced prostate cancer. Cell. 2015; 161:1215–1228. [DOI] [PMC free article] [PubMed] [Google Scholar]
- 78. Lambert S.A., Jolma A., Campitelli L.F., Das P.K., Yin Y., Albu M., Chen X., Taipale J., Hughes T.R., Weirauch M.T.. The human transcription factors. Cell. 2018; 172:650–665. [DOI] [PubMed] [Google Scholar]
- 79. Tan H.L., Sood A., Rahimi H.A., Wang W., Gupta N., Hicks J., Mosier S., Gocke C.D., Epstein J.I., Netto G.J.et al.. Rb loss is characteristic of prostatic small cell neuroendocrine carcinoma. Clin. Cancer Res. 2014; 20:890–903. [DOI] [PMC free article] [PubMed] [Google Scholar]
- 80. Nava Rodrigues D., Casiraghi N., Romanel A., Crespo M., Miranda S., Rescigno P., Figueiredo I., Riisnaes R., Carreira S., Sumanasuriya S.et al.. RB1 heterogeneity in advanced metastatic castration-resistant prostate cancer. Clin. Cancer Res. 2019; 25:687–697. [DOI] [PubMed] [Google Scholar]
- 81. Zerbino D.R., Frankish A., Flicek P.. Progress, challenges, and surprises in annotating the human genome. Annu. Rev. Genomics Hum. Genet. 2020; 21:55–79. [DOI] [PMC free article] [PubMed] [Google Scholar]
- 82. Frankish A., Diekhans M., Ferreira A.M., Johnson R., Jungreis I., Loveland J., Mudge J.M., Sisu C., Wright J., Armstrong J.et al.. GENCODE reference annotation for the human and mouse genomes. Nucleic Acids Res. 2019; 47:D766–D773. [DOI] [PMC free article] [PubMed] [Google Scholar]
- 83. GTEx Consortium, Laboratory, Data Analysis Coordinating Center (LDACC) -Analysis Working Group, Statistical Methods groups-Analysis Working Group, Enhancing GTEx (eGTEx) groups, NIH Common Fund, NIH/NCI, NIH/NHGRI, NIH/NIM, NIH/NIDA, Biospecimen Collection Source Site-NDRI Genetic effects on gene expression across human tissues. Nature. 2017; 550:204–213. [DOI] [PMC free article] [PubMed] [Google Scholar]
- 84. Stunnenberg H.G., International Human Epigenome, C. International Human Epigenome, C. Hirst M. The international human epigenome consortium: a blueprint for scientific collaboration and discovery. Cell. 2016; 167:1145–1149. [DOI] [PubMed] [Google Scholar]
- 85. Cieslik M., Bekiranov S.. Combinatorial epigenetic patterns as quantitative predictors of chromatin biology. BMC Genomics. 2014; 15:76. [DOI] [PMC free article] [PubMed] [Google Scholar]
- 86. Stolzenberg D.S., Grant P.A., Bekiranov S.. Epigenetic methodologies for behavioral scientists. Horm. Behav. 2011; 59:407–416. [DOI] [PMC free article] [PubMed] [Google Scholar]
- 87. Anaya J., Reon B., Chen W.M., Bekiranov S., Dutta A.. A pan-cancer analysis of prognostic genes. PeerJ. 2015; 3:e1499. [DOI] [PMC free article] [PubMed] [Google Scholar]
- 88. Hanahan D., Weinberg R.A.. Hallmarks of cancer: the next generation. Cell. 2011; 144:646–674. [DOI] [PubMed] [Google Scholar]
- 89. Braadland P.R., Urbanucci A.. Chromatin reprogramming as an adaptation mechanism in advanced prostate cancer. Endocr Relat. Cancer. 2019; 26:R211–R235. [DOI] [PubMed] [Google Scholar]
- 90. Roberts C.W., Orkin S.H.. The SWI/SNF complex–chromatin and cancer. Nat. Rev. Cancer. 2004; 4:133–142. [DOI] [PubMed] [Google Scholar]
- 91. Weissmiller A.M., Wang J., Lorey S.L., Howard G.C., Martinez E., Liu Q., Tansey W.P.. Inhibition of MYC by the SMARCB1 tumor suppressor. Nat. Commun. 2019; 10:2014. [DOI] [PMC free article] [PubMed] [Google Scholar]
- 92. Barisic D., Stadler M.B., Iurlaro M., Schubeler D. Mammalian ISWI and SWI/SNF selectively mediate binding of distinct transcription factors. Nature. 2019; 569:136–140. [DOI] [PMC free article] [PubMed] [Google Scholar]
- 93. Lai A.Y., Wade P.A.. Cancer biology and nurd: a multifaceted chromatin remodelling complex. Nat. Rev. Cancer. 2011; 11:588–596. [DOI] [PMC free article] [PubMed] [Google Scholar]
- 94. Araki K., Nakajima Y., Eto K., Ikeda M.A.. Distinct recruitment of E2F family members to specific E2F-binding sites mediates activation and repression of the E2F1 promoter. Oncogene. 2003; 22:7632–7641. [DOI] [PubMed] [Google Scholar]
- 95. Dehm S.M., Huang H.. Androgen receptor: functional roles and facets of regulation in urology. Asian. J. Urol. 2020; 7:189–190. [DOI] [PMC free article] [PubMed] [Google Scholar]
Associated Data
This section collects any data citations, data availability statements, or supplementary materials included in this article.
Supplementary Materials
Data Availability Statement
The next-generation sequencing datasets have been deposited to the Gene Expression Omnibus (GEO: https://www.ncbi.nlm.nih.gov/geo/) with the accession number GSE214212.