
Figure 4.
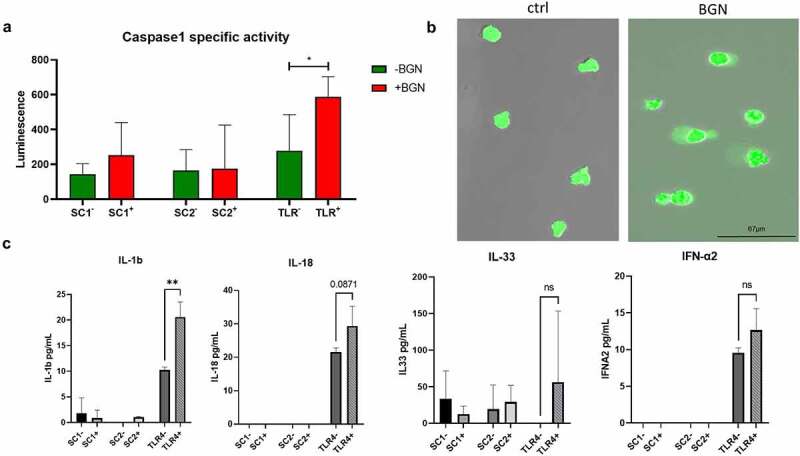
Altered casp1 activity and cytokine secretion pattern in MDS-L subpopulations. (a) Bar chart demonstrating casp1 activity after 4 h stimulation of the three subpopulations of interest (SC1, SC2, TLR4) with BGN. Casp1 activity was measured after harvesting in a luminometer. Unstimulated cells for each of the MDS-L subpopulations are depicted with green color and a minus sign (-), while cells stimulated with BGN with red and a plus (+) sign. The mean luminescence is represented with the colored bands, while the standard deviation was plotted using the black error bars adjustment to its respective mean value (whiskers). T-tests were conducted to determine statistical significance using the average of two measurements (technical replicates) in three (n = 3) independent experiments. P values <0,5 were considered significant. (b) Fluorescence microscope image of the TLR4 subpopulation of the MDS-L cell line after stimulation with BGN. The cells demonstrate cytoplasmic swelling, previously associated with inflammasome activation. TLR4 cells were additionally stained with CFSE to increase the visibility of the effect. (c) Cytokine secretion in the supernatant of the 3 subpopulations of interest before and after 4 h stimulation with BGN. The inflammatory cytokine profile of the 3 subpopulations was assessed using a multiplexed cytokine assay with flow cytometry. The inflammasome related cytokines IL-1β, IL-18 and IL-33 are investigated, along with IFN-α. The concentration of the cytokines is shown in pg/mL (y axis). The average concentration is represented with gray scale bands, while the standard deviation reported by the Whiskers. T- tests were conducted to determine statistical significance using the average of two measurements (technical replicates) in three (n = 3) independent experiments.