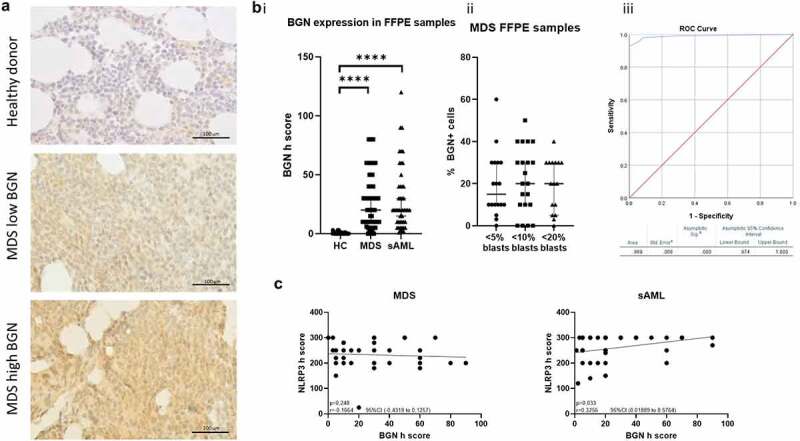
Figure 6.

Distinct BGN expression in MDS and AML BMB. (a) Representative pictures of BGN IHC staining in FFPE BMB from a healthy donor, a low expressing MDS patient and a high expressing MDS patient. The slides were stained as mentioned in the materials and methods. A scale has been used as a reference. (b) Differential BGN expression between (i) healthy donors and MDS/sAML patients indicated by a comparison of the BGN H-scores and (ii) MDS patients with different blast counts indicated by a comparison of the percentage of BGN positive cells. (iii) Depiction of the generated ROC curve for the determination of the diagnostic value of BGN H-score. The area under curve (AOC) is presented along with the significance levels (t test), median of the patient samples and the 95% CI. (c) Correlation plots comparing the BGN (x axis) and NLRP3 (y axis) h score determined. The correlations are separately investigated in MDS (left) and sAML (right) patient samples. The linear regression is additionally seen on the graph together with the p value, r and 95%CI derived from the correlation analysis.
