

Abstract
Adipose tissue dysfunction is an important determinant of obesity-associated, lipid-induced metabolic complications. Ceramides are well-known mediators of lipid-induced insulin resistance in peripheral organs such as muscle. DEGS1 is the desaturase catalyzing the last step in the main ceramide biosynthetic pathway. Functional suppression of DEGS1 activity results in substantial changes in ceramide species likely to affect fundamental biological functions such as oxidative stress, cell survival, and proliferation. Here, we show that degs1 expression is specifically decreased in the adipose tissue of obese patients and murine models of genetic and nutritional obesity. Moreover, loss-of-function experiments using pharmacological or genetic ablation of DEGS1 in preadipocytes prevented adipogenesis and decreased lipid accumulation. This was associated with elevated oxidative stress, cellular death, and blockage of the cell cycle. These effects were coupled with increased dihydroceramide content. Finally, we validated in vivo that pharmacological inhibition of DEGS1 impairs adipocyte differentiation. These data identify DEGS1 as a new potential target to restore adipose tissue function and prevent obesity-associated metabolic disturbances.
Introduction
Dysfunction of white adipose tissue (WAT) and impaired differentiation of new adipocytes may lead to lipid leakage and inappropriate accumulation of ectopic lipids in peripheral organs, causing lipotoxicity and the metabolic syndrome (1). The toxic effects of lipids are determined by both their quantity and their qualitative characteristics (2). Whereas it is well documented that specific species of sphingolipids and ceramides (Cers) mediate lipotoxicity in liver and muscle (3,4), the contribution of specific lipotoxic species to WAT dysfunction in the context of obesity is still not well defined. It is known that in rodent WAT, Cers increase in response to a high-fat diet (HFD) (5,6) concomitantly with the onset of insulin resistance (6). Lipid analysis of WAT from human obese subjects has produced conflicting results, showing either increased or decreased Cer levels in obese and insulin-resistant patients (7,8).
Cers can be synthesized from sphingomyelins, but the main contributor to their biosynthesis is the de novo pathway. The final reaction of the de novo pathway is catalyzed by a Δ4-dihydroceramide (DhCer) desaturase (DEGS1) that adds a 4,5-trans-double bound on the sphingoid base of the DhCer (9). The other enzyme, DEGS2, catalyzes the synthesis of phytoceramides (10), whose expression is restricted to skin, intestine, and kidney.
There is evidence that downregulation of degs1 increases the DhCer/Cer ratio in different cellular models. Although DhCer was considered an inactive precursor of Cers (11), recent studies (12,13) have suggested their relevance as modulators of cell cycle, apoptosis, autophagy, or oxidative stress, processes that a priori are expected to compromise the development and function of adipose tissue (AT).
Since DEGS1 is the key enzyme regulating the DhCer/Cer ratio, understanding its regulation is important in determining the pathophysiological relevance of this pathway in AT. Of note, degs1 has recently been identified in genome-wide association studies as a candidate gene associated with fat mass accumulation in mice (14), further suggesting that DEGS1 may be relevant for the adaptive accretion of AT. Moreover, DEGS1 could be considered an attractive therapeutic target for obesity-associated insulin resistance, since fenretinide has been claimed to improve insulin sensitivity by inhibiting DEGS1 (15), although other molecular targets cannot be ruled out.
Here we show that DEGS1 expression is selectively perturbed in the WAT of murine models of nutritional and genetically induced obesity and in the WAT of morbidly obese (MO) patients. In vitro analysis revealed that both pharmacological inhibition and genetic ablation of DEGS1 result in impaired adipocyte differentiation and lipid accumulation, effects mediated by increased DhCer content. In vivo, pharmacological inhibition of DEGS1 also resulted in impaired adipocyte differentiation. Decreased levels of DEGS1 were associated with increased oxidative stress, accelerated cellular death, and blockage of cell cycle. We also show data supporting that DEGS1 expression is regulated by peroxisome proliferator–activated receptor (PPAR)γ.
Research Design and Methods
Mice Husbandry
Animals were housed at 22–24°C with 12-h light/dark cycles. Food and water were available ad libitum. Lean wild-type (WT), PPARγ2−/−, and PPARγ2/ob/ob double knockout mice (16) were used for profiling purposes. Mice were fed a normal chow diet (D12450B) or an HFD (D12451) from Research Diets.
For the pharmacological inhibition of DEGS1, 10-week-old male C57BL/6 WT mice were used. Mice were fed an HFD for 5 weeks before C8-cyclopropenylceramide (C8-CPPC) (Matreya) administration. All protocols used were approved by the U.K. Home Office.
Intraperitoneal Injection of Cyclopropenylceramide
Mice were distributed in two groups (n = 8) and administered daily vehicle (2-hydroxypropyl betacyclodextrine) or C8-CPPC (2 mg/kg/day) for 9 days via intraperitoneal injection. Mice were culled at the end of the experiment, and WAT was removed for gene expression and microscopy analysis. No differences in food intake, lean mass, and fat content were observed during the treatment.
Ex Vivo Experiments in Isolated Mature Adipocytes
Adipocytes from gonadal WAT of 16-week-old C57BL/6 mice were obtained by collagenase type II digestion at 37°C. After digestion, adipocytes were placed in DMEM with or without 1 µmol/L C8-CPPC every 5 h for a total period of 20 h.
Retroviral Short Hairpin RNA Constructs for DEGS1
RNAi-Ready pSIREN-RetroQ vectors (BD Biosciences) were used to target degs1 in 3T3-L1 cells. Sequences targeting degs1 were ligated into the pSIREN vector as described in the manufacturer’s instructions. Retroviruses were generated by transfecting BOSC cells (American Type Culture Collection) with the pSIREN plasmids using FuGene6 (Roche). Supernatant with the viral content was used to transfect 3T3-L1 preadipocytes. Twenty-four hours after retroviral infection, the cells were selected with puromycin (4 μg/mL).
Culture, Differentiation, and Treatment of 3T3-L1 Preadipocytes
Cells were differentiated into adipocytes (day 9) accordingly to the protocol described by Roberts et al. (17) with or without rosiglitazone 0.1 µmol/L. Lipid accumulation was assessed by Oil Red O solution (18).
Pharmacological Inhibition of DEGS1 Activity In Vitro
Effects on Differentiation
At day 0 of differentiation, 3T3-L1 cells were treated with C8-CPPC 1 μmol/L and/or rosiglitazone 0.1 µmol/L for 96 h.
Effects on Lipolysis
On day 8 of differentiation, after 48 h of treatment with C8-CPPC 1 µmol/L, the cells were exposed to norepinephrine (NE) (10−8 and 10−7 mol/L) for 6 h.
Effects on Insulin Signaling
On day 8 of differentiation, after 48 h of treatment with C8-CPPC 1 µmol/L, the cells were exposed to insulin (10 and 100 nmol/L) for 15 min.
Effects on GLUT4 and Adiponectin
On day 8 of differentiation, after 48 h of treatment with C8-CPPC 0.5–1 µmol/L, the cells were exposed to insulin.
Effects on AMPK
On day 8 of differentiation, after 48 h of treatment with C8-CPPC 0.5–1 µmol/L, the cells were exposed to insulin (10 and 100 nmol/L), rosiglitazone (1 and 10 nmol/L), and metformin (100 nmol/L) for 24 h.
DhCer Treatment
3T3-L1 preadipocytes were treated at day 0 of differentiation with the induction cocktail and C2DhCer at 50 µmol/L for 3 days, and a second batch of cells were exposed at day 3 of differentiation and treated with C2DhCer at 50 µmol/L for 3 days. All batches were taken until final differentiation at day 9.
Human Samples
The cohort included 28 MO and 6 nonobese subjects with no alterations to lipid or glucose metabolism as control subjects (Table 1). Approval for the study was given by the ethics committee, and all patients gave their informed consent. Visceral AT biopsy samples were obtained from MO patients undergoing bariatric surgery (Scopinaro procedure) or laparoscopic surgery (hiatus hernia repair or cholecystectomies) for the lean subjects.
Table 1.
Clinical characteristics of control subjects and MO patients
| Control subjects | MO patients | |
|---|---|---|
| Sex, n | ||
| Male | 3 | 14 |
| Female | 3 | 14 |
| Age, years | 52.17 ± 5.1 | 41.57 ± 2.96 |
| Weight, kg | 74.00 ± 0.71 | 155.5 ± 7.32 |
| Height, cm | 162.60 ± 1.60 | 165.53 ± 2.49 |
| BMI, kg/m2 | 25.04 ± 0.55 | 56.51 ± 1.68 |
| Serum insulin, IU/mL | 11.23 ± 1.58 | 30.09 ± 2.30 |
| HOMA-IR | 3.51 ± 0.48 | 8.18 ± 0.78 |
| Serum glucose, mmol/L | 6.03 ± 0.32 | 5.74 ± 0.26 |
| Serum cholesterol, mmol/L | 4.68 ± 0.40 | 4.92 ± 0.25 |
| HDL cholesterol, mmol/L | 0.97 ± 0.23 | 1.10 ± 0.09 |
| Triglycerides, mmol/L | 1.08 ± 0.20 | 1.42 ± 0.19 |
Values are reported as the mean ± SEM, unless otherwise indicated. HOMA-IR, HOMA of insulin resistance.
Western Blotting
Protein extracts were prepared using the Nuclear and Cytoplasmic Extraction Reagents Kit (Pierce) according to the manufacturer’s instructions. Immunoblots were incubated with the following antibodies: PPARγ, C/EBPβ, and CyclinA (Santa Cruz Biotechnology); CyclinB1, D1, D3 and E1, cdk4, AKT, Ser473-pAKT, p44/42 MAPK, phospho-p44/42 MAPK, Ser660-pHSL (p-hormone-sensitive lipase), Ser565-pHSL, total HSL, ATGL, caveolin-1, plin1, glut4, adiponectin, and AMPK (Cell Signaling Technology); and adfp/adrp, abhd5, and anti-β-actin (Abcam).
RT-PCR
RNA was extracted using TRI Reagent (Sigma) and reverse transcribed to cDNA. Real-time PCR using SYBRgreen was performed according to the manufacturer’s instructions (ABI). Primer sequences were obtained from Primer Blast (19). Expression of genes was corrected by the geometrical average of 18s, β2m, β-act, and 36b4 using Bestkeeper (20).
Apoptosis: Combined Annexin V/Propidium Iodide Staining
Viability was assessed by using an Annexin V/propidium iodide kit (Bender MedSystems), according to the manufacturer's recommendations. Binding of fluorescein-conjugated Annexin V and propidium iodide was measured by FACSCalibur (BD Biosciences).
Cellular Proliferation
Cell viability was assessed using an colorimetric assay (Roche) following the protocol supplied by the manufacturer. Cell proliferation was analyzed by quantification of the incorporation of BrdU (Roche).
Boron-Dipyrromethene Staining, Reactive Oxygen Stress Production, and Mitochondrial Content
Cells were incubated with boron-dipyrromethene (BODIPY) at 4°C or alternatively with 20 µmol/L 2′,7′-dichlorodihydrofluorescein diacetate or 100 nmol/L Mitotracker (Invitrogen) at 37°C for 30 min and analyzed on a FACSCalibur cell analyzer.
Cellular Oxygen Consumption
Cells were exposed to oligomycin (1 µmol/L), C8-CPPC (0.9 µmol/L), and antimycin/rotenone (1 µmol/L each); O2 consumption was measured using the XF24 analyzer (Seahorse Bioscience) for a period of 90 min.
Whole-Mount Confocal Microscopy
Gonadal AT was fixed in 4% paraformaldehyde. Samples were incubated at 4°C with mouse Pref-1 (preadipocyte factor-1) or rabbit Ki67 primary antibodies. Nuclei and neutral lipids were stained with Hoechst 33342 and BODIPY 493/503, respectively. Sample examination was performed using a Zeiss 510 confocal laser scanning microscope (Carl Zeiss). Pref-1+, Ki67+, and BODIPY+ cells and total cells (up to 913 cells/field) were automatically counted by using ImageJ software in three independent fields in each tissue.
Light Microscopy Analysis
Samples for AT hematoxylin-eosin staining were prepared as described previously (16). Adipocyte sizes were measured using Cell P (Olympus Soft Imaging Solutions GmbH). Between 1,000 and 3,000 adipocytes from each mouse were used to obtain the mean cell area.
Luciferase Reporter Assay
Human embryonic kidney 293 cells were transfected using Lipofectamine LTX (Invitrogen), following the manufacturer's instructions. Seventy-five nanograms of the reporter plasmid (3xPPRE TKLuc) and 37.5 ng of the eukaryotic expression vector (pSV-PPARγ) were cotransfected to each well. The plasmid pRL-CMV (5 ng/well) was included as an internal control. Twenty-four hours post-transfection, cells were treated as indicated (DMSO, rosiglitazone, 10 µmol/L; GW1929, 10 µmol/L; and C2DhCer, C16DhCer, and Cer, 100 μmol/L). Luciferase assays were performed using the dual luciferase reporter assay system (Promega).
Lipidomics
Cells were mixed with 0.9% NaCl and sonicated for 5 min at 5°C and 40 kHz. Samples were spiked with internal standard. The samples were extracted with chloroform:methanol (2:1). The lower phase was collected and mixed with the labeled standard mixture (three stable isotope-labeled reference compounds). Lipid extracts were analyzed on a Q-ToF Premier Mass Spectrometer (Waters) combined with an Acquity Ultra Performance Liquid Chromatography/Mass Spectrometry system (Waters). The data were processed using MZmine software. The lipids were quantified by normalizing with corresponding internal standard.
Statistical Analysis
Student t test (unpaired), ANOVA, and Duncan test were used for the statistical analysis. Statistical significance was set at P < 0.05 and P < 0.01. The Spearman correlation was calculated to estimate the linear correlations between variables at P < 0.01.
Results
DEGS1 Is Downregulated in WAT in Obese Murine Models
Tissue distribution analysis showed that degs1 is present in most tissues, and it is particularly highly expressed in AT, liver, and muscle, whereas degs2 mRNA is detected only in intestine (Fig. 1A). Degs1 expression in vivo was positively correlated with WAT mass in lean healthy mice (Fig. 1B). However, this correlation was disrupted in murine models of nutritional and genetically induced obesity (HFD and ob/ob), where degs1 mRNA expression was decreased versus controls (Fig. 1C and F). Of note, the dysregulation of degs1 in obesity was limited to WAT, as its expression in liver or skeletal muscle was not affected in either HFD-fed mice (Fig. 1D and E) or ob/ob mice (Fig. 1G and H). DEGS1 was preferentially expressed in matured adipocytes versus stromal vascular fraction in lean and ob/ob mice (Supplementary Fig. 1), and downregulated in ob/ob adipocytes versus lean adipocytes. Moreover, this downregulation of degs1 in total WAT of HFD-fed and ob/ob mice was also recapitulated in visceral AT of MO patients (Supplementary Fig. 2A).
Figure 1.

A: Tissue distribution of degs1. B: Correlation of degs1 mRNA expression and fat pad size. The Spearman correlation coefficients were calculated to estimate the linear correlations between variables. The rejection level for a null hypothesis was P < 0.01. Data are from 14 lean mice. C–E: Expression levels of degs1 mRNA in response to HFD. F–H: Expression levels of degs1 mRNA in ob/ob mice. Values are the mean ± SEM for six to eight animals per group. *P < 0.05 vs. WT. AU, arbitrary units; BAT, brown AT; gWAT, gonadal WAT; IngFat, inguinal fat; RetroFat, retroperitoneal fat; SKM, skeletal muscle.
To determine whether the decrease in degs1 expression was part of a global adaptation of de novo Cer synthesis pathway in obesity, the expression of other genes in this pathway was measured. Expression of the sptlc1 and sptlc2 subunits was not changed in human visceral AT or in ob/ob WAT, but sptlc2 expression was increased in HFD WAT (Supplementary Fig. 2B and C). Moreover, both HFD and ob/ob mouse WAT exhibited a reduction in a subset of Cer synthases, suggesting a possible defect in the synthesis of a specific subset of Cers.
We then confirmed that modulators of obesity-associated inflammation may contribute to the downregulation of degs1, as treatment of 3T3-L1 adipocytes with tumor necrosis factor-α (5 and 10 ng/mL) for 48 h resulted in a dose-dependent downregulation of degs1 mRNA expression (38.8 ± 3.6% and 45.7 ± 7.3% reduction, respectively).
We then investigated a link between DEGS1 and the adipogenic program. It is known that obese and insulin-resistant murine models and humans have reduced expression of pparγ2 in WAT. Furthermore we observed that expression of pparγ2 and degs1 was directly correlated in 3T3-L1 after treatment with rosiglitazone (Supplementary Fig. 3A). To validate this in vivo, we analyzed the regulation of degs1 in AT, liver, and skeletal muscle of pparγ2KO and POKO mice (16). WAT of pparγ2KO and POKO mice expressed significantly lower degs1 mRNA levels compared with WT mice (Supplementary Fig. 3B). This association was restricted to WAT since the expression of degs1 in other metabolic organs such as skeletal muscle or liver was not affected when pparγ2 was absent (Supplementary Fig. 3C and D).
DEGS1 Controls Important Cellular Functions Such as Proliferation, Survival, and Oxidative Stress in 3T3-L1 Adipocytes
A stable degs1 knockdown 3T3-L1 cell line (65%) (Fig. 2A) resulted in inhibition of cell growth after 24 h (Fig. 2B and C). Degs1 knockdown also induced cell death (13.7%) and apoptosis (6.3%) (Fig. 2E). These were associated with a decrease in cyclin-A and cdk2 levels in degs1 KD proliferating cells (Fig. 2F), as well as elevated levels of Bax and caspase-3 mRNA (Fig. 2D). Elevated reactive oxygen species production (Fig. 2I) along with an upregulation of the expression of antioxidant genes were observed in degs1 KD preadipocytes (Fig. 2H). This was accompanied by impaired mitochondrial oxygen consumption (Fig. 2G) without changes in the number of mitochondria (Fig. 2J).
Figure 2.

A: mRNA expression of degs1 in 3T3-L1 treated with short hairpin RNA (shRNA) against degs1. B and C: Cell proliferation (XTT and BrdU assays every 24 h until 96 and 72 h, respectively). D: mRNA expression of Cdk2, Bcl2, Bax, and Caspase3. E: Apoptosis and cell death rate. F: Protein expression of Cdk2. G: Oxygen consumption rate. H: mRNA expression of antioxidant machinery genes. I: Reactive oxygen species production. J: Mitochondria levels. All these experiments were perfomed in degs1 KD and WT 3T3-L1 cells. Values are the mean ± SEM of three separate experiments performed in triplicate. ETC, electron transport chain; MFI, mean fluorescence intensity; PI, propidium iodide. *P < 0.05.
DEGS1 Is Required for Adipocyte Differentiation
Expression of degs1 is increased during normal differentiation of 3T3-L1 adipocytes (Fig. 3A). To investigate whether ablation of DEGS1 affected adipogenesis, 3T3-L1 degs1 KD cells were induced to differentiate. At day 9, degs1 KD cells showed impaired lipid accumulation versus controls (Fig. 3B). Moreover, pref1 mRNA expression, a marker for preadipocytes, was not decreased in degs1 KD cells at day 9, suggesting that a relevant number of cells remained in the preadipocyte stage (Fig. 3C). In addition, the expressions of proadipogenic and lipogenic genes were downregulated (Fig. 3D). Interestingly, treatment with rosiglitazone only partially improved the differentiation and lipid accumulation rates of degs1 KD cells (Supplementary Fig. 4A and B).
Figure 3.

A: mRNA expression of degs1 in 3T3-L1 cells during adipocyte differentiation. B: Lipid accumulation at day 9 of differentiation, Oil Red O staining. C: mRNA expression of PREF1 in WT and degs1 KD cells during differentiation. D: mRNA expression of genes involved in adipocyte differentiation and lipid accumulation. Values are the mean ± SEM of three separate experiments performed in triplicate. FAS, fatty acid synthase; Insig, insulin-induced gene; LPL, lipoprotein lipase. *P < 0.05.
We tested whether DEGS1 expression may affect the mitotic clonal expansion (MCE). In degs1 KD cells, pparγ and cebpβ were downregulated compared with controls at time 0 and 24 h following differentiation induction (Supplementary Fig. 5A and B). The expression of PPARγ and several cyclins involved in adipogenesis were measured at earlier time points. We noted a strong effect of degs1 depletion on PPARγ2 mRNA from time 0. Additionally, reduced levels of degs1 blocked MCE, as indicated by the inhibition of cyclin D1 and cdk2 expression between time 0 and 4 h after the induction (Supplementary Fig. 5A and B). Cyclin E and cyclin D3 expression was also inhibited, but at later time points.
Pharmacological Inhibition of DEGS1 Recapitulates DEGS1 KD Antiadipogenic Phenotype
Use of C8-CPPC, a selective inhibitor of DEGS1 (21) further confirmed the relevance of DEGS1 in adipogenesis. Similarly to degs1 KD cells, 3T3-L1 cells were induced to differentiate and were treated simultaneously with C8-CPPC from time 0 h every 6 h for 48 h. C8-CPPC decreased the expression of proadipogenic transcription factors such as PPARγ and C/EBPβ as well as lipogenic genes (Fig. 4A and C). The antiadipogenic effect of C8-CPPC persisted after rosiglitazone treatment (Fig. 4A and C). As expected, analysis of neutral lipids showed that 3T3-L1 cells treated with C8-CPPC for 96 h accumulated significantly less lipids compared with untreated cells (Fig. 4D).
Figure 4.

3T3-L1 cells treated with C8-CPPC and/or rosiglitazone. A and B: mRNA expression of genes involved in adipocyte differentiation and lipid accumulation at 24 and 48 h after induction. C: Protein expression levels of PPARγ2 and cEBPα. D: Lipid content after 48 and 96 h of differentiation. Values are the mean ± SEM of two separate experiments performed in triplicate. One-way ANOVA was used to analyze the statistical significance between treatments at 24 and 48 h. Significant differences (Duncan test, P < 0.05) are indicated with different letters. E: DhCer, Cer, and hexosylceramide (HexCer) levels after 48 h of differentiation. Values are the mean ± SEM of two separate experiments performed in triplicate. cEBP, CCAAT/enhancer binding protein; d, day; FITC, fluorescein isothiocyanate; MFI, mean fluorescence intensity; Rosi, rosiglitazone. *P < 0.05.
Pharmacological Inhibition of DEGS1 Also Impairs Adipocyte Differentiation In Vivo
We administered C8-CPPC intraperitoneally to mice fed an HFD for 5 weeks, an experimental protocol that is known to trigger adipocyte hyperplasia. Molecular analysis of the WAT from mice treated with C8-CPPC presented higher levels of pref-1+ cells, suggesting an increase in the number of preadipocytes compared with controls. Interestingly, a significant number of preadipocytes showed evidence of increased proliferation (Ki67+), whereas the number of differentiating preadipocytes (pref1+, BODIPY+) was significantly smaller in comparison with controls (Fig. 5A). These data were reinforced at the mRNA level by showing increased expression of pref-1 and gata2 (Fig. 5B), and the presence of fewer small adipocytes in treated mice (Supplementary Fig. 6). Altogether, these data suggest that C8-CPPC–mediated inhibition of DEGS1 impaired the capacity of preadipocytes to differentiate into adipocytes in vivo.
Figure 5.
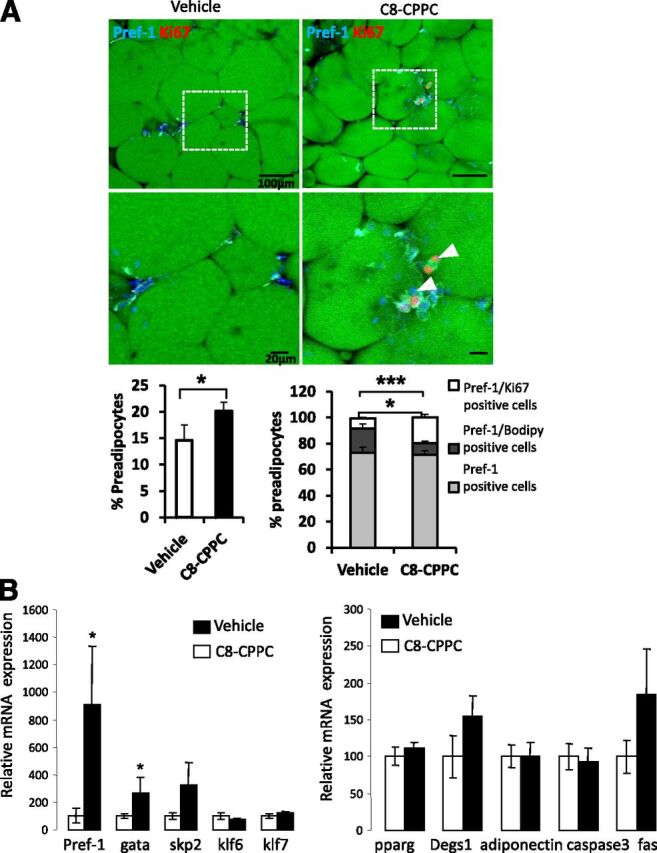
C8-CPPC inhibitor increases proliferation and decreases lipid accumulation in preadipocytes in vivo. Ten-week-old mice were given a 45% HFD for 5 weeks before being treated intraperitoneally with vehicle or C8-CPPC inhibitor (2 mg/kg/day) over 9 days. A: Representative images of immunofluorescence analysis of gonadal AT of control (vehicle) and C8-CPPC–treated mice are presented with Pref-1 (cyan) and Ki67 (red, white arrows). Nuclei and lipids are respectively stained with Hoechst stain (blue) and BODIPY (green). Scale bars: 100 or 20 μm. Quantification of preadipocytes (left graph) (percentage of Pref-1+ cells/total cells) and (right graph) Ki67+ (white bars)/BODIPY+ (dark gray bars) cells among preadipocytes (Pref-1+ cells) (light gray bars). B: mRNA expression of preadipocyte markers and pparg, degs1, adiponectin, caspase 3, and fas in gonadal AT of control and C8-CPPC–treated mice. n = 7–8 mice per experimental group. Values are the mean ±SEM. *P < 0.05, ***P < 0.0001 vs. vehicle.
DEGS1 Is Required for Lipid Accumulation, Basal Lipolysis, and Glucose Uptake in Mature Adipocytes
We next focused on the effects of DEGS1 inhibition in fully differentiated adipocytes by treating isolated mature adipocytes—from the gonadal WAT of C57BL/6 mice—with C8-CPPC for 24 h. C8-CPPC caused a decrease in the expression of lipid metabolism genes as well as an increase in antioxidant genes (Supplementary Fig. 7), recapitulating our observations in 3T3-L1 preadipocytes.
We further investigated the effects of inhibiting DEGS1 on lipolytic activity and insulin signaling, and measured adiponectin expression as a representative fingerprint of global adipocyte homeostasis in mature differentiated 3T3-L1 adipocytes. Thus, we observed that basal lipolytic activity was decreased in mature differentiated 3T3-L1 adipocytes when treated with C8-CPPC in nonstimulated conditions (Fig. 6A). Systematic evaluation of the lipolytic axis showed that, under basal conditions, phosphorylation of Ser565 was also substantially increased by C8-CPPC concomitantly with a minor downregulation of Ser660 phosphorylation (Fig. 6B–D), suggesting a decreased HSL activity. Moreover, total levels of HSL were also decreased in C8-CPPC–treated cells. These data suggest that pharmacological inhibition of DEGS1 in mature adipocytes disrupts the lipolytic response under nonstimulated conditions, a defect that was superseded in the presence of NE.
Figure 6.
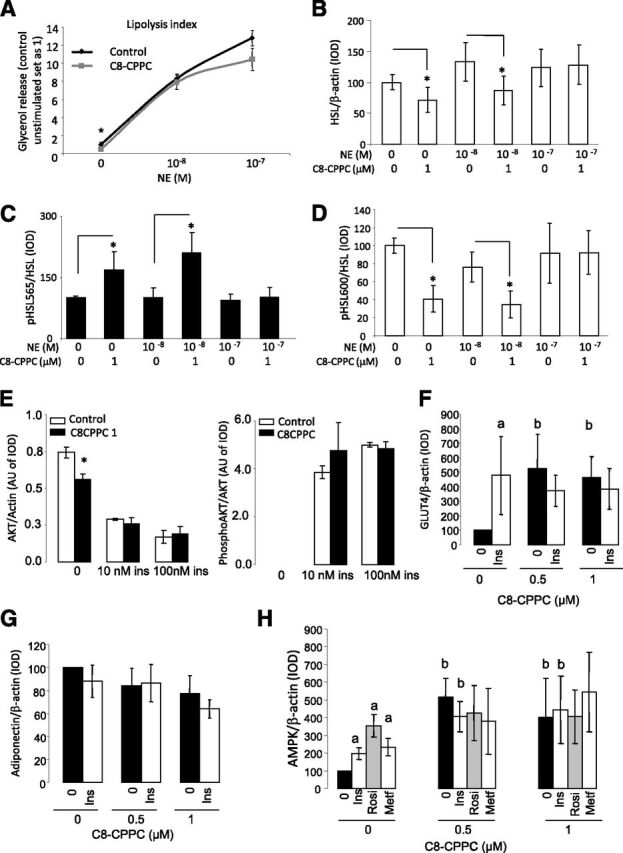
A: Glycerol release in 3T3-L1 adipocytes exposed for 48 h to C8-CPPC and stimulated with NE for 6 h. B–D: Results from Western blot analysis for phosphorylated (p) HSL/HSL ratio and total HSL in 3T3-L1 adipocytes exposed for 48 h to C8-CPPC and stimulated with NE for 6 h. Graphs show the mean ± SEM of two separated experiments: *P < 0.05. E: Effects of pharmacological inhibition of DEGS1 on insulin (ins) signaling. Results from Western blot analysis for p-AKT and AKT in 3T3-L1 adipocytes exposed 48 or 72 h with C8-CPPC 1 µmol/L and increased concentrations of insulin (10–100 nmol/L) for 15 min. F and G: Results from Western blot analysis for Glut4 and adiponectin in 3T3-L1 adipocytes exposed with C8-CPPC 0.5–1 µmol/L and insulin (100 nmol/L) for 48 h. H: Results from Western blot analysis for AMPK in 3T3-L1 adipocytes exposed to C8-CPPC 0.5–1 µmol/L and insulin (Ins) (100 nmol/L), rosiglitazone (Rosi) (1 nmol/L), and metformin (Metf) (100 nmol/L) for 48 h. aP < 0.05 vs. untreated cells (Ins, Rosi, or Metf effect); bP < 0.05 vs. 0 μmol/L C8-CPPC (C8-CPPC effect). AU, arbitrary units; IOD, integrated optical density.
Finally, we characterized the effects of pharmacological inhibition of DEGS1 on insulin signaling in 3T3-L1 mature adipocytes treated with C8-CPPC for 48 h, as described above, and subsequently incubated in the presence of increasing doses of insulin. No major differences were observed in the phosphorylation of AKT in C8-CPPC–treated cells after acute insulin stimulation (Fig. 6E). However, we found that Glut4 protein levels were increased in C8-CPPC–treated cells, suggesting that glucose uptake may be increased (Fig. 6F). Interestingly, we also did not observe any differences in either adiponectin levels in response to C8-CPPC or in AMPK phosphorylation, a known inducer of adiponectin, although increased levels of total AMPK were observed (Fig. 6G and H).
Pharmacological and Genetic Inhibition of DEGS1 Increases DhCer/Cer Ratio in 3T3-L1 Cells
We confirmed that C8-CPPC increased the DhCer/Cer ratio in 3T3L-1 preadipocytes upon the inhibition of DEGS1 (Fig. 4E). Similarly, degs1 KD preadipocytes (day 0) exhibited an increased DhCer/Cer ratio versus controls (Supplementary Fig. 8A). Downregulation of degs1 expression in degs1 KD cells was accompanied by a downregulation of serine palmitoyltransferase (sptlc1) and Cer synthase 6 (Cers6) (Supplementary Fig. 8A), suggestive of a homeostatic readjustment of the biosynthetic pathway to compensate for the dysfunction of degs1. Other genes related to Cer homeostasis such as neutral ceramidase (ncdase) and glycosylceramide synthase (gcs) were also downregulated.
Curiously, at day 9, degs1 KD cells, despite impaired differentiation, showed a complete restoration of the DhCer/Cer ratio (indicated by the normalization of the Cer pool) (Supplementary Fig. 8B). This could be partially explained by a compensation mechanism, mediated by downregulation of neutral ceramidases and the conversion of sphyngomyelins to Cers (upregulation of sphyngomyelinase 2) (Supplementary Fig. 8B).
The Impairment of Adipocyte Differentiation During Early Adipogenesis by DEGS1 Inhibition Is Recapitulated by DhCers Per Se
We finally sought to validate whether DhCer by itself could mediate the effects of DEGS1 inhibition on adipocyte differentiation in our models of genetic or pharmacological inhibition of degs1. 3T3-L1cells were treated with C2DhCer during 1) the MCE at time 0 and 2) at day 3 after differentiation. DhCer inhibited lipid accumulation (Fig. 7A) and the expression of genes involved during the early stages of adipogenesis (Fig. 7B).
Figure 7.

A and B: DhCers impair adipocyte differentiation during early adipogenesis. 3T3-L1 preadipocytes treated with C2DhCer (50 µmol/L) for a period of 48 h at day 0 or day 3 of differentiation. Oil Red O staining and mRNA expression of adipogenesis and lipid metabolism genes. Values are the mean ± SEM of two separate experiments performed in triplicate. *P < 0.05 vs. control. C: DhCers decrease ligand-mediated PPARγ transactivation. Cells were treated with DMSO as a control group and rosiglitazone 10 μmol/L, GW1929 10 μmol/L, and C2 and C16DhCers and Cers 100 μmol/L as indicated. Graphs represent the average of three independent experiments. *P < 0.05 vs. control cells; #P < 0.05 vs. rosiglitazone; &P < 0.05 vs. GW1929. CTL, control.
Since synthetic sphingolipid analogs are known to modulate PPAR activity (22), we investigated whether both C2DhCer and C16DhCer could exert a repressive effect on PPARγ activation in the presence of the PPARγ ligands (Fig. 7C). Our results show that DhCer can also block the ligand-mediated transactivation of PPARγ. Similar results were obtained with Cers, indicating that these effects were not a consequence of the unsaturation of the sphingoid moiety (data not shown).
Discussion
The DhCer/Cer ratio has an important homeostatic regulatory role in the cell, contributing to cell survival, autophagy, and oxidative stress (12,13). Here we identify DEGS1 as an essential metabolic enzyme, which is dysregulated in obese states and contributes to AT dysfunction. Our complementary in vitro and in vivo approaches reveal that reduced DEGS1 function impairs adipogenesis and lipogenesis programs, and increases oxidative stress.
DEGS1 is expressed in WAT and correlates in rodents with fat mass in healthy states, an association that is disrupted in severe forms of obesity. The expression of DEGS1 in liver or muscle is not affected by obesity, further indicating that the WAT is particularly susceptible to changes in Cer metabolism in obese states. The relevance to human obesity is confirmed by the downregulation of DEGS1 in the AT of MO patients, and by recent reports (23,24) showing that DhCer rather than Cer content positively correlates with BMI and waist circumference in cohorts of overweight obese subjects. To date, only a single functional mutation in the degs1 gene has been reported in humans, where patients demonstrate increased serum DhCer, decreased cholesterol esters, and decreased waist-to-hip ratio (25). Globally considered, these data suggest the existence of an association between DEGS1 function and fat mass.
The molecular mechanism leading to the defective AT expression of degs1 in human and rodent obesity is unknown. Here, we have shown that tumor necrosis factor-α, a mediator of obesity-induced inflammation and insulin resistance, decreases the transcriptional expression of degs1 in cultured adipocytes, which suggests that low chronic inflammation may contribute to DEGS1 dysfunction. Other obesity-associated processes, such as increased oxidative stress and hypoxia, have been shown to impair DEGS1 activity and increase DhCer levels (26). Our results also show a positive association between levels of the proadipogenic pparγ2 isoform and degs1 in AT, and, given the documented downregulation of pparγ2 in AT in obese insulin-resistant states, it is conceivable that decreased levels of pparγ2 may contribute to the defective expression of degs1 associated with obesity.
Studies in rodents have shown that the number of Cers is increased in the WAT of animals fed an HFD (5) concomitantly with the onset of insulin resistance (6). Results from ob/ob mice and obese human studies are more unclear, where both increased or decreased levels of Cers have been reported (7,8). This suggests that Cer synthesis may be dependent on the severity of the obese state and the strength of the adaptive homeostatic responses attempting to restore their normal balance.
Our pharmacological and gene ablation studies have shown that inhibition of DEGS1 is associated with oxidative stress, cellular death, impaired adipocyte differentiation, impaired lipid accumulation, and impaired basal lipolysis in mature adipocytes.
Our in vitro studies revealed that the defect in the adipogenesis program caused by depletion of DEGS1 occurs during the early stages of adipogenesis (MCE) when PPARγ controls the expression of genes that regulate the cell cycle by directly interacting with cyclin D3. Another cyclin involved in adipocyte differentiation is cyclin D1, and here we show that downregulation of DEGS1 blocks PPARγ activity and cyclins such as D1, D3, E, as well as decreasing cdk2, which modulates PPARγ activity during adipogenesis. These data are consistent with studies showing that downregulation of degs1 by small interfering RNA inhibits cell growth and arrests the cell cycle in cancer cells (12) and where its overexpression increased cell migration and metastasis (27).
The pharmacological inhibition of DEGS1 in vivo validated the results obtained in vitro and strengthened the concept that functional degs1 is required for the full differentiation of preadipocytes into mature adipocytes.
We also provide evidence that both pharmacological and genetic ablation of degs1, which, according to our results in in vitro models, may directly block adipocyte differentiation and lipid deposition, certainly increased DhCer levels in in vitro models. In this line, our results showed that the treatment of adipocytes with DhCer causes impaired adipogenesis and lipid accumulation. This effect on lipid accumulation was more severe when the treatment was administered during the first 3 days of differentiation, suggesting a direct impact of DhCer accumulation during early stages of adipogenesis. We also provide evidence showing that accumulation of DhCers can also directly repress the transcriptional activity of PPARγ and hence could contribute to impairment of the capacity of the preadipocytes to develop a full adipogenic program.
These observations strengthen the concept that DhCers are not merely inert precursors of Cers. Nevertheless, the molecular mechanism linking DhCers accumulation and dysregulation of the cell cycle and other cellular events remains elusive. One possible mechanism is that changes in the DhCer/Cer ratio may disrupt membrane-dependent structures by altering the levels of cholesterol and/or caveolin in lipid rafts, which are known to be highly sensitive to a sphingomyelin pool. Alternatively, changes in the DhCer/Cer ratio may disturb the global phospholipidome, potentially altering membrane-associated processes relevant to adipocyte function. These are important questions to address in future research.
In summary, our results indicate that defects in DEGS1 in the context of the metabolic syndrome may compromise AT expansion and function through the combined inhibition of adipogenesis, promotion of cell death, and oxidative stress due to the direct accumulation of DhCers. Thus, our data suggest that the selective manipulation of DEGS1 and/or its substrates in WAT may be a pathophysiologically advantageous strategy to improve AT homeostasis and ameliorate the burden of obesity-associated metabolic complications.
Supplementary Material
Article Information
Acknowledgments. The authors thank Dr. Carobbio, Mrs. Peirce, and Ms. Philips (Wellcome Trust-Medical Research Council Institute of Metabolic Science, University of Cambridge, U.K.) for their excellent technical advice, support, and suggestions.
Funding. This work was funded by the Medical Research Council (MRC), the Metabolic Diseases Unit of the MRC, European Commissionhttp://dx.doi.org/10.13039/501100000780 grant FP7-ETHERPATHS, and the British Heart Foundationhttp://dx.doi.org/10.13039/501100000274.
Duality of Interest. No potential conflicts of interest relevant to this article were reported.
Author Contributions. N.B. helped to develop the hypothesis, design the experiments, perform the in vitro and ex vivo experiments, collect and analyze the data, hold and characterize the human cohorts, collect gene expression data from adipose depots and analyze the data, discuss the manuscript, coordinate and direct the project, and write the manuscript. S.R.-C. helped to develop the hypothesis, design the experiments, perform the in vitro and ex vivo experiments, collect and analyze the data, discuss the manuscript, coordinate and direct the project, and write the manuscript. H.N. and M.O. helped to develop analytical platforms, perform and analyze lipidomic experiments, and discuss the manuscript. A.C., A.P., J.R., I.C., V.P., G.M.-G., and C.L.-P. helped to perform the in vitro and ex vivo experiments, collect and analyze the data, and discuss the manuscript. F.J.T. helped to hold and characterize the human cohorts, collect gene expression data from adipose depots and analyze the data, and discuss the manuscript. J.D.S. and S.A.S. helped to design the experiments and discuss the manuscript. A.V.-P. helped to develop the hypothesis, design the experiments, discuss the manuscript, coordinate and direct the project, and write the manuscript. A.V.-P. is the guarantor of this work and, as such, had full access to all the data in the study and takes responsibility for the integrity of the data and the accuracy of the data analysis.
Footnotes
G.M.-G. is currently affiliated with Departamento de Bioquímica, Fisiología y Genética Molecular, Universidad Rey Juan Carlos, Madrid, Spain.
References
- 1.Montague CT, O’Rahilly S. The perils of portliness: causes and consequences of visceral adiposity. Diabetes 2000;49:883–888 [DOI] [PubMed] [Google Scholar]
- 2.Carobbio S, Rodriguez-Cuenca S, Vidal-Puig A. Origins of metabolic complications in obesity: ectopic fat accumulation. The importance of the qualitative aspect of lipotoxicity. Curr Opin Clin Nutr Metab Care 2011;14:520–526 [DOI] [PubMed] [Google Scholar]
- 3.Chavez JA, Summers SA. Lipid oversupply, selective insulin resistance, and lipotoxicity: molecular mechanisms. Biochim Biophys Acta 2010;1801:252–265 [DOI] [PMC free article] [PubMed] [Google Scholar]
- 4.Chavez JA, Summers SA. A ceramide-centric view of insulin resistance. Cell Metab 2012;15:585–594 [DOI] [PubMed] [Google Scholar]
- 5.Shah C, Yang G, Lee I, Bielawski J, Hannun YA, Samad F. Protection from high fat diet-induced increase in ceramide in mice lacking plasminogen activator inhibitor 1. J Biol Chem 2008;283:13538–13548 [DOI] [PMC free article] [PubMed] [Google Scholar]
- 6.Turner N, Kowalski GM, Leslie SJ, et al. Distinct patterns of tissue-specific lipid accumulation during the induction of insulin resistance in mice by high-fat feeding. Diabetologia 2013;56:1638–1648 [DOI] [PubMed] [Google Scholar]
- 7.Blachnio-Zabielska AU, Koutsari C, Tchkonia T, Jensen MD. Sphingolipid content of human adipose tissue: relationship to adiponectin and insulin resistance. Obesity (Silver Spring) 2012;20:2341–2347 [DOI] [PMC free article] [PubMed] [Google Scholar]
- 8.Błachnio-Zabielska AU, Pułka M, Baranowski M, et al. Ceramide metabolism is affected by obesity and diabetes in human adipose tissue. J Cell Physiol 2012;227:550–557 [DOI] [PubMed] [Google Scholar]
- 9.Ternes P, Franke S, Zähringer U, Sperling P, Heinz E. Identification and characterization of a sphingolipid delta 4-desaturase family. J Biol Chem 2002;277:25512–25518 [DOI] [PubMed] [Google Scholar]
- 10.Mizutani Y, Kihara A, Igarashi Y. Identification of the human sphingolipid C4-hydroxylase, hDES2, and its up-regulation during keratinocyte differentiation. FEBS Lett 2004;563:93–97 [DOI] [PubMed] [Google Scholar]
- 11.Ahn EH, Schroeder JJ. Induction of apoptosis by sphingosine, sphinganine, and C(2)-ceramide in human colon cancer cells, but not by C(2)-dihydroceramide. Anticancer Res 2010;30:2881–2884 [PubMed] [Google Scholar]
- 12.Kraveka JM, Li L, Szulc ZM, et al. Involvement of dihydroceramide desaturase in cell cycle progression in human neuroblastoma cells. J Biol Chem 2007;282:16718–16728 [DOI] [PMC free article] [PubMed] [Google Scholar]
- 13.Siddique MM, Li Y, Wang L, et al. Ablation of dihydroceramide desaturase 1, a therapeutic target for the treatment of metabolic diseases, simultaneously stimulates anabolic and catabolic signaling. Mol Cell Biol 2013;33:2353–2369 [DOI] [PMC free article] [PubMed] [Google Scholar]
- 14.Parks BW, Nam E, Org E, et al. Genetic control of obesity and gut microbiota composition in response to high-fat, high-sucrose diet in mice. Cell Metab 2013;17:141–152 [DOI] [PMC free article] [PubMed] [Google Scholar]
- 15.Bikman BT, Guan Y, Shui G, et al. Fenretinide prevents lipid-induced insulin resistance by blocking ceramide biosynthesis. J Biol Chem 2012;287:17426–17437 [DOI] [PMC free article] [PubMed] [Google Scholar]
- 16.Medina-Gomez G, Gray SL, Yetukuri L, et al. PPAR gamma 2 prevents lipotoxicity by controlling adipose tissue expandability and peripheral lipid metabolism. PLoS Genet 2007;3:e64. [DOI] [PMC free article] [PubMed] [Google Scholar]
- 17.Roberts LD, Virtue S, Vidal-Puig A, Nicholls AW, Griffin JL. Metabolic phenotyping of a model of adipocyte differentiation. Physiol Genomics 2009;39:109–119 [DOI] [PMC free article] [PubMed] [Google Scholar]
- 18.Ramírez-Zacarías JL, Castro-Muñozledo F, Kuri-Harcuch W. Quantitation of adipose conversion and triglycerides by staining intracytoplasmic lipids with Oil red O. Histochemistry 1992;97:493–497 [DOI] [PubMed] [Google Scholar]
- 19.Ye J, Coulouris G, Zaretskaya I, Cutcutache I, Rozen S, Madden TL. Primer-BLAST: a tool to design target-specific primers for polymerase chain reaction. BMC Bioinformatics 2012;13:134. [DOI] [PMC free article] [PubMed] [Google Scholar]
- 20.Pfaffl MW, Tichopad A, Prgomet C, Neuvians TP. Determination of stable housekeeping genes, differentially regulated target genes and sample integrity: BestKeeper—Excel-based tool using pair-wise correlations. Biotechnol Lett 2004;26:509–515 [DOI] [PubMed] [Google Scholar]
- 21.Triola G, Fabriàs G, Llebaria A. Synthesis of a cyclopropene analogue of ceramide, a potent inhibitor of dihydroceramide desaturase. Angew Chem Int Ed Engl 2001;40:1960–1962 [PubMed] [Google Scholar]
- 22.Tsuji K, Satoh S, Mitsutake S, et al. Evaluation of synthetic sphingolipid analogs as ligands for peroxisome proliferator-activated receptors. Bioorg Med Chem Lett 2009;19:1643–1646 [DOI] [PubMed] [Google Scholar]
- 23.Mamtani M, Meikle PJ, Kulkarni H, et al. Plasma dihydroceramide species associate with waist circumference in Mexican American families. Obesity (Silver Spring) 2014;22:950–956 [DOI] [PMC free article] [PubMed] [Google Scholar]
- 24.Weir JM, Wong G, Barlow CK, et al. Plasma lipid profiling in a large population-based cohort. J Lipid Res 2013;54:2898–2908 [DOI] [PMC free article] [PubMed] [Google Scholar]
- 25.Curran J, Meikle P, Weir J, Jowett J. Deep sequencing in extended pedigrees reveals a major rare non-synonymous variant influencing the de novo ceramide synthesis pathway. Late-breaking abstract presented at the American Society of Human Genetics 2013 Meeting, 22–26 October 2013, at the Boston Convention and Exhibition Center, Boston, Massachusetts [Google Scholar]
- 26.Idkowiak-Baldys J, Takemoto JY, Grilley MM. Structure-function studies of yeast C-4 sphingolipid long chain base hydroxylase. Biochim Biophys Acta 2003;1618:17–24 [DOI] [PubMed] [Google Scholar]
- 27.Zhou W, Ye XL, Sun ZJ, Ji XD, Chen HX, Xie D. Overexpression of degenerative spermatocyte homolog 1 up-regulates the expression of cyclin D1 and enhances metastatic efficiency in esophageal carcinoma Eca109 cells. Mol Carcinog 2009;48:886–894 [DOI] [PubMed] [Google Scholar]
Associated Data
This section collects any data citations, data availability statements, or supplementary materials included in this article.