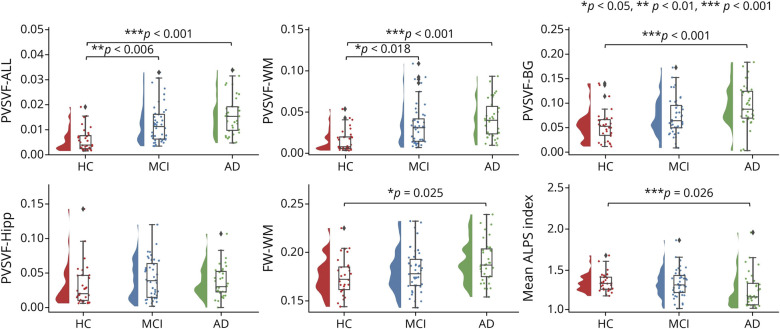
Figure 4. Between-Group Differences in MRI Measurements.
Shown are violin and box plots of the mean ALPS index, PVSVF-ALL, PVSVF-WM, PVSVF-BG, PVSVF-Hipp, and FW-WM among the healthy control (HC) participants, patients with MCI, and patients with Alzheimer disease. The p values correspond to the general linear model analysis. Statistical significance was set at p < 0.05.

