Abstract
Human transcription factor Sp1 contains three contiguous repeats of the C2H2-type zinc finger motif and binds to the decanucleotide sequence 5′-(G/T)GGGCGG(G/A)(G/A)(C/T)-3′ (GC box). In order to determine whether the three-zinc finger peptide Sp1(530–623) has selectivity for sequence outside the GC box, we used a selection and amplification of binding experiment. The high affinity sequence generated from this selection is 5′-GGGTGGGCGTGGC-3′ (s-GC box), which is flanked by a novel conserved guanine triplet on the 5′-side of the core decanucleotide. Gel mobility shift assays reveal that Sp1(530–623) binds to the s-GC box with 2.3-fold higher affinity than to the wild-type GC box, 5′-GGGGCGGGGC-3′ (c-GC box). DNase I and hydroxyl radical footprinting analyses show that the area of the s-GC box protected by binding of Sp1(530–623) is wider by 1 nt than that of the c-GC box. On the other hand, alkylation interference analyses demonstrate that Sp1(530–623) forms only one special base contact at the guanine triplet. With respect to cleavage of the c-GC and s-GC boxes by the 1,10-phenanthroline–copper complex (OP-Cu), binding of Sp1(530–623) has no effect on the cleavage pattern of the s-GC box, whereas OP-Cu actually enhances cleavage of the c-GC box. Additionally, the extent of cleavage of the s-GC box by DNase I and OP-Cu is clearly different from that of the c-GC box under peptide-free conditions. The results strongly indicate that: (i) the conformation of the s-GC box is evidently distinct from that of the c-GC box; (ii) Sp1(530–623) binds to the s-GC box without induction of a conformational change in DNA detectable by cleavage with OP-Cu. The present study provides useful information for the design of multi-zinc finger proteins with various sequence specificities.
INTRODUCTION
A zinc finger motif of the C2H2 type is one of the most general DNA-binding motifs found in eukaryotes and has a tandemly repeated structure consisting of independent modules with the consensus sequence (Tyr, Phe)-X-Cys-X2,4-Cys-X3-Phe-X5-Leu-X2-His-X3–5-His-X2–6. Each finger domain forms a compact globular ββα structure by tetrahedral binding of a zinc ion to invariant cysteines and histidines and binds to a 3 bp subsite with the amino acid residues at key positions in the α-helix (1). Based on the characteristic DNA binding mode, zinc fingers with various sequence specificities have been designed by the phage display strategy (2–5). Moreover, it is expected that multiple connection of the designed zinc fingers could lead to the construction of zinc finger proteins with specificities for any DNA sequence with respect to length and base composition. In the design of such zinc fingers, therefore, useful information may be afforded for appropriate selection of a second finger by examining the selectivity of the first zinc finger for sequence outside the target site.
Transcription factor Sp1 is a zinc finger protein isolated from human HeLa cell extracts (6). Sp1 has three zinc fingers of the C2H2 type as a DNA-binding domain in the C-terminal region and activates transcription of these genes by RNA polymerase II by binding to proximal promoter sequences of various cellular and viral genes (7,8). The binding site of Sp1 has been known to be a ‘GC box’, with the consensus sequence 5′-(G/T)GGGCGG(G/A)(G/A)(C/T)-3′ (9). In some promoter sequences the GC box is often arranged as a tandemly repeated array and Sp1 binds to such a sequence with cooperative bending of the DNA (8,10). Moreover, Sp1 forms a multimer and activates transcription with a high degree of synergism in binding to a sequence bearing multiple GC boxes (11). Consequently, it would be useful for an understanding of this cooperativity and synergism to examine the selectivity of Sp1 for the sequence outside a single GC box.
Herein, we have investigated the selectivity of the zinc finger of Sp1 for sequence outside the GC box by a selection and amplification of binding (SAAB) experiment. The results of gel mobility shift assays revealed that the affinity of the zinc finger peptide for the selected GC-box sequence, 5′-GGGTGGGCGTGGC-3′, is 2.3-fold higher than that for the wild-type sequence. Several footprinting and interference experiments clarified that the selectivity for the sequence is attributable to a suitable conformation of the DNA sequence for binding of Sp1(530–623).
MATERIALS AND METHODS
Chemicals
T4 polynucleotide kinase and restriction enzymes were purchased from New England Biolabs. Enzymes and synthesized oligonucleotides for random selection of binding sites were acquired from Applied Biosystems and Amersham Pharmacia Biotech, respectively. Labeled [γ-32P]ATP was supplied by DuPont. The plasmid pBS-Sp1-fl was kindly provided by Dr R. Tjian. All other chemicals were of commercial reagent grade.
Preparation of the three-zinc finger domain of Sp1
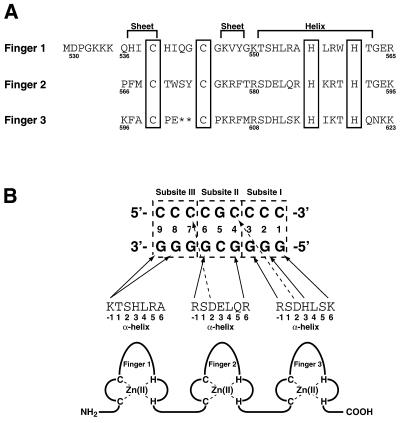
Sp1(530–623), which contains the three-zinc finger domain of Sp1, was prepared as described previously (12,13; Fig. 1).
Figure 1.
(A) Primary sequence of Sp1(530–623). The numerals indicate the positions of the amino acids in native Sp1. The cysteines and histidines for zinc binding are boxed. (B) Putative base recognition mode of Sp1(530–623). The GC box sequence, which is divided into subsites I–III, is shown with numbering in the 5′→3′ direction on the guanine-rich strand.
Selection and amplification of binding (SAAB) experiment
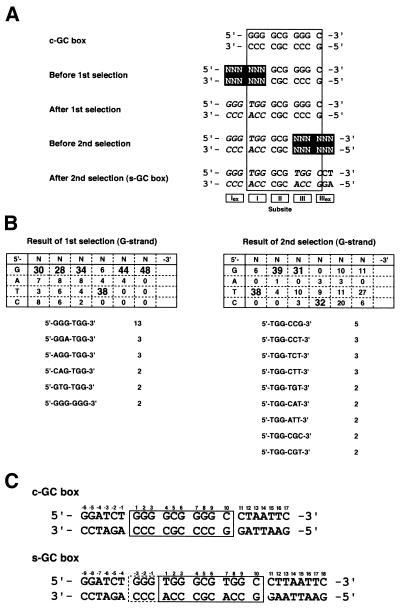
The SAAB assay was performed according to a previously reported procedure, with minor modifications (14; Fig. 2A). We initially randomized the sequence of the 5′-portion of the GC box in the guanine-rich strand (G strand). A 68mer synthetic oligonucleotide which included the target sequence 5′-NNN NNN GCG GGG C-3′ flanked by XbaI and HindIII restriction sites was amplified by PCR with a set of primers. The fragment was incubated with Sp1(530–623) in a buffer containing 89 mM Tris, 89 mM boric acid and 5% glycerol at 20°C for 30 min. The reactions were loaded onto a 10% non-denaturing polyacrylamide gel in a buffer containing 89 mM Tris and 89 mM boric acid. After electrophoresis, the protein–DNA complex band was visualized by ethidium fluorescence and cut out from the gel. Following elution of the bound DNA from the gel, the DNA was amplified again as described above. This cycle was repeated five times and the resultant DNA fragment was digested with XbaI and HindIII followed by cloning into pBluescript SK+. The DNA sequences of 40–50 clones were determined using an ABI Prism 377 DNA sequencer, and sequence selectivity was examined using the χ2 test. On the basis of the results, secondary randomization in the 3′-portion of the GC box in the G strand was carried out in the same manner as described above. One of the clones used for sequence analyses after the second selection, which contains the sequence 5′-GGG TGG GCG TGG C-3′, was designated pBSsGC.
Figure 2.
(A) DNA sequences in the SAAB experiment. The sequences are divided into five subsites, Iex to IIIex. Randomized regions and the bases highly selected by peptide binding are highlighted and italicized, respectively. (B) The results of SAAB with two selection steps. The bases that have selectivity relative to neighboring bases are in large font in the table. The numbers of the selected sequences are shown below the table. (C) The sequences of the c-GC and s-GC boxes. Relative positions of the bases are indicated by numerals.
Gel mobility shift assays
Gel mobility shift assays were carried out under the following conditions. pBSGC (13) and pBSsGC were utilized as the substrate DNAs. Each reaction mixture contained 89 mM Tris, 89 mM boric acid, 100 ng/µl poly(dI·dC), 5% glycerol, the 32P-end-labeled substrate DNA fragment (∼50 pM) and 0–2000 nM Sp1(530–623). After incubation at 20°C for 30 min, the sample was run on a 10% polyacrylamide gel with Tris–borate buffer. The bands were visualized by autoradiography and quantified with ImageQuant software (v.5.1). The dissociation constants (Kd) of the Sp1(530–623)–DNA fragment complexes were estimated as described previously (13).
DNase I footprinting analyses
DNase I footprinting experiments were performed according to the method of Brenowitz et al. (15). The binding reaction mixture contained 20 mM Tris–HCl pH 8.0, 5 mM CaCl2, 10 mM MgCl2, 20 ng/µl sonicated calf thymus DNA, the 5′-end-labeled BssHII–SacI or BssHII–KpnI substrate DNA fragment of pBSGC or pBSsGC (∼15 000 c.p.m.) and 0–2 µM peptide. After incubation at 20°C for 30 min, the sample was digested with DNase I (0.7 mU/µl) at 20°C for 2 min. The reaction was stopped by addition of 30 µl of DNase I stop solution (0.1 M EDTA and 0.6 M sodium acetate) and 50 µl of phenol/chloroform. After ethanol precipitation, the cleavage products were analyzed on a 15% polyacrylamide–7 M urea sequencing gel. The bands were visualized by autoradiography and quantified with ImageQuant software (v.5.1).
Hydroxyl radical footprinting analyses
Hydroxyl radical footprinting experiments were carried out according to the method reported by Tullius et al. (16). The binding reaction mixture contained 20 ng/µl sonicated calf thymus DNA, the 5′-end-labeled BssHII–SacI or BssHII–KpnI substrate DNA fragment of pBSGC or pBSsGC (∼15 000 c.p.m.) and 0–2 µM peptide. After incubation at 20°C for 30 min, the sample was cleaved by addition of 100 µM ferrous ammonium sulfate, 200 µM EDTA and 0.003% hydrogen peroxide at 20°C for 1 min. The reaction was quenched by adding 20 µl of hydroxyl radical stop solution (0.135 M thiourea, 0.135 M EDTA and 0.6 M sodium acetate). After phenol extraction and ethanol precipitation, the cleavage products were analyzed on a 15% polyacrylamide–7 M urea sequencing gel. The bands were visualized by autoradiography and quantified with ImageQuant software (v.5.1).
Alkylation interference analyses
Alkylation interference assays were carried out as described previously (17). The binding reaction mixture contained 40 mM Tris, 40 mM acetic acid, 20 ng/µl sonicated calf thymus DNA, 5% glycerol, the 32P-end-labeled methylated or ethylated DNA fragment of pBSGC or pBSsGC (∼500 000 c.p.m.) and 0.6 µM Sp1(530–623). After incubation at 20°C for 30 min, the peptide-bound and free DNAs were separated on a 10% non-denaturing polyacrylamide gel and eluted from the gel with a standard elution buffer. To examine both the strong and weak base contacts in the alkylation interference experiments, we selected experimental conditions under which the peptide/DNA molar ratio in the binding reaction was ∼10–20% bound. The recovered methylated and ethylated DNAs were reacted in 100 µl of 1 M piperidine and in 35 µl of 30 mM sodium hydroxide at 90°C for 30 min, respectively. The lyophilized cleavage products were analyzed on a 15% polyacrylamide–7 M urea sequencing gel. The bands were visualized by autoradiography and quantified with ImageQuant software (v.5.1).
1,10-Phenanthroline–Cu(I) complex (OP-Cu) footprinting analyses
The footprinting experiments with OP-Cu were carried out according to the method of Sigman et al. (18). The binding reaction mixture contained 20 ng/µl sonicated calf thymus DNA, the 5′-end-labeled BssHII–SacI or BssHII–KpnI substrate DNA fragment of pBSGC or pBSsGC (∼15 000 c.p.m.) and 0–2 µM peptide. After incubation at 20°C for 30 min, the sample was cleaved by addition of 200 µM 1,10-phenanthroline, 45 µM copper(II) sulfate and 5.8 mM 3-mercaptopropionic acid at 20°C for 1 min. The reaction was terminated by adding 1 µl of 45 mM 2,9-dimethyl-1,10-phenanthroline. After phenol extraction and ethanol precipitation, the cleavage products were analyzed on a 15% polyacrylamide–7 M urea sequencing gel. The bands were visualized by autoradiography and quantified with ImageQuant software (v.5.1).
RESULTS
Optimization of the sequence adjacent to the GC box by SAAB
The putative base recognition mode of the three-zinc finger domain of Sp1 is shown in Figure 1 (13). In order to analyze the preference of Sp1(530–623) for sequence outside the GC box in DNA binding, we carried out a SAAB experiment on the basis of the recognition mode. As described in Figure 2A, two 6 bp sites, subsites Iex+I and III+IIIex, were sequentially randomized. Figure 2B shows the results. The sequence selectivity was high at bases within the core 9 bp sequence. 5′-TGG-3′ was selected at subsites I and III with high specificity in the G strand. Conservation of thymine at position 7 has been observed in a Sp1-binding site in a retrovirus promoter (19), whereas that of thymine at position 1 is included in the consensus sequence of the GC box (9). The sequence 5′-GGG-3′ was also highly conserved at subsite Iex in the G strand. Of 48 clones of which the sequences were analyzed after the first selection, 13 contained the sequence 5′-GGGTGG-3′ at subsite Iex+I. In contrast, the sequence at subsite IIIex was poorly conserved. Although the base next to the 3′-end of the core sequence in the G strand was well-conserved as cytosine, in analogy with the consensus sequence of the GC box, no selectivity was observed at the remaining two bases in subsite IIIex when considering the raw sequence of each clone. After the two-step selection, the most selected sequence of the target DNA was 5′-GGG TGG GCG TGG C-3′. Analysis by the χ2 test supported this result. The previous and selected target sequences for Sp1 were renamed the classical GC box (c-GC box, 5′-GGG GCG GGG C-3′) and the selected GC box (s-GC box, 5′-GGG TGG GCG TGG C-3′), respectively (Fig. 2C).
Evaluation of the DNA binding affinity of Sp1(530–623) for the c-GC and s-GC boxes
The dissociation constants (Kd) of Sp1(530–623) with the c-GC and s-GC boxes were determined by gel mobility shift assay. For binding to the s-GC box the Kd value of Sp1(530–623) was 19.9 nM. On the other hand, Sp1(530–623) bound to the c-GC box with an affinity of 46.6 nM. Thus, Sp1(530–623) binds to the s-GC box with 2.3-fold higher affinity than to the c-GC box. The difference in affinity was reproducible. It can therefore be presumed that (i) the number of contacts in the Sp1(530–623)–s-GC box complex is greater than that in the Sp1(530–623)–c-GC box and/or (ii) the conformational changes in DNA and/or the peptide are induced more easily in the complex of Sp1(530–623) with the s-GC box than in that with the c-GC box.
Analysis of the peptide-bound region by DNase I and hydroxyl radical footprinting
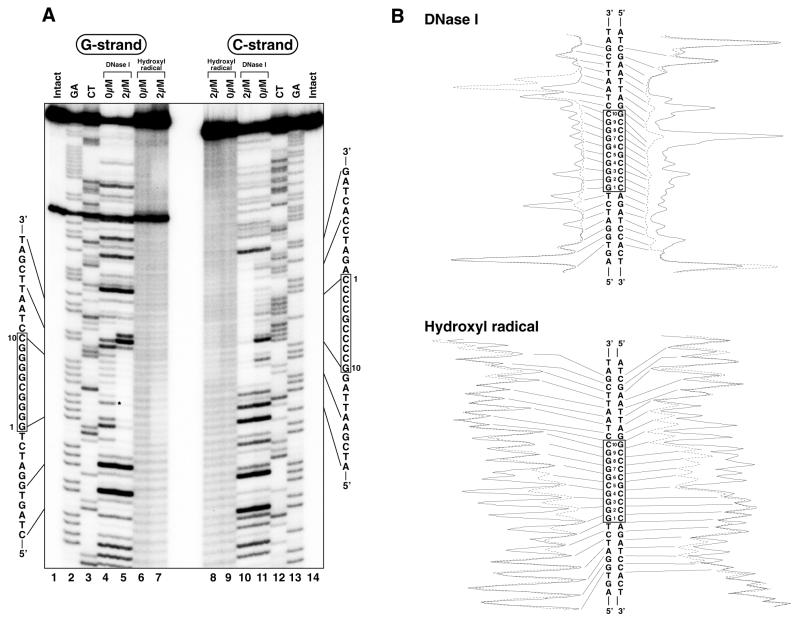
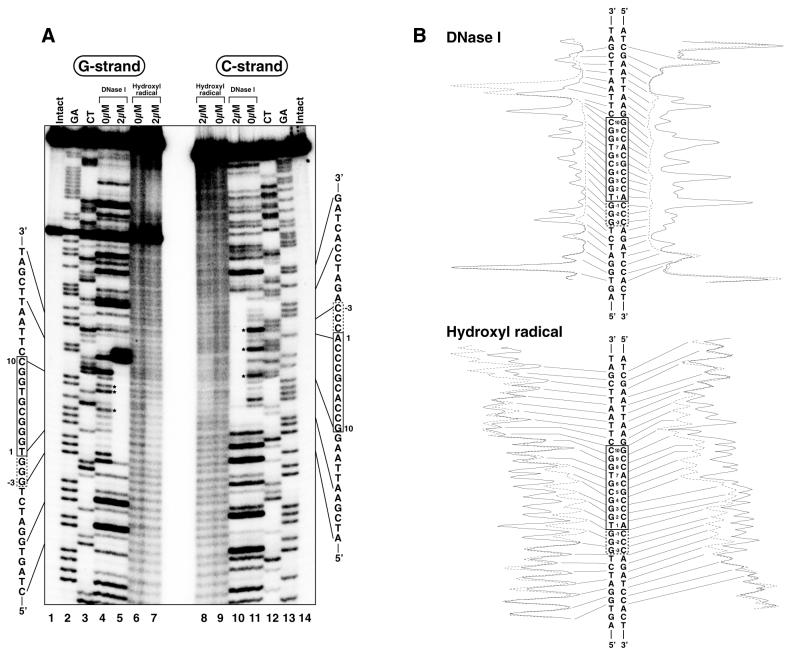
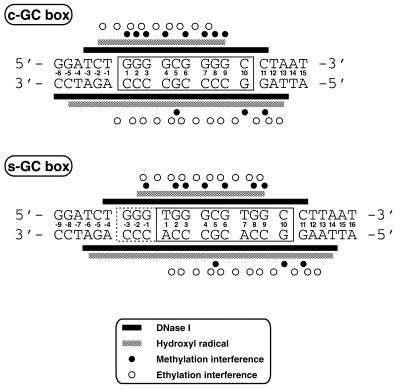
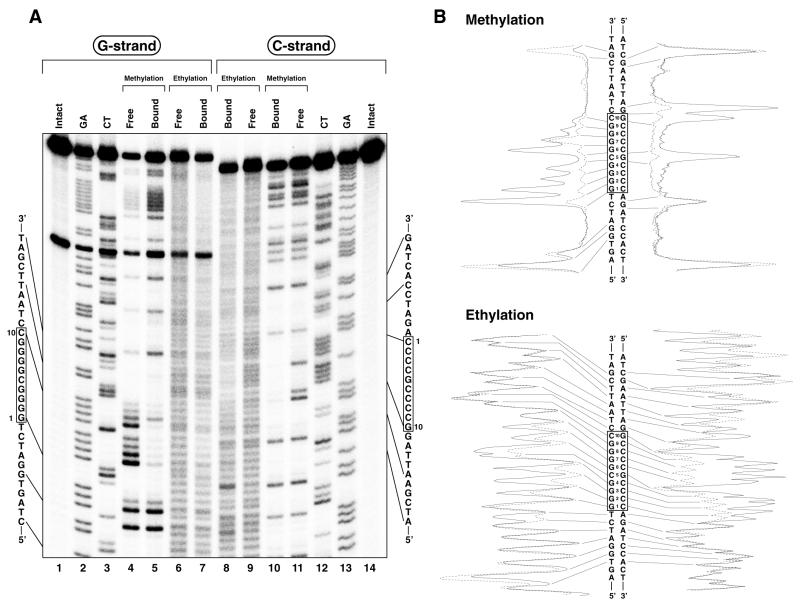
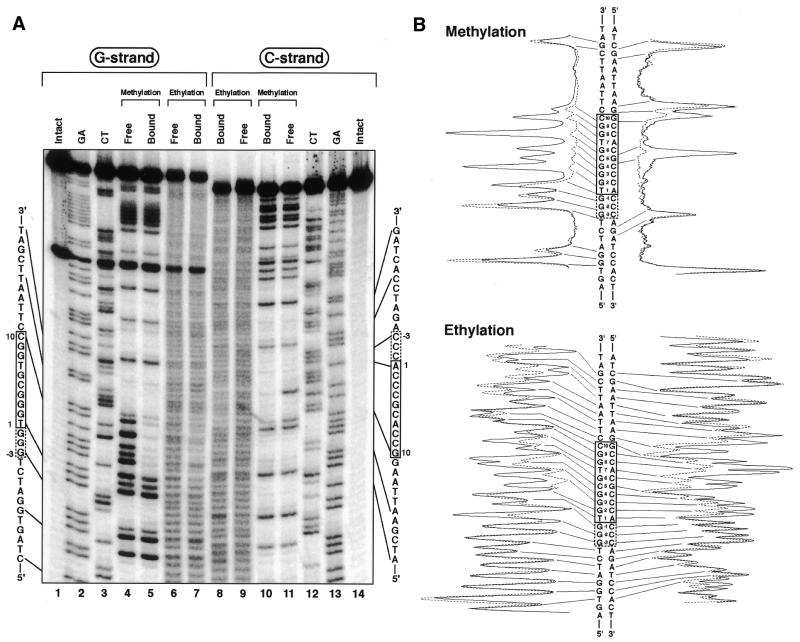
The binding region of Sp1(530–623) in the c-GC and s-GC boxes was analyzed by DNase I and hydroxyl radical footprinting assays (Figs 3 and 4), and the results are summarized in Figure 7. Under peptide-free conditions the extent of DNase I cleavage in the s-GC box was greater than that in the c-GC box. The strong cleavages in the s-GC box occurred at the 5′-phosphates of G4, T7 and G8 in the G strand and C–1, C4 and C9 in the cytosine-rich strand (C strand), whereas the c-GC box was effectively cleaved only at the 5′-phosphates of G3 in the G strand and C9 in the C strand (Figs 3A, lane 4, and 4A, lanes 4 and 11). In the complex of Sp1(530–623) with the s-GC box, cleavage of DNA by DNase I was inhibited by peptide binding between the 5′-phosphates at T–4 and T12 in the G strand and between the 5′-phosphates at T–7 and T14 in the C strand (Fig. 4A, lanes 5 and 10). On the other hand, Sp1(530–623) protected the areas between the 5′-phosphates at T–3 and T12 in the G strand and between the 5′-phosphates at A–7 and T13 in the C strand from the DNase I cleavage in the complex with the c-GC box (Fig. 3A, lanes 5 and 10). In both strands the protected area in the s-GC box was longer by 1 bp at the 5′-end than that in the c-GC box. Moreover, the results of the hydroxyl radical footprinting analyses indicate that the s-GC box was protected from cleavage by hydroxyl radicals between G–2 and G9 in the G strand and between A–6 and T14 in the C strand (Fig. 4A, lanes 6–9). In contrast, the protected area in the c-GC box was located between C–2 and G9 in the G strand and between C–5 and T13 in the C strand (Fig. 3A, lanes 6–9).
Figure 3.
DNase I and hydroxyl radical footprinting analyses for Sp1(530–623) binding to the c-GC box. (A) Autoradiograms of electrophoresis gels. The left (lanes 1–7) and right (lanes 8–14) panels show the results for the G and C strands, respectively. Lanes 1 and 14, intact DNA; lanes 2 and 13, G+A (Maxam–Gilbert reaction products); lanes 3 and 12, C+T (Maxam–Gilbert reaction products); lanes 4, 5, 10 and 11, DNase I footprinting analyses; lanes 6–9, hydroxyl radical footprinting analyses. Peptide concentrations are indicated in the figures. The asterisk indicates the strong DNase I cleavage site under peptide-free conditions. (B) Densitometric analyses of the autoradiograms. The results with and without peptide are represented by dotted and solid lines, respectively.
Figure 4.
DNase I and hydroxyl radical footprinting analyses for Sp1(530–623) binding to the s-GC box. (A) Autoradiograms of electrophoresis gels. The left (lanes 1–7) and right (lanes 8–14) panels show the results for the G and C strands, respectively. Lanes 1 and 14, intact DNA; lanes 2 and 13, G+A (Maxam–Gilbert reaction products); lanes 3 and 12, C+T (Maxam–Gilbert reaction products); lanes 4, 5, 10 and 11, DNase I footprinting analyses; lanes 6–9, hydroxyl radical footprinting analyses. Peptide concentrations are indicated in the figures. The asterisks indicate strong DNase I cleavage sites under peptide-free conditions. (B) Densitometric analyses of the autoradiograms. The results with and without the peptide are represented by dotted and solid lines, respectively.
Figure 7.
Summary of the results of various footprinting and interference analyses. The core regions and the outside selected regions are boxed by solid and dotted lines, respectively. Black and gray bars indicate the protected areas in the DNase I and hydroxyl radical footprinting analyses, respectively. The bases and phosphates recognized by the peptide are shown by open and filled circles, respectively.
Analysis of specific base and phosphate recognition using alkylation interference assays
The s-GC box has a GC-rich sequence in subsite Iex. In order to postulate the specific contacts with bases and phosphates in the area, we compared the results of methylation and ethylation interference assays for the s-GC box with those for the c-GC box (Figs 5–7). Methylation of G10 and G11 in the C strand in addition to that of the guanines in subsites I to III interfered with binding of Sp1(530–623) to the s-GC box (Fig. 6A, lanes 10 and 11). A similar result was also observed in the case of the c-GC box, consistent with our previous report (20; Fig. 5A, lanes 10 and 11). In addition, a slight interference with binding of Sp1(530–623) was especially induced by methylation of G–1 in the Sp1(530–623)–s-GC box complex (Fig. 6A, lanes 4 and 5). No extra interference with base recognition was observed at the selected region of the s-GC box, suggesting that the core binding region in the s-GC box is identical to that in the c-GC box.
Figure 5.
Alkylation interference analyses for Sp1(530–623) binding to the c-GC box. (A) Autoradiograms of electrophoresis gels. The left (lanes 1–7) and right (lanes 8–14) panels show the results for the G and C strands, respectively. Lanes 1 and 14, intact DNA; lanes 2 and 13, G+A (Maxam–Gilbert reaction products); lanes 3 and 12, C+T (Maxam–Gilbert reaction products); lanes 4 and 11, free DNA samples in methylation interference analyses; lanes 5 and 10, peptide-bound DNA samples in methylation interference analyses; lanes 6 and 9, free DNA samples in ethylation interference analyses; lanes 7 and 8, peptide-bound DNA samples in ethylation interference analyses. (B) Densitometric analyses of the autoradiograms. The results for free and peptide-bound samples are represented by dotted and solid lines, respectively.
Figure 6.
Alkylation interference analyses for Sp1(530–623) binding to the s-GC box. (A) Autoradiograms of electrophoresis gels. The left (lanes 1–7) and right (lanes 8–14) panels show the results for the G and C strands, respectively. Lanes 1 and 14, intact DNA; lanes 2 and 13, G+A (Maxam–Gilbert reaction products); lanes 3 and 12, C+T (Maxam–Gilbert reaction products); lanes 4 and 11, free DNA samples in methylation interference analyses; lanes 5 and 10, peptide-bound DNA samples in methylation interference analyses; lanes 6 and 9, free DNA samples in ethylation interference analyses; lanes 7 and 8, peptide-bound DNA samples in ethylation interference analyses. (B) Densitometric analyses of the autoradiograms. The results for free and peptide-bound samples are represented by dotted and solid lines, respectively.
From the results of the ethylation interference analysis for the c-GC box, the 5′-phosphates between T–1 and G8 in the G strand and between A–1 and A12 in the C strand were recognized by Sp1(530–623) (Fig. 5A, lanes 6–9). On the other hand, Sp1(530–623) recognized the 5′-phosphates of the s-GC box situated between G–1 and G9 in the G strand and between A1 and A12 in the C strand (Fig. 6A, lanes 6–9).
Analysis of the conformational difference in free and peptide-bound DNAs with OP-Cu
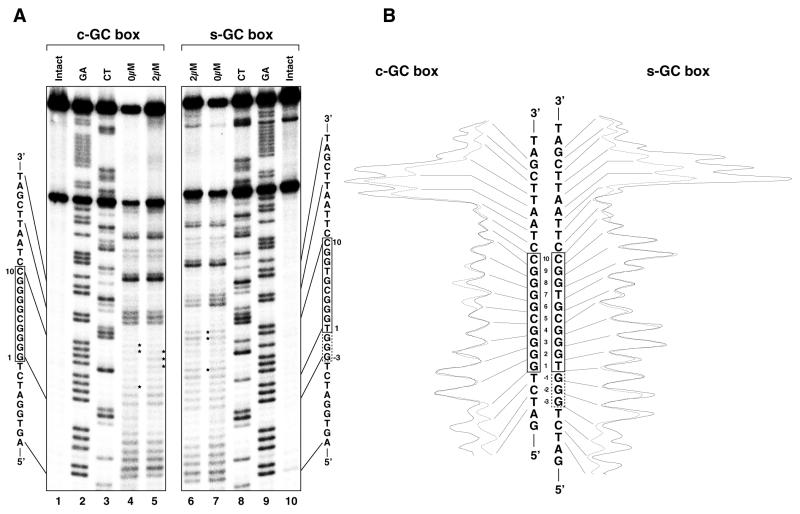
The differences in conformation between the c-GC and s-GC boxes and the conformational change in DNA induced by binding of Sp1(530–623) were analyzed by footprinting experiments with OP-Cu (Fig. 8). Under peptide-free conditions both the c-GC and s-GC box DNAs were unequally cleaved by OP-Cu. Cleavage levels at G3, G8 and G9 of the G strand of the s-GC box were higher than those of the c-GC box (Fig. 8A, lanes 4 and 7). The differences in cleavage levels were reproducible. In the presence of peptide no protection from cleavage due to peptide binding was observed for either DNA. In contrast, a slight but reproducible enhancement of DNA cleavage by the binding of Sp1(530–623) was detected at G6, G7 and G8 in the G strand of the c-GC box DNA (Fig. 8A, lane 5). On binding to the s-GC box, no such enhancements were discerned (Fig. 8A, lane 6).
Figure 8.
1,10-Phenanthroline–Cu(I) footprinting analyses for Sp1(530–623) binding to the c-GC and s-GC boxes. (A) Autoradiograms of electrophoresis gels. The left (lanes 1–5) and right (lanes 6–10) panels show the results for the G strands of the c-GC and s-GC boxes, respectively. Lanes 1 and 10, intact DNA; lanes 2 and 9, G+A (Maxam–Gilbert reaction products); lanes 3 and 8, C+T (Maxam–Gilbert reaction products); lanes 4–7, 1,10-phenanthroline–Cu(I) footprinting analyses. Peptide concentrations are described in the figures. The asterisks indicate sites at which the extent of cleavage is different between c-GC and s-GC boxes. (B) Densitometric analyses of the autoradiograms. The results with and without peptide are represented by dotted and solid lines, respectively.
DISCUSSION
Base and phosphate recognition at subsite Iex of the s-GC box by Sp1(530–623)
The present results show that Sp1(530–623) forms a weak contact with G–1 in the G strand of the s-GC box. Such a result was also observed in our previous report (20). Zinc finger proteins bind to DNA in an anti-parallel fashion and recognize bases via amino acid residues at key positions in the α-helix (1). In view of the DNA binding mode, G–1 in the G strand is recognized by an amino acid residue in finger 3 of Sp1(530–623). This mode of base recognition has been reported in the zinc fingers of a TFIIIA–DNA complex (21,22). In the complex, the arginine residue at position 10 of the α-helix in finger 3 recognizes a guanine in the 5′-portion outside the subsite for finger 3. Sp1(530–623) also has a lysine residue at position 9 of the α-helix in finger 3, suggesting that the guanine base mentioned above might be recognized by the long side chain of lysine. Nevertheless, this interaction would be too weak to provide the higher affinity of the peptide for the s-GC box. Two thymines were selected at positions 1 and 7 in the G strand of the s-GC box. Based on the base recognition mode of Sp1(530–623), it is proposed that the lysine residue at position 6 of the α-helix in finger 3 recognizes T1 and the aspartic acid residue at position 2 of the α-helix in finger 2 contacts A7 in the opposite strand (Fig. 1). However, the corresponding interaction of the aspartic acid residue with the base is shown to be weak in the Zif268–DNA complex (23) and, generally, the lysine residue tends to undergo a hydrophilic interaction with guanine. These thymines probably do not contribute significantly to the elevation of the binding affinity of Sp1(530–623) for the s-GC box. In subsite Iex, the peptide binding footprint was also evident in complexes not only with the s-GC box but also with the c-GC box. The protected area of the s-GC box is longer than that of the c-GC box. On the other hand, no increase in phosphate recognition of the region was detected for the s-GC box–Sp1(530–623) complex in ethylation interference analyses. The results suggest that the footprint in the region is due to the G–1 recognition described above, but not to phosphate recognition. Expansion of the footprinting area was also detected in subsite IIIex of the s-GC box–Sp1(530–623) complex.
Conformational differences between the c-GC and s-GC boxes under peptide-free conditions
DNase I is suggested to recognize sequence-dependent structural variations in DNA, because the cleavage rate of the enzyme varies along a DNA sequence (24). The width of the minor groove and the flexibility of DNA are major determinants of DNase I cleavage rate, i.e. a DNA sequence which is flexible or has a minor groove of average width is preferentially cleaved. Consequently, the results of DNase I footprinting analysis under peptide-free conditions suggest that the s-GC box has a flexible conformation and/or a minor groove of appropriate width for a high cleavage rate by DNase I in comparison with the c-GC box. The difference in the extent of cleavage of this type was also observed in cleavage by OP-Cu. OP-Cu cleaves DNA oxidatively in the minor groove by abstraction of the C-1 or C-4 hydrogen. Because of its small constrained chelate structure, DNA scission by OP-Cu is more sensitive to a local conformational change in DNA than that by DNase I (18). The local variation in DNA structure induced by a single base change is detectable by the use of OP-Cu (25). Therefore, our results with DNase I and OP-Cu footprinting indicate that the conformation of the minor groove of the s-GC box is evidently different from that of the c-GC box under peptide-free conditions.
Relation between the conformation of the binding sequence and the binding affinity of Sp1(530–623)
It has been reported that DNA bound by a zinc finger protein has properties intermediate between that of the canonical A- and B-forms (26). The parameters for DNA summarized by Nekludova and Pabo (26) show that the DNA possesses not only a deep and wide major groove but also a wide minor groove. Our footprinting results with OP-Cu also reveal that the local conformation of the minor groove is altered by binding of Sp1(530–623) only for the c-GC box. In addition, it is suggested that: (i) the conformation of the minor groove of the s-GC box is distinct from that of the c-GC box; (ii) binding of Sp1(530–623) to the c-GC box alters the local conformation of the DNA minor groove; (iii) binding of Sp1(530–623) to the s-GC box induces no local conformational change in the DNA minor groove detectable with OP-Cu. Taking into account the fact that the s-GC box is selected by SAAB, it is also proposed that the conformation of the minor groove of the s-GC box is originally more optimal than that of the c-GC box for binding of Sp1(530–623). In our opinion, the sequence selectivity outside the GC box and the increase in binding affinity of Sp1(530–623) for the s-GC box are attributable to the conformational suitability of the s-GC box for Sp1(530–623).
Implications for the biological role of native Sp1 and for the design of zinc finger proteins
Native Sp1 binds to the GC box in the upstream region of the promoters of various genes and regulates their transcription. In several upstream control sequences, such as those of simian virus 40 and a related monkey promoter, the Sp1 binding site frequently contains multiple copies of the GC box (8). However, our results clearly show that a single Sp1 site flanked by a GC-rich domain on the 5′-side is recognized by the three-zinc finger domain of Sp1 with higher affinity. Therefore, successive Sp1 sites presumably induce a synergistic increase in the binding affinity of Sp1 for each site. Moreover, the promoter sequences of the DNA polymerase gene of human herpes simplex virus type 1 and the polypeptide IX gene of human adenovirus type 2 contain pseudo s-GC boxes, 5′-CGG TGG GCG TGG C-3′ and 5′-GTG TGG GCG TGG C-3′, respectively (27,28). Thus, the selectivity for sequence outside the GC box might be the rationale for the frequent existence of tandemly repeated GC boxes and/or efficient viral infection.
The present SAAB results strongly indicate that Sp1(530–623) has selectivity for sequence outside the core binding site, especially for subsite Iex. Selectivity of zinc finger proteins for sequence outside the target site has also been reported by Swirnoff and Milbrandt (29). They determined the selectivity of Zif268 and related proteins for the flanking region, as well as for the core nonanucleotide, using the SAAB method. In their results, an AT-rich sequence is prefered for the region flanking the 5′-end of the core nonanucleotide site, in contrast to our present results in which a GC-rich sequence was selected in the corresponding region. This evidence suggests that the preference for sequences flanking the binding site clearly depends on the kind of zinc finger protein. Thus far, zinc finger peptides with the desired specificity have been designed on the basis of the three-zinc finger domain of Zif268 (2–5). In order to design zinc fingers with specificities for any sequence with respect to length and base composition it is necessary to consider the suitability of the newly connected finger for its target subsite.
In summary: (i) the three-zinc finger domain of Sp1 has sequence selectivity for the adjacent region flanking the 5′-end of the GC box; (ii) the selectivity is determined by a DNA conformation which is more suitable for binding of the zinc finger domain of Sp1. Several groups have designed zinc fingers with various sequence specificities with respect to length (30–32) and base composition (2–5). Nevertheless, it is still difficult to create zinc finger proteins with the desired specificities for any sequence. The mechanism of sequence preference of Sp1(530–623) presented here would provide useful information not only for the biological activity of native Sp1 but also for the design of multi-finger proteins applicable as biological tools and medicines.
Acknowledgments
ACKNOWLEDGEMENTS
This study was supported in part by Grants-in-Aid for COE Project ‘Element Science’ (12CE2005), Priority Project ‘Biometals’ (08249103) and Scientific Research (10470493·12470505) from the Ministry of Education, Culture, Sports, Science and Technology, Japan.
REFERENCES
- 1.Pavletich N.P. and Pabo,C.O. (1991) Zinc finger–DNA recognition: crystal structure of a Zif268–DNA complex at 2.1 Å. Science, 252, 809–817. [DOI] [PubMed] [Google Scholar]
- 2.Reber E.J. and Pabo,C.O. (1994) Zinc finger phage: affinity selection of fingers with new DNA-binding specificities. Science, 263, 671–673. [DOI] [PubMed] [Google Scholar]
- 3.Choo Y. and Klug,A. (1994) Toward a code for the interactions of zinc fingers with DNA: selection of randomized fingers displayed on phage. Proc. Natl Acad. Sci. USA, 91, 11163–11167. [DOI] [PMC free article] [PubMed] [Google Scholar]
- 4.Choo Y. and Klug,A. (1994) Selection of DNA binding sites for zinc fingers using rationally randomized DNA reveals coded interactions. Proc. Natl Acad. Sci. USA, 91, 11168–11172. [DOI] [PMC free article] [PubMed] [Google Scholar]
- 5.Jamieson A.C., Kim,S.-H. and Wells,J.A. (1994) In vitro selection of zinc fingers with altered DNA-binding specificity. Biochemistry, 33, 5689–5695. [DOI] [PubMed] [Google Scholar]
- 6.Dynan W.S. and Tjian,R. (1983) Isolation of transcription factors that discriminate between different promoters recognized by RNA polymerase II. Cell, 32, 669–680. [DOI] [PubMed] [Google Scholar]
- 7.Kadonaga J.T., Carner,K.R., Masiarz,F.R. and Tjian,R. (1987) Isolation of cDNA encoding transcription factor Sp1 and functional analysis of the DNA binding domain. Cell, 51, 1079–1090. [DOI] [PubMed] [Google Scholar]
- 8.Gidoni D., Dynan,W.S. and Tjian,R. (1984) Multiple specific contacts between a mammalian transcription factor and its cognate promoters. Nature, 312, 409–413. [DOI] [PubMed] [Google Scholar]
- 9.Kadonaga J.T., Jones,K.A. and Tjian,R. (1986) Promoter-specific activation of RNA polymerase II transcription by Sp1. Trends Biochem. Sci., 11, 20–23. [Google Scholar]
- 10.Sun D. and Hurley,L.H. (1994) Cooperative bending of the 21-base-pair repeats of the SV40 viral early promoter by human Sp1. Biochemistry, 33, 9578–9587. [DOI] [PubMed] [Google Scholar]
- 11.Pascal E. and Tjian,R. (1991) Different activation domains of Sp1 govern formation of multimers and mediate transcriptional synergism. Genes Dev., 5, 1646–1656. [DOI] [PubMed] [Google Scholar]
- 12.Nagaoka M. and Sugiura,Y. (1996) Distinct phosphate backbone contacts revealed by some mutant peptides of zinc finger protein Sp1: effect of protein induced bending on DNA recognition. Biochemistry, 35, 8761–8768. [DOI] [PubMed] [Google Scholar]
- 13.Yokono M., Saegusa,N., Matsushita,K. and Sugiura,Y. (1998) Unique DNA binding mode of the N-terminal zinc finger of transcription factor Sp1. Biochemistry, 37, 6824–6832. [DOI] [PubMed] [Google Scholar]
- 14.Blackwell T.K. (1995) Selection of protein binding sites from random nucleic acid sequences. Methods Enzymol., 254, 604–618. [DOI] [PubMed] [Google Scholar]
- 15.Brenowitz M., Senear,D.F., Shea,M.A. and Ackers,G.K. (1986) Quantitative DNase footprint titration: a method for studying protein–DNA interaction. Methods Enzymol., 130, 132–181. [DOI] [PubMed] [Google Scholar]
- 16.Tullius T.D., Dombroski,B.A., Churchill,M.E.A. and Kam,L. (1987) Hydroxyl radical footprinting: a high-resolution method for mapping protein–DNA contacts. Methods Enzymol., 155, 537–558. [DOI] [PubMed] [Google Scholar]
- 17.Wissmann A. and Hillen,W. (1991) DNA contacts probed by modification protection and interference studies. Methods Enzymol., 208, 365–379. [DOI] [PubMed] [Google Scholar]
- 18.Sigman D.S., Kuwabara,M.D., Chen,C.-H.B. and Bruice,T.W. (1991) Nuclease activity of 1,10-phenanthroline–copper in study of protein–DNA interactions. Methods Enzymol., 208, 414–433. [DOI] [PubMed] [Google Scholar]
- 19.Jones K.A., Kadonaga,J.T., Luciw,P.A. and Tjian,R. (1986) Activation of the AIDS retrovirus promoter by the cellular transcription factor, Sp1. Science, 232, 755–759. [DOI] [PubMed] [Google Scholar]
- 20.Kuwahara J., Yonezawa,A., Futamura,M. and Sugiura,Y. (1993) Binding of transcription factor Sp1 to GC box DNA revealed by footprinting analysis: different contact of three zinc fingers and sequence recognition mode. Biochemistry, 32, 5994–6001. [DOI] [PubMed] [Google Scholar]
- 21.Wuttke D.S., Foster,M.P., Case,D.A., Gottesfeld,J.M. and Wright,P.E. (1997) Solution structure of the first three zinc fingers of TFIIIA bound to the cognate DNA sequence: determinants of affinity and sequence specificity. J. Mol. Biol., 273, 183–206. [DOI] [PubMed] [Google Scholar]
- 22.Nolte R.T., Conlin,R.M., Harrison,S.C. and Brown,R.S. (1998) Differing roles for zinc fingers in DNA recognition: structure of a six-finger transcription factor IIIA complex. Proc. Natl Acad. Sci. USA, 95, 2938–2943. [DOI] [PMC free article] [PubMed] [Google Scholar]
- 23.Elrod-Erickson M., Rould,M.A., Nekludova,L. and Pabo,C.O. (1996) Zif268 protein-DNA complex refined at 1.6 Å: a model system for understanding zinc finger-DNA interactions. Structure, 4, 1171–1180. [DOI] [PubMed] [Google Scholar]
- 24.Travers A.A. (1989) DNA conformation and protein binding. Annu. Rev. Biochem., 58, 427–452. [DOI] [PubMed] [Google Scholar]
- 25.Spassky A. and Sigman,D.S. (1985) Nuclease activity of 1,10-phenanthroline–copper ion. Conformational analysis and footprinting of the lac operon. Biochemistry, 24, 8050–8056. [DOI] [PubMed] [Google Scholar]
- 26.Nekludova L. and Pabo,C.O. (1994) Distinctive DNA conformation with enlarged major groove is found in Zn-finger–DNA and other protein–DNA complexes. Proc. Natl Acad. Sci. USA, 91, 6948–6952. [DOI] [PMC free article] [PubMed] [Google Scholar]
- 27.Quinn J.P. and McGeoch,D.J. (1985) DNA sequence of the region in the genome of herpes simplex virus type 1 containing the genes for DNA polymerase and the major DNA binding protein. Nucleic Acids Res., 13, 8143–8163. [DOI] [PMC free article] [PubMed] [Google Scholar]
- 28.Aleström P., Akusjärvi,G., Perricaudet,M., Mathews,M.B., Klessig,D.F. and Pettersson,U. (1980) The gene for polypeptide IX of adenovirus type 2 and its unspliced messenger RNA. Cell, 19, 671–681. [DOI] [PubMed] [Google Scholar]
- 29.Swirnoff A.H. and Milbrandt,J. (1995) DNA-binding specificity of NGFI-A and related zinc finger transcription factors. Mol. Cell. Biol., 15, 2275–2287. [DOI] [PMC free article] [PubMed] [Google Scholar]
- 30.Kamiuchi T., Abe,E., Imanishi,M., Kaji,T., Nagaoka,M. and Sugiura,Y. (1998) Artificial nine zinc-finger peptide with 30 base pair binding sites. Biochemistry, 37, 13827–13834. [DOI] [PubMed] [Google Scholar]
- 31.Liu Q., Segal,D.J., Ghiara,J.B. and Barbas,C.F. (1997) Design of polydactyl zinc-finger proteins for unique addressing within complex genomes. Proc. Natl Acad. Sci. USA, 94, 5525–5530. [DOI] [PMC free article] [PubMed] [Google Scholar]
- 32.Kim J.-S. and Pabo,C.O. (1998) Getting a handhold on DNA: design of poly-zinc finger proteins with femtomolar dissociation constants. Proc. Natl Acad. Sci. USA, 95, 2812–2817. [DOI] [PMC free article] [PubMed] [Google Scholar]


