Abstract
The number of patients on hemodialysis is increasing globally; diabetes mellitus (DM) complications is the major cause of hemodialysis in patients with chronic kidney disease (CKD). The d-amino acid (AA) profile is altered in patients with CKD; however, it has not been studied in patients with CKD and DM. Furthermore, bacteria responsible for altering the D-AA profile are not well understood. Therefore, we examined the D-AA profiles and associated bacteria in patients with CKD, with and without DM. We enrolled 12 healthy controls and 54 patients with CKD, with and without DM, and determined their salivary, stool, plasma, and urine chiral AA levels using two-dimensional high-performance liquid chromatography. We performed 16S rRNA gene sequencing analysis of the oral and gut microbiota to determine the association between the abundance of bacterial species and D-AA levels. Plasma d-alanine and d-serine levels were higher in patients with CKD than in healthy adults (p < 0.01), and plasma d-alanine levels were higher in patients with CKD and DM than in those without DM. The abundance of salivary Streptococcus, which produced d-alanine, increased in patients with CKD and DM and was positively correlated with plasma d-alanine levels. Patients with CKD and DM had unique oral microbiota and d-alanine profiles. Plasma d-alanine is a potential biomarker for patients with CKD and DM.
Subject terms: Kidney diseases, Microbiome, Diagnostic markers
Introduction
The number of patients on hemodialysis (HD) is increasing1, with diabetes mellitus (DM) being the major cause in patients with chronic kidney disease (CKD)2,3. Hence, identifying biomarkers and treatments for diabetic nephropathy is a global medical need of high priority. Diabetes onset causes hyperglycemia and glomerular hyperfiltration, which leads to nephron hypertrophy and proteinuria. In addition, podocytes become enlarged to accommodate the increased filtration surface. These conditions cause glomerular sclerosis and loss of nephrons, leading to the progression of CKD. In contrast, the cause of CKD in patients without DM is a paucity of nephrons per body mass, due to a poor nephron endowment from birth, obesity, pregnancy, renal aging, or injury-related nephron loss.
The majority of patients with CKD and DM are older adults with metabolic syndrome. Therefore, they often have age- and injury-related CKD prior to the onset of DM4–7, which affects the prognosis of the kidney and is not adequately described by the term “diabetic nephropathy”. Kidney biopsy studies have demonstrated a variety of nondiabetic kidney damage in patients with diabetic nephropathy8; therefore, the concept of “CKD with DM” has been proposed in addition to the terms “diabetic nephropathy” and “diabetic kidney disease”9. In the present study, we focused on the pathophysiology of patients with kidney disease complicated by DM.
Advances in analytical technology have enabled the separation of amino acids (AAs) into d- and l-optical isomers. The d-form was believed to be rare in the human body. However, the localization and function of d-isomers have been clarified with the advent of novel technologies10–13. Furthermore, it has become clear that bacteria are the main source of D-AAs10,11,14, and the levels of D-AAs reflect changes in the microbiota in various pathological conditions. We have previously reported that acute kidney injury (AKI) alters the gut microbiota and the levels of its metabolites d-serine (D-Ser)10 and d-alanine (D-Ala)11. In addition to patients with AKI, those with CKD15,16 and DM17 also exhibit changes in the gut microbiota. Altered blood D-AA profiles have consistently been reported in patients with CKD13. However, D-AA profiles have not been studied in patients with CKD and DM. Furthermore, bacteria responsible for the alteration of the D-AA profile remain unknown. Therefore, we examined the D-AA profiles and associated bacteria in patients with CKD, with and without DM.
Methods
Study population and sample collection
This prospective observational study included 66 participants (Table 1). Healthy adults, who had no infections, cancer, fever, diarrhea, or kidney disease (estimated glomerular filtration rate [eGFR] > 60 mL/min/1.73 m2), were enrolled in the control group. The following subsets of participants were enrolled in the kidney disease groups: patients with CKD (with and without DM) and patients on HD (with and without DM). CKD was defined as an eGFR of ≤ 60 mL/min/1.73 m2. Patients who were treated with immunosuppressive drugs and antibiotics were excluded, as were those with suspected infectious diseases, a temperature > 37 °C, diarrhea, and cancer. Saliva, stool, blood, and urine samples were simultaneously collected from each participant between 2013 and 2019 at the Kanazawa University Hospital and Mizuho Hospital.
Table 1.
Clinical characteristics of the study participants.
| Characteristic | Healthy controls | Patients with CKD (n = 25) | Patients on HD (n = 29) | p value | ||
|---|---|---|---|---|---|---|
| Without DM | With DM | Without DM | With DM | |||
| N | 12 | 14 | 11 | 16 | 13 | |
| Sex (male, %) | 100 | 36 | 64 | 25 | 8 | 0.001 |
| Age | 33.5 ± 13.5 | 62.5 ± 16.2 | 64.8 ± 10.4 | 50.8 ± 14.7 | 64.6 ± 12.0 | < 0.0001 |
| Height (cm) | 171.0 ± 4.1 | 158.3 ± 12.7 | 159.3 ± 7.3 | 165.8 ± 5.7 | 166.8 ± 9.6 | 0.020 |
| Weight (kg) | 63.2 ± 7.8 | 60.8 ± 15.9 | 69.9 ± 15.4 | 59.6 ± 10.4 | 64.2 ± 13.8 | 0.325 |
| Body mass index (kg/m2) | 21.6 ± 2.4 | 24.0 ± 4.2 | 27.8 ± 7.2 | 21.6 ± 3.3 | 23.0 ± 3.8 | 0.005 |
| Creatinine (mg/dL) | 0.9 ± 0.1 | 3.3 ± 2.1 | 2.9 ± 1.3 | Renal death (13.0 ± 5.5) | Renal death (8.6 ± 6.8) | < 0.0001 |
| eGFR (mL/min/1.73 m2) | 81.7 ± 14.6 | 20.3 ± 16.1 | 21.0 ± 10.5 | Renal death (4.0 ± 1.3) | Renal death (12.9 ± 15.5) | < 0.0001 |
| HbA1c (NGSP) (%) | N/A | 6.3 ± 0.9 | ||||
| Glycoalbumin (%) | N/A | 20.0 ± 3.3 | ||||
| Systolic blood pressure (mmHg) | 121.5 ± 8.8 | 140.9 ± 26.4 | 129.5 ± 18.5 | 139.5 ± 30.3 | 149.8 ± 25.4 | 0.152 |
| Diastolic blood pressure (mmHg) | 81.5 ± 8.0 | 81.8 ± 18.6 | 73.8 ± 15.8 | 82.4 ± 17.5 | 75.5 ± 12.0 | 0.531 |
| Hemoglobin (g/dL) | 15.2 ± 0.5 | 10.7 ± 1.6 | 10.3 ± 2.0 | 10.2 ± 1.3 | 10.4 ± 1.8 | < 0.0001 |
| Total cholesterol (mg/dL) | 189.2 ± 8.8 | 202.5 ± 56.2 | 151.8 ± 43.6 | 151.9 ± 25.2 | 126.2 ± 19.6 | < 0.0001 |
| HDL cholesterol (mg/dL) | 54.6 ± 8.4 | 52.7 ± 25.7 | 44.3 ± 11.5 | 48.9 ± 14.0 | 36.0 ± 8.9 | 0.068 |
| Coronary artery disease (%) | 0 | 0 | 9 | 6 | 15 | 0.446 |
| Stroke (%) | 0 | 7 | 0 | 6 | 8 | 0.803 |
| Smoking habit (%) | 8 | 57 | 73 | 38 | 38 | 0.020 |
Values are presented as the mean ± SD or %.
CKD chronic kidney disease, DM diabetes mellitus, eGFR estimated glomerular filtration rate, HD hemodialysis, HDL high-density lipoprotein, N/A not available.
Bacterial 16S rRNA gene amplicon sequencing and analysis
For 16S rRNA gene sequencing analysis of the human microbiota18,19, bacterial genomic DNA was isolated from saliva using an enzymatic lysis method. The isolated DNA (40 ng) was used for PCR amplification of the V1–V2 hypervariable regions of the 16S rRNA gene using the universal primers 27Fmod (5′-AATGATACGGCGACCACCGAGATCTACACxxxxxxxxACACTCTTTCCCTACACGACGCTCTTCCGATCTagrgtttgatymtggctcag-3′) and 338R (5′-CAAGCAGAAGACGGCATACGAGATxxxxxxxxGTGACTGGAGTTCAGACGTGTGCTCTTCCGATCTtgctgcctcccgtaggagt-3′), containing the Illumina Nextera adapter sequence and a unique 8 bp index sequence (indicated by x) for each sample. Amplification was performed on a 9700 PCR system (Life Technologies, Japan) using Ex Taq polymerase (Takara Bio) under the following thermal cycling conditions: initial denaturation at 96 °C for 2 min, 25 cycles of denaturation at 96 °C for 30 s, annealing at 55 °C for 45 s, and extension at 72 °C for 1 min, followed by a final extension at 72 °C. All amplicons were purified using AMPure XP magnetic purification beads (Beckman Coulter) and quantified using the Quant-iT PicoGreen dsDNA assay kit (Life Technologies). Equal amounts of PCR amplicons were mixed and subjected to MiSeq (Illumina) sequencing using the MiSeq reagent kit v2 (500 cycles) according to the manufacturer’s instructions.
After demultiplexing the 16S sequence reads based on the sample-specific index, paired-end reads were joined using the FASTQ-join program. Reads with average quality values < 25 and inexact matches to the universal primer sequences were filtered out; 3000 reads that passed the quality filter were randomly selected from each sample and subjected to downstream analyses. The selected reads were rearranged in descending order according to the quality value20 and clustered into operational taxonomic units (OTUs), with a 97% pairwise identity cutoff, using the UCLUST program21 version 5.2.32 (http://www.drive5.com/). The taxonomic assignment of each OTU was determined by similarity searching against the Ribosomal Database Project and the National Center of Biotechnology Information genome database using the GLSEARCH program. The sequences determined in the current study were deposited to the DDBJ/GenBank/EMBL databases under the accession number DRA011901.
Determination of chiral AAs by two-dimensional (2D) high-performance liquid chromatography (HPLC)
D- and L-AAs were evaluated using a 2D HPLC system (Nanospace SI-2 series, Shiseido, Tokyo, Japan), as previously described22,23. Briefly, 4-nitrobenzo-2-oxa-1,3-diazole (NBD)-AAs were isolated using an online fraction collecting system in the first dimension with a microbore-ODS column, which was prepared in a fused silica capillary (1000 mm × 0.53 mm i.d., 45 °C; Shiseido). The isolated fractions were automatically transferred to the second dimension, which consisted of a narrow-bore enantio-selective column KSAACSP-001S (250 mm × 1.5 mm i.d, 25 °C; prepared in collaboration with Shiseido), to determine d- and l-enantiomers. The mobile phase for the second dimension was a mixture of methanol and acetonitrile containing formic acid. Fluorescence detection of the NBD-AAs was conducted at 530 nm with an excitation at 470 nm.
Bacterial culture
Saliva was smeared on sheep blood agar, and incubated at 35 °C for 24 h, after which colonies were isolated, subcultured on sheep blood agar, and incubated at 35 °C for 24 h. Confirmed single colonies were analyzed using matrix-assisted laser desorption/ionization-time of flight mass spectrometry (MALDI/TOF MS; Bruker) and 16S rRNA sequencing to identify the bacterial species. The identified bacteria were cultured in a liquid medium (MH-MP; Nikken Co., Ltd.) for 7 days, centrifuged (3000×g, 20 min), the turbidity of the supernatant was adjusted to approximately 2.0 McFarland standard (using a turbidity meter), and chiral AA analysis was performed.
Statistics
Data, presented as the mean ± standard deviation of the mean, were determined using SPSS Statistics version 23 software (IBM, Tokyo). Statistical analysis was performed using the two-tailed unpaired Student’s t-test and Wilcoxon rank-sum test when comparing two groups. One-way ANOVA with Tukey’s multiple comparison test were used for multiple group comparison. Statistical significance was set at p < 0.05.
Ethical approval
This study was approved by the Ethics Committee of the Kanazawa University Hospital (IRB approval No. 1291) and conducted in accordance with the principles of the Declaration of Helsinki. All participants provided written informed consent and were informed of their right to withdraw from the study at any time.
Results
D-AA levels in patients with CKD
To investigate the profiles of D-AAs in patients with kidney disease, patients with moderately impaired renal function (patients with CKD) and severely impaired renal function (patients on HD) were included in this study. The clinical characteristics of the patients with kidney disease are summarized in Table 1 and divided into CKD without DM (n = 14), CKD with DM (n = 11), HD without DM (n = 16), and HD with DM (n = 13).
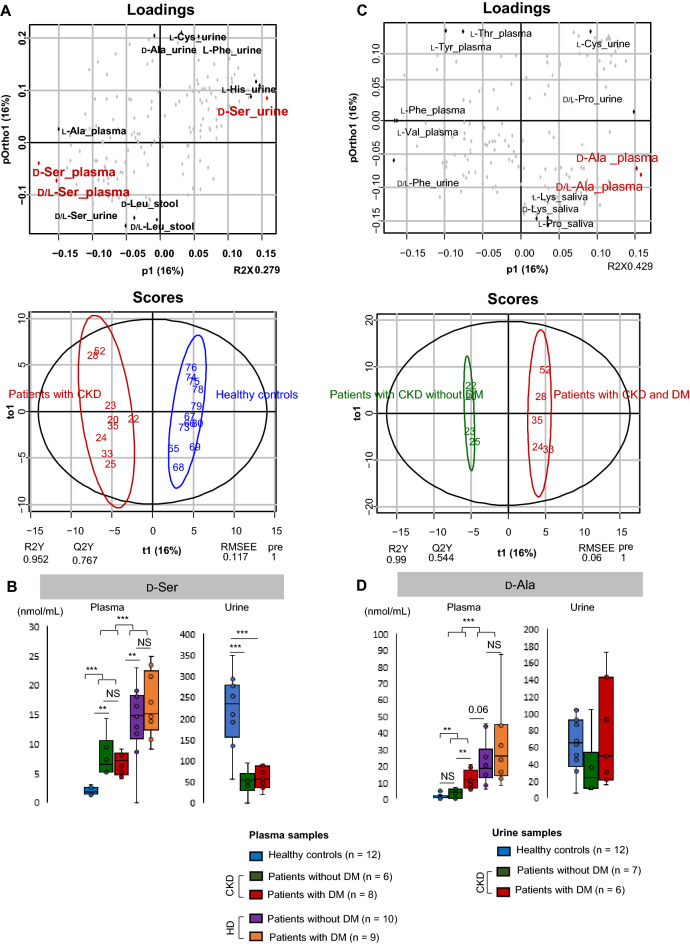
Patients with CKD were largely distinguished from healthy controls based on plasma and urine D-Ser levels using orthogonal projection to latent structures discriminant analysis (OPLS-DA) (Fig. 1A). Plasma D-Ser levels were higher (p < 0.01), whereas urine D-Ser levels were lower (p < 0.001) in patients with CKD than in healthy controls (Fig. 1B). It was suggested that a decrease in urinary D-Ser efflux was associated with an increase in plasma D-Ser in patients with CKD.
Figure 1.
Association between D-serine (D-Ser) and d-alanine (D-Ala) profiles and kidney diseases. (A) Orthogonal projection to latent structures discriminant analysis (OPLS-DA) plots for patients with CKD compared with healthy controls. (B) Plasma and urine levels of D-Ser in patients with kidney diseases and healthy controls. (C) OPLS-DA plots for patients with CKD and DM compared with those without DM. (D) Plasma and urine levels of D-Ala in patients with CKD with and without DM and in healthy controls. *p < 0.05, **p < 0.01, ***p < 0.001 (one-way ANOVA). NS not significant, CKD chronic kidney disease, DM diabetes mellitus, HD hemodialysis.
Specific D-AAs were evaluated for their ability to identify patients with CKD and DM among those with CKD. Plasma D-Ala levels largely distinguished patients with CKD without DM from those with DM using OPLS-DA (Fig. 1C,D). There was no significant difference in urinary D-Ala levels between healthy controls and patients with CKD.
D-Ala levels in the stool and saliva
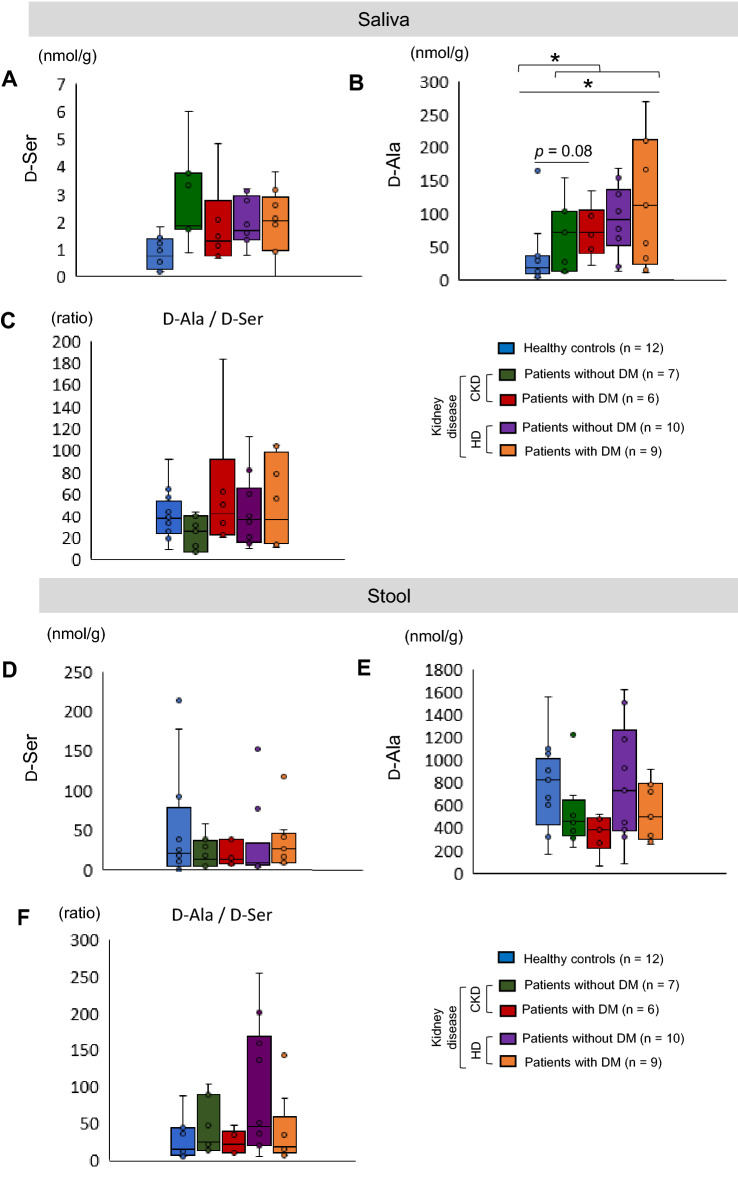
We have previously reported that the gut microbiota produces D-Ala in a mouse model of kidney disease5. To investigate whether bacteria are the producers of D-Ala in patients with CKD and DM, the oral microbiota (saliva) (Fig. 2A–C) and the gut microbiota (stool) (Fig. 2D–F) were analyzed. The D-Ala levels in the stool were higher than those in the saliva (Fig. 2D,E). Both D-Ser and D-Ala could be detected in the stool and saliva, but the D-Ala levels were higher than those of D-Ser (Fig. 2C,F). The salivary D-Ala levels were higher (p < 0.05) in patients with kidney disease than in the healthy controls (Fig. 2B). The stool D-Ala levels did not differ between the healthy controls and patients with kidney disease (Fig. 2E). Based on these results, we speculated that the increased salivary levels of D-Ala were associated with the increased blood D-Ala levels in patients with CKD and DM. Therefore, we focused on the oral microbiota (saliva).
Figure 2.
Salivary and stool d-alanine (D-Ala) and D-serine (D-Ser) levels. (A) D-Ser and (B) D-Ala levels (C) D-Ala/D-Ser ratio in saliva samples from healthy controls and patients with kidney diseases. (D) D-Ser and (E) D-Ala levels (F) D-Ala/D-Ser ratio in stool samples from healthy controls and patients with kidney diseases. One-way ANOVA and a t-test were used for statistical analysis. CKD chronic kidney disease, DM diabetes mellitus, HD hemodialysis.
Changes in the oral microbiota in patients with CKD and DM
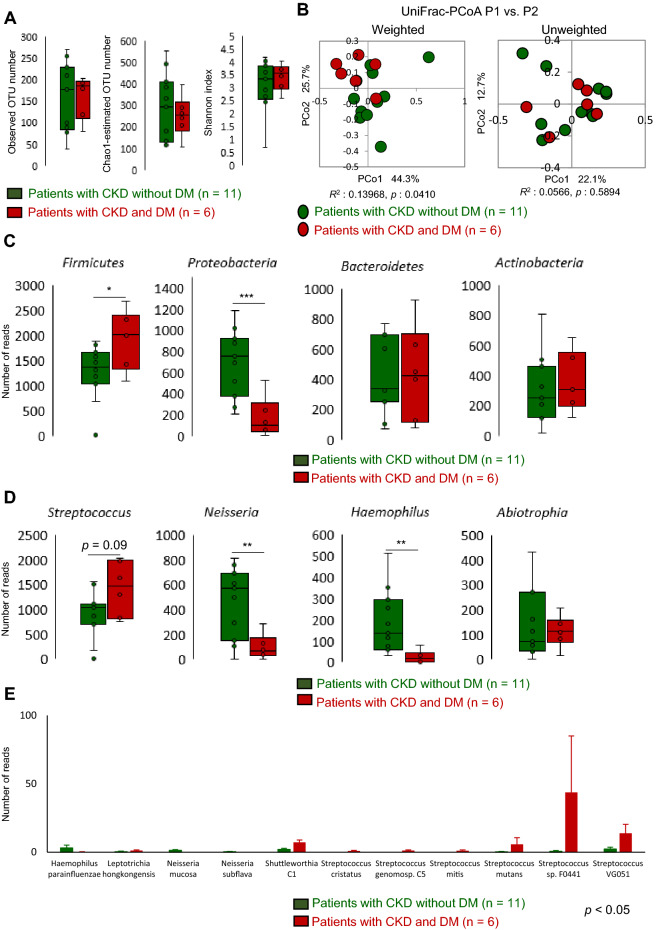
We hypothesized that DM conditions in patients with CKD altered the composition of oral bacteria, which in turn contributed to the increased salivary and plasma D-Ala levels in patients with CKD and DM. To identify the bacteria involved, 16S rRNA analysis was performed, to determine the source of the salivary and plasma D-Ala. First, alpha diversity (species richness) of the oral microbiota was analyzed (Fig. 3A, Supplementary Fig. 1A), but no difference was found between patients with CKD without and with DM, as indicated by the observed OTU numbers, Chao1-estimated OTU numbers, and the Shannon index. Further, beta diversity (overall structural similarity and variation) of the oral microbiota was evaluated (Fig. 3B, Supplementary Fig. 1B) using the UniFrac-principal coordinates analysis (PCoA). As expected, patients with CKD and DM formed a unique cluster in weighted UniFrac-PCoA (PERMANOVA R2 = 0.13968; p = 0.041) (Fig. 3B). Patients with DM on HD also formed a unique cluster in unweighted UniFrac-PCoA (PERMANOVA R2 = 0.14193; p = 0.005) (Supplementary Fig. 1B).
Figure 3.
Alpha and beta diversities of the oral microbiota in patients with CKD. (A) Differences in alpha diversity between patients with CKD without diabetic kidney disease and those with DM using three indices. (B) Differences in beta diversity between patients with CKD with and without DM using weighted and unweighted UniFrac-PCoA. The R- and p-values obtained using ANOSIM are shown below each graph. (C) Phylum, (D) genus, and (E) species level assignments of the 16S rRNA gene sequence reads between patients with CKD with and without DM. Data in (A), (C), and (D) were statistically analyzed using a t-test, and those in (E) were analyzed using the Wilcoxon rank-sum test. *p < 0.05, **p < 0.01, ***p < 0.001. ANOSIM analysis of similarities, CKD chronic kidney disease, DM diabetes mellitus, PCoA principal coordinates analysis.
Identification of oral bacteria associated with CKD and DM
We attempted to identify the oral bacteria that were particularly unique to patients with CKD and DM. Firmicutes, Proteobacteria, Bacteroidetes, and Actinobacteria were found to be the major phyla in the oral microbiota, with Firmicutes predominating (Supplementary Fig. 2A). A higher abundance of Firmicutes (p < 0.05) and a lower abundance of Proteobacteria (p < 0.01) were detected in patients with CKD and DM compared with those without DM (Fig. 3C). At the genus level, Streptococcus (phylum Firmicutes) comprised the majority of bacteria in both the healthy controls and patients (Supplementary Fig. 2B). The abundance of Streptococcus tended to be higher (p = 0.09) in patients with CKD and DM than in those without DM (Fig. 3D). The abundances of Neisseria and Haemophilus (phylum Proteobacteria) were lower (p < 0.01) in patients with CKD and DM than in those without DM (Fig. 3D). The abundance of some Streptococcus species was higher (p < 0.05) in patients with CKD and DM than in those without DM (Fig. 3E). In addition, in the group of patients who were on HD, the abundance of Streptococcus species was higher (p < 0.05) in patients with DM than in those without DM (Supplementary Fig. 1E).
Correlation between the abundance of oral Streptococcus and D-Ala levels
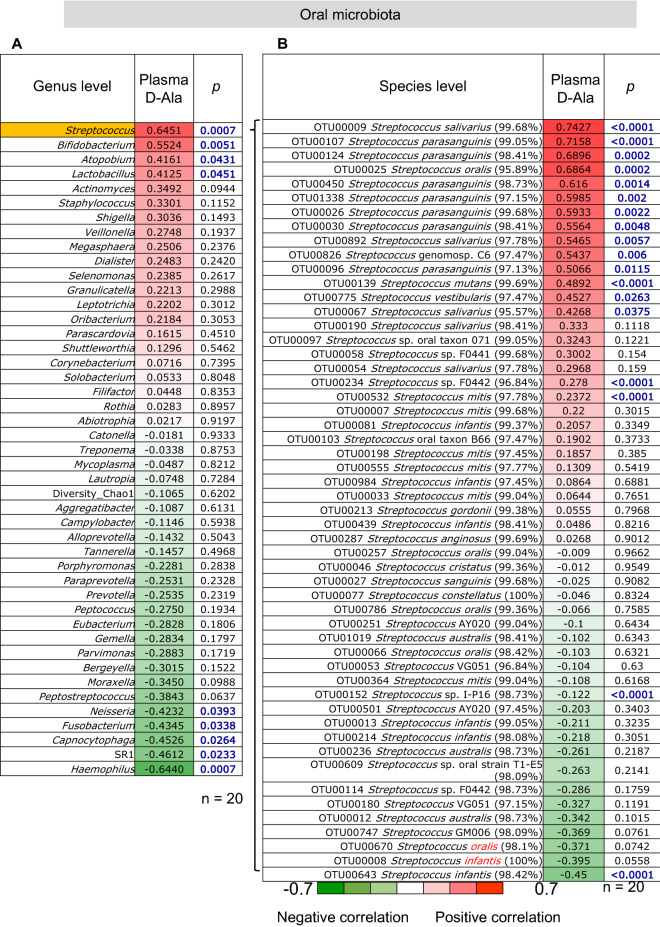
We investigated the correlation between the abundance of oral Streptococcus and plasma and salivary levels of D-Ala. At the genus level, the abundance of Streptococcus showed a significant positive correlation (r = 0.65, p < 0.001) with plasma D-Ala levels (Fig. 4A) and a positive correlation (r = 0.16) with salivary D-Ala levels (Supplementary Fig. 3). At the species level, the abundances of Streptococcus species such as S. salivarius, S. parasanguinis, and S. oralis, were significantly positively correlated (p < 0.05) with plasma D-Ala levels (Fig. 4B).
Figure 4.
Correlation between the abundance of oral microbiota and plasma d-alanine (D-Ala) levels. (A) Correlation between the abundance of oral microbiota at the genus level and plasma D-Ala levels. (B) Correlation between the abundance of oral Streptococcus species and plasma D-Ala levels.
D-Ala production by oral Streptococcus spp.
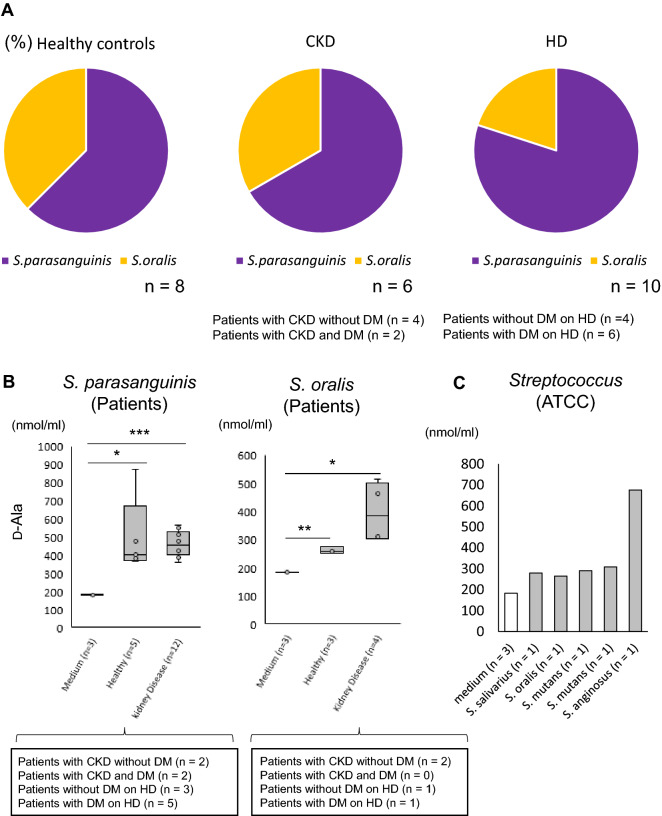
To examine whether increases in the abundance of oral S. salivarius, S. parasanguinis, and S. oralis were associated with D-Ala production, we isolated Streptococcus species from saliva samples. Twenty-four strains of Streptococcus were isolated from healthy controls (n = 8) and patients with kidney disease (n = 16) (Fig. 5). These Streptococcus strains were identified as S. parasanguinis and S. oralis using MALDI/TOF MS (Supplementary Table 1). The rates of isolation from healthy controls, patients with CKD, and patients with CKD and HD are shown in Fig. 5A. D-Ala levels in the culture supernatants of S. parasanguinis and S. oralis were higher than those in the medium (Fig. 5B). The amounts of D-Ala produced were similar between the strains from the healthy controls and patients with kidney disease. Streptococcus species that could not be isolated were purchased from the American Type Culture Collection (ATCC). The D-Ala levels in the culture supernatants of the Streptococcus species from ATCC tended to be higher than those in the medium (Fig. 5C).
Figure 5.
Association between oral Streptococcus species and d-alanine (D-Ala) levels. (A) Rates of isolation of Streptococcus species from saliva. (B) D-Ala levels in the culture supernatants of S. parasanguinis and S. oralis. (C) D-Ala levels in the culture supernatants of Streptococcus species from the American Type Culture Collection. *p < 0.05, **p < 0.01, ***p < 0.001 (one-way ANOVA). CKD chronic kidney disease, DM diabetes mellitus, HD hemodialysis.
Discussion
In this study, we found that patients with CKD and DM have a unique oral microbiota and chiral amino acid profile. Oral Streptococcus produced D-Ala. This D-Ala was increased in the blood and may be a useful biomarker for patients with CKD and DM (Fig. 6).
Figure 6.
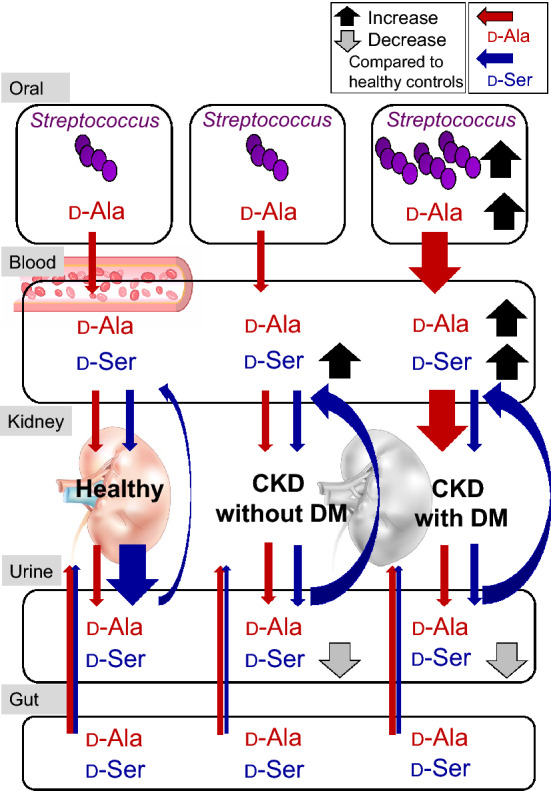
Proposed model of the relationship between oral Streptococcus-derived d-alanine (D-Ala) and kidney disease. d-Serine (D-Ser) and D-Ala were present in the blood and urine of healthy controls. Plasma D-Ser levels were higher, whereas urine D-Ser levels were lower in all patients with CKD than in healthy controls. However, the abundances of oral Streptococcus species and plasma D-Ala levels were higher in patients with CKD and DM than in those without DM. In addition, salivary D/L-Ala and plasma D-Ala levels were associated with positive estimated glomerular filtration rate slopes in patients with CKD and DM. CKD chronic kidney disease, DM diabetes mellitus.
D-Ala levels in the blood were higher in patients with CKD and DM than in patients with CKD. Urinary D-Ser levels were decreased in patients with CKD and DM compared to healthy subjects, suggesting that the increase in blood D-Ser levels were partly due to the decreased urinary excretion. Interestingly, urinary D-Ala levels did not change between healthy subjects and patients with CKD and DM. Thus, we sought to identify the major sources of D-Ala production to elucidate the mechanism by which blood D-Ala is increased in patients with CKD and DM. The main sources of D-Ala are believed to be the microbiota, diet, and endogenous biosynthesis. We have previously found that many D-AAs, including D-Ser and D-Ala, are not detectable in stools of germ-free mice but are observed in those of normal mice10,11. In addition, many bacterial species encode alanine racemase, which is a D-Ala synthase24,25; D-Ala is required for the peptidoglycan component in the bacterial cell wall. These suggest bacterial production of D-Ala.
We focused on the microbiota to investigate the mechanism of the increase of D-Ala levels in plasma. Saliva and stool were collected from patients with CKD as samples of the oral and gut microbiota, respectively, and both microbiotas were found to produce D-Ala. Salivary levels of D-Ala were higher in patients with CKD than in healthy controls. We have previously confirmed in an AKI mouse model that D-Ala was transferred into the blood by drinking water administration and was renoprotective11. Therefore, plasma D-Ala levels may have increased in patients with CKD owing to an increase in salivary D-Ala levels.
In elucidating the mechanism underlying the increase in salivary D-Ala levels compared with those in healthy controls, we found that the oral microbiota was altered. Some reports have suggested an association between oral bacteria and DM26,27, CKD28, and metabolic syndrome29. In the present study, we identified changes in the oral microbiota profiles in patients with CKD and DM. The number of oral Streptococcus species was higher in patients with CKD and DM than in those without DM. Given that D-Ala production by Streptococcus species is similar in patients with kidney disease and healthy controls, the increased levels of salivary and plasma D-Ala may be associated with the increased number of Streptococcus species in saliva from patients with CKD and DM.
The D-Ala levels in the body are also affected by other factors, such as the diet and circadian rhythm. Some food types, particularly fermented foods, are rich in D-AAs and affect D-Ala levels in the body30,31. In addition, circadian rhythm-related fluctuations in D-Ala levels have been observed in the pituitary gland, pancreas, blood, and urine32,33. For maximum elimination of these effects, samples in this study were taken at fasting levels early in the morning. Some studies have reported that D-Ala levels were increased by endogenous synthesis in local tissues. High D-Ala levels have been detected in the rat pancreas (29.2 ± 5.0 nmol/g) and anterior pituitary gland (86.4 ± 9.9 nmol/g)34. Therefore, in addition to the microbiota, the association of D-Ala levels with the anterior pituitary gland and pancreas should be investigated in the future. Moreover, the effects of age, gender, dietary habits, and medications on D-Ala levels were not clear. Therefore, the mechanisms of regulation of D-Ala levels in the body requires further investigation.
The present study has several limitations. There were considerable differences in age and sex between healthy controls and patients with CKD. Additionally, this was a single-center study with a small sample size. Therefore, larger multicenter studies should be conducted to confirm our findings. Although patients taking antibiotics were excluded, other medications may have affected the abundance of the microbiota.
Collectively, the present study revealed higher plasma D-Ser concentrations in CKD patients and higher plasma D-Ala concentrations in CKD and DM patients. It was suggested that oral Streptococcus was involved in the cause of increased plasma D-Ala in CKD and DM patients. These findings introduce a potentially new concept in nephrology and may contribute to the diagnosis of patients with CKD and DM.
Supplementary Information
Acknowledgements
We thank the staff of KAGAMI Co., Ltd., for technical support with 2D-HPLC and biological statistics and Ms. R. Izaki for conducting sample collection at the Mizuho Hospital. We would like to thank Editage (www.editage.com) for English language editing.
Author contributions
Conceptualization: Y.N., Y.I., and T.W.; methodology: Y.N., Y.I., T.W., M.M., M.N., K.H., W.S., C.O., Y.K., H.M., and M.H.; investigation: Y.N., Y.I., and T.W.; visualization: Y.N., Y.I., T.W., M.M., W.S., M.H., and T.T.; funding acquisition: Y.N., T.W., and M.S.; project administration: Y.N., Y.I., and T.W.; supervision: Y.I. and T.W.; writing—original draft: Y.N., Y.I., and T.W.; writing—review and editing: N.S., M.M., K.H., W.S., T.T., S.K., A.H., K.F., Y.K., H.M., and M.H.
Funding
This study received a Grant from AMED (JP19ek0310012 to T. Wada) and Grants-in-Aid from the Ministry of Education, Culture, Sports, Science, and Technology of the Japanese Government under Grant numbers 15K19450 and 17K08978 (Y. Nakade), 17K08979 (M. Shimizu), and 19H03557, 17H06394, and 16K15326 (T. Wada).
Data availability
The 16S rRNA gene V1–V2 region sequences analyzed in the current study have been deposited to the DDBJ/GenBank/EMBL databases under accession number DRA011901.
Competing interests
The authors declare no competing interests.
Footnotes
Publisher's note
Springer Nature remains neutral with regard to jurisdictional claims in published maps and institutional affiliations.
Supplementary Information
The online version contains supplementary material available at 10.1038/s41598-022-26175-1.
References
- 1.Lysaght MJ. Maintenance dialysis population dynamics: Current trends and long-term implications. J. Am. Soc. Nephrol. 2002;13(Suppl 1):S37–S40. doi: 10.1681/ASN.V13suppl_1s37. [DOI] [PubMed] [Google Scholar]
- 2.Brancati FL, Whelton PK, Randall BL, Neaton JD, Stamler J, Klag MJ. Risk of end-stage renal disease in diabetes mellitus: A prospective cohort study of men screened for MRFIT. Multiple Risk Factor Intervention Trial. JAMA. 1997;278:2069–2074. doi: 10.1001/jama.1997.03550230045035. [DOI] [PubMed] [Google Scholar]
- 3.Wen CP, Chang CH, Tsai MK, et al. Diabetes with early kidney involvement may shorten life expectancy by 16 years. Kidney Int. 2017;92:388–396. doi: 10.1016/j.kint.2017.01.030. [DOI] [PubMed] [Google Scholar]
- 4.Ritz E, Rychlík I, Locatelli F, Halimi S. End-stage renal failure in type 2 diabetes: A medical catastrophe of worldwide dimensions. Am. J. Kidney Dis. 1999;34:795–808. doi: 10.1016/S0272-6386(99)70035-1. [DOI] [PubMed] [Google Scholar]
- 5.Koye DN, Shaw JE, Reid CM, Atkins RC, Reutens AT, Magliano DJ. Incidence of chronic kidney disease among people with diabetes: A systematic review of observational studies. Diabet. Med. 2017;34:887–901. doi: 10.1111/dme.13324. [DOI] [PubMed] [Google Scholar]
- 6.Vijayakumar P, Hoyer A, Nelson RG, Brinks R, Pavkov ME. Estimation of chronic kidney disease incidence from prevalence and mortality data in American Indians with type 2 diabetes. PLoS One. 2017;12:e0171027. doi: 10.1371/journal.pone.0171027. [DOI] [PMC free article] [PubMed] [Google Scholar]
- 7.Vigneau C, Kolko A, Stengel B, et al. Ten-years trends in renal replacement therapy for end-stage renal disease in mainland France: Lessons from the French Renal Epidemiology and Information Network (REIN) registry. Nephrol. Ther. 2017;13:228–235. doi: 10.1016/j.nephro.2016.07.453. [DOI] [PubMed] [Google Scholar]
- 8.Espinel E, Agraz I, Ibernon M, Ramos N, Fort J, Serón D. Renal biopsy in type 2 diabetic patients. J. Clin. Med. 2015;4:998–1009. doi: 10.3390/jcm4050998. [DOI] [PMC free article] [PubMed] [Google Scholar]
- 9.Gómez LA, Lei Y, Devarapu SK, Anders HJ. The diabetes pandemic suggests unmet needs for ‘CKD with diabetes’ in addition to ‘diabetic nephropathy’—implications for pre-clinical research and drug testing. Nephrol. Dial. Transplant. 2018;33:1292–1304. doi: 10.1093/ndt/gfx219. [DOI] [PubMed] [Google Scholar]
- 10.Nakade Y, Iwata Y, Furuichi K, et al. Gut microbiota-derived D-serine protects against acute kidney injury. JCI Insight. 2018;3:e97957. doi: 10.1172/jci.insight.97957. [DOI] [PMC free article] [PubMed] [Google Scholar]
- 11.Iwata Y, Nakade Y, Kitajima S, et al. Protective effect of d-alanine against acute kidney injury. Am. J. Physiol. Renal. Physiol. 2022;322:F667–F679. doi: 10.1152/ajprenal.00198.2021. [DOI] [PubMed] [Google Scholar]
- 12.Suzuki M, Imanishi N, Mita M, Hamase K, Aiso S, Sasabe J. Heterogeneity of D-serine distribution in the human central nervous system. ASN Neuro. 2017;9:1759091417713905. doi: 10.1177/1759091417713905. [DOI] [PMC free article] [PubMed] [Google Scholar]
- 13.Kimura T, Hamase K, Miyoshi Y, et al. Chiral amino acid metabolomics for novel biomarker screening in the prognosis of chronic kidney disease. Sci. Rep. 2016;6:26137. doi: 10.1038/srep26137. [DOI] [PMC free article] [PubMed] [Google Scholar]
- 14.Sasabe J, Miyoshi Y, Rakoff-Nahoum S, et al. Interplay between microbial D-amino acids and host D-amino acid oxidase modifies murine mucosal defence and gut microbiota. Nat. Microbiol. 2016;1:16125. doi: 10.1038/nmicrobiol.2016.125. [DOI] [PMC free article] [PubMed] [Google Scholar]
- 15.Wang IK, Lai HC, Yu CJ, et al. Real-time PCR analysis of the intestinal microbiotas in peritoneal dialysis patients. Appl. Environ. Microbiol. 2012;78:1107–1112. doi: 10.1128/AEM.05605-11. [DOI] [PMC free article] [PubMed] [Google Scholar]
- 16.Vaziri ND, Wong J, Pahl M, et al. Chronic kidney disease alters intestinal microbial flora. Kidney Int. 2013;83:308–315. doi: 10.1038/ki.2012.345. [DOI] [PubMed] [Google Scholar]
- 17.Qin J, Li Y, Cai Z, et al. A metagenome-wide association study of gut microbiota in type 2 diabetes. Nature. 2012;490:55–60. doi: 10.1038/nature11450. [DOI] [PubMed] [Google Scholar]
- 18.Kim SW, Suda W, Kim S, et al. Robustness of gut microbiota of healthy adults in response to probiotic intervention revealed by high-throughput pyrosequencing. DNA Res. 2013;20:241–253. doi: 10.1093/dnares/dst006. [DOI] [PMC free article] [PubMed] [Google Scholar]
- 19.Ueno M, Kikuchi M, Oshima K, Kim SW, Morita H, Hattori M. Assessment and improvement of methods for microbial DNA preparation from fecal samples. In: Bruijn FJ, editor. Handbook of Molecular Microbial Ecology II: Metagenomics in Different Habitats. Wiley; 2011. pp. 191–198. [Google Scholar]
- 20.Said HS, Suda W, Nakagome S, et al. Dysbiosis of salivary microbiota in inflammatory bowel disease and its association with oral immunological biomarkers. DNA Res. 2014;21:15–25. doi: 10.1093/dnares/dst037. [DOI] [PMC free article] [PubMed] [Google Scholar]
- 21.Edgar RC. Search and clustering orders of magnitude faster than BLAST. Bioinformatics. 2010;26:2460–2461. doi: 10.1093/bioinformatics/btq461. [DOI] [PubMed] [Google Scholar]
- 22.Koga R, Miyoshi Y, Negishi E, et al. Enantioselective two-dimensional high-performance liquid chromatographic determination of N-methyl-D-aspartic acid and its analogues in mammals and bivalves. J. Chromatogr. A. 2012;1269:255–261. doi: 10.1016/j.chroma.2012.08.075. [DOI] [PubMed] [Google Scholar]
- 23.Hamase K, Miyoshi Y, Ueno K, et al. Simultaneous determination of hydrophilic amino acid enantiomers in mammalian tissues and physiological fluids applying a fully automated micro-two-dimensional high-performance liquid chromatographic concept. J. Chromatogr. A. 2010;1217:1056–1062. doi: 10.1016/j.chroma.2009.09.002. [DOI] [PubMed] [Google Scholar]
- 24.Hols P, Defrenne C, Ferain T, Derzelle S, Delplace B, Delcour J. The alanine racemase gene is essential for growth of Lactobacillus plantarum. J. Bacteriol. 1997;179:3804–3807. doi: 10.1128/jb.179.11.3804-3807.1997. [DOI] [PMC free article] [PubMed] [Google Scholar]
- 25.Milligan DL, Tran SL, Strych U, Cook GM, Krause KL. The alanine racemase of Mycobacterium smegmatis is essential for growth in the absence of D-alanine. J. Bacteriol. 2007;189:8381–8386. doi: 10.1128/JB.01201-07. [DOI] [PMC free article] [PubMed] [Google Scholar]
- 26.Hintao J, Teanpaisan R, Chongsuvivatwong V, Ratarasan C, Dahlen G. The microbiological profiles of saliva, supragingival and subgingival plaque and dental caries in adults with and without type 2 diabetes mellitus. Oral Microbiol. Immunol. 2007;22:175–181. doi: 10.1111/j.1399-302X.2007.00341.x. [DOI] [PubMed] [Google Scholar]
- 27.Casarin RCV, Barbagallo A, Meulman T, et al. Subgingival biodiversity in subjects with uncontrolled type-2 diabetes and chronic periodontitis. J. Periodontal. Res. 2013;48:30–36. doi: 10.1111/j.1600-0765.2012.01498.x. [DOI] [PubMed] [Google Scholar]
- 28.Fisher MA, Taylor GW, Shelton BJ, et al. Periodontal disease and other nontraditional risk factors for CKD. Am. J. Kidney Dis. 2008;51:45–52. doi: 10.1053/j.ajkd.2007.09.018. [DOI] [PubMed] [Google Scholar]
- 29.Srivastava MC, Srivastava R, Verma PK, Gautam A. Metabolic syndrome and periodontal disease: An overview for physicians. J. Fam. Med. Prim. Care. 2019;8:3492–3495. doi: 10.4103/jfmpc.jfmpc_866_19. [DOI] [PMC free article] [PubMed] [Google Scholar]
- 30.Nagata Y, Higashi M, Ishii Y, et al. The presence of high concentrations of free D-amino acids in human saliva. Life Sci. 2006;78:1677–1681. doi: 10.1016/j.lfs.2005.08.009. [DOI] [PubMed] [Google Scholar]
- 31.Mochizuki T, Takayama T, Todoroki K, Inoue K, Min JZ, Toyo'oka T. Towards the chiral metabolomics: Liquid chromatography–mass spectrometry based DL-amino acid analysis after labeling with a new chiral reagent, (S)-2,5-dioxopyrrolidin-1-yl-1-(4,6-dimethoxy-1,3,5-triazin-2-yl)pyrrolidine-2-carboxylate, and the application to saliva of healthy volunteers. Anal. Chim. Acta. 2015;875:73–82. doi: 10.1016/j.aca.2015.02.054. [DOI] [PubMed] [Google Scholar]
- 32.Karakawa S, Miyoshi Y, Konno R, Hamase K, et al. Two-dimensional high-performance liquid chromatographic determination of day–night variation of D-alanine in mammals and factors controlling the circadian changes. Anal. Bioanal. Chem. 2013;405:8083–8091. doi: 10.1007/s00216-013-7071-2. [DOI] [PubMed] [Google Scholar]
- 33.Morikawa A, Fukuoka H, Uezono K, et al. Sleep-awake profile related circadian D-alanine rhythm in human serum and urine. Chromatography. 2017;38:53–58. doi: 10.15583/jpchrom.2017.003. [DOI] [Google Scholar]
- 34.Morikawa A, Hamase K, Zaitsu K. Determination of D-alanine in the rat central nervous system and periphery using column-switching high-performance liquid chromatography. Anal. Biochem. 2003;312:66–72. doi: 10.1016/S0003-2697(02)00432-3. [DOI] [PubMed] [Google Scholar]
Associated Data
This section collects any data citations, data availability statements, or supplementary materials included in this article.
Supplementary Materials
Data Availability Statement
The 16S rRNA gene V1–V2 region sequences analyzed in the current study have been deposited to the DDBJ/GenBank/EMBL databases under accession number DRA011901.


