

Abstract
Surgeons routinely perform incremental releases on overly tight ligaments during total knee arthroplasty (TKA) to reduce ligament tension and achieve their desired implant alignment. However, current methods to assess whether the surgeon achieved their desired reduction in the tension of a released ligament are subjective and/or do not provide a quantitative metric of tension in an individual ligament. Accordingly, the purpose of this study was to determine whether shear wave tensiometry, a novel method to assess tension in individual ligaments based on the speed of shear wave propagation, can detect changes in ligament tension following incremental releases. In seven medial and eight lateral collateral porcine ligaments (MCL and LCL, respectively), we measured shear wave speeds and ligament tensions before and after incremental releases consisting of punctures with an 18-gauge needle. We found that shear wave speed squared decreased linearly with decreasing tension in both the MCL (R2avg = 0.76) and LCL (R2avg = 0.94). We determined that errors in predicting tension following incremental releases were 26.2 N and 14.2 N in the MCL and LCL, respectively, using ligament-specific calibrations. These results suggest shear wave tensiometry is a promising method to objectively measure the tension reduction in released structures.
Clinical Significance:Direct, objective measurements of the tension changes in individual ligaments following release could enhance surgical precision during soft tissue balancing in TKA. Thus, shear wave tensiometry could help surgeons reduce the risk of poor outcomes associated with overly tight ligaments, including residual knee pain and stiffness.
Keywords: Total knee arthroplasty, ligament tensiometry, soft tissue balancing, intraoperative sensor, ligament release
Introduction
During total knee arthroplasty (TKA), surgeons routinely have to address overly tight ligaments. The traditional alignment targets in TKA (i.e., mechanical alignment with equal and rectangular gaps) often cause the surgeon to alter the patient’s native alignment and gaps, creating overly tight ligaments.1–4 Additionally, prior studies suggest that ligaments in the diseased compartment (e.g., the medial collateral ligament in a knee with osteoarthritis in the medial compartment) contract and/or become stiffer.5,6 Thus, to achieve their desired implant alignment and soft tissue balance,2,7 surgeons commonly reduce ligament tension using a ligament release technique called “pie crusting”. Pie crusting, or the “inside-out” technique, involves iteratively puncturing the overly tight ligament with a needle or scalpel to reduce the tension in that ligament.8,9 Previous ex vivo10–14 and in vivo8,15 studies have shown that pie crusting does reduce the tension in ligaments, but tracking these reductions in tension remain challenging. Indeed, improper ligament tensioning is one of the primary factors associated with knee stiffness and pain,16,17 which are two common reasons patients report not being satisfied following TKA.18 With up to 19% of patients reporting that they are not satisfied following TKA,16,17,19,20 a method to track ligament tension reductions during iterative release procedures is needed to mitigate the risk of improper ligament tension post-operatively.
Current methods to assess reductions in ligament tension during these releases are subjective and/or not capable of directly measuring the tension in an individual ligament. Laxity assessments,21,22 gap tensioners,23,24 and spacer blocks25 are most commonly used to assess ligament tension during TKA. However, many ligaments work in parallel to determine joint laxity, and clinical assessments of laxity are often qualitative. A recent study showed that assessing ligament tension based on joint gaps alone, one common measure of joint laxity, resulted in average tibiofemoral contact forces up to 350 N,26 which are about three-times greater than those in the native knee.27 An alternative to laxity and gap assessments are instrumented trials that measure the tibiofemoral contact forces;18,28 however, these trials provide quantitative guidance about the tensions of all the ligaments in a compartment rather than the tension in a particular ligament. Thus, a direct and objective method to track changes in tension in the released ligament would enhance the surgeon’s ability to determine when they have achieved a desired reduction in tension during iterative releases.
One promising method to measure the tension in individual ligaments during TKA directly and objectively is shear wave tensiometry.29,30 Prior studies have shown that shear wave speed squared is proportional to the axial stress in tendons29 and ligaments.30 This relationship between shear wave speed squared and axial stress is consistent with the analytical relationship predicted by a tensioned beam model.29 However, it is unknown whether reductions in tension due to releases alter shear wave propagation speed differently than reductions in tension due to changes in the axial stretch of an intact ligament. Thus, a pre-requisite step to translating shear wave tensiometry into the operating room to monitor ligament tension during soft tissue balancing is to determine whether shear wave speeds track ligament tension changes following iterative releases. If we determine that a relationship does exist between shear wave speed and tension following iterative releases, then an important subsequent step is to characterize the errors in tension predicted using shear wave speeds.
To address this research question about whether shear wave speeds track ligament tension following iterative releases, we had two objectives for this study. Our first objective was to characterize the relationship between shear wave speed and tension in medial and lateral collateral ligaments (MCL and LCL, respectively) following incremental releases. We chose to study the MCL and LCL because collateral ligament tension is a common focus of soft tissue balancing during TKA. Our second objective was to determine the errors in predicting tension using shear wave speeds during incremental releases in the MCL and LCL.
METHODS
Specimen preparation
We procured eight MCLs and eight LCLs from a crossbreed of large white, landrace, and red duroc pigs for this study (weight = 139.0 ± 6.8 kg, age = 6 months). One MCL failed during testing and was excluded. We used porcine collateral ligaments for this study because MCLs from pigs of this size have been previously shown to have similar structural (e.g., stiffness, failure deformation) and material (e.g., modulus, failure strain) properties to those of human MCLs.31 Each ligament underwent one freeze-thaw cycle.32,33
Specimen preparation consisted of the following steps. We first exposed each ligament by removing all superficial tissue, and then flexed each knee (i.e., stifle joint) to the angle where the fibers across the ligament appeared to be most uniformly taught; this angle was typically around 80° of flexion.31 Next, we cut bone blocks containing the ligament attachments from the distal femoral condyle and proximal tibia/fibula using an oscillating saw. We then secured each bone block in an aluminum cup using a potting material (Bondo Fiberglass Resin, 3M, St. Paul, MN). Finally, we dissected away excess tissue superficial and deep to the outer surface of the ligament prior to experimentation.
Experimental procedure
Following dissection, we mounted each specimen for experimentation using the following steps. First, we secured the potting cups in the grips of an electrodynamic testing system (Acumen 3, MTS, Eden Prairie, MN) with the specimen aligned visually with the loading axis. We fine-tuned the orientation of the potting cups to achieve the most-uniform tension across the width of the ligament. We assessed the uniformity of tension by palpation across the ligament width. Next, we mounted the three components of the shear wave tensiometer, which housed the piezoelectric tapping device and two accelerometers, in a 3D-printed structure that pressed each component against the outer surface of the ligament with a controlled force of 1.4 ± 0.2 N (Figure 1). The level of this controlled force was set to minimally influence the shear wave speeds (i.e., maintain coupled transverse motion of the accelerometers and the ligament with minimal alteration of the local stresses).34 We measured the controlled force of each component using a load cell (LC101, Omegadyne Inc., with reported linearity = 0.25 N). The piezoelectric tapping device (PK4JQP1, Thorlabs Inc, Newton, NJ) induced shear waves in each specimen by delivering micron-scale square wave taps with a 50% duty cycle across the width of the ligament at a tap rate of 10 Hz. The pair of single-axis accelerometers (Model 352C23, PCB Piezotronics), spaced 6.5 mm apart, tracked the shear wave propagation resulting from the leading edge of the square wave tap.29 Further details on the tapping device and the accelerometer arms are described in the Supplemental materials (Supplement A, Figures S-1, S-2, and S-3). We completed two repeatability studies using this apparatus to characterize errors introduced by (1) setting up the entire apparatus and (2) removing and reapplying the tapper and accelerometer arms on the ligament between experimental trials (Supplement B, Figures S-4 and S-5). We determined the repeatability limits35 for the first scenario to be 6.70 m/s for the MCL and 4.58 m/s for the LCL, and those for the second scenario to be 1.49 m/s for the MCL and 2.70 m/s for the LCL.
Figure 1.
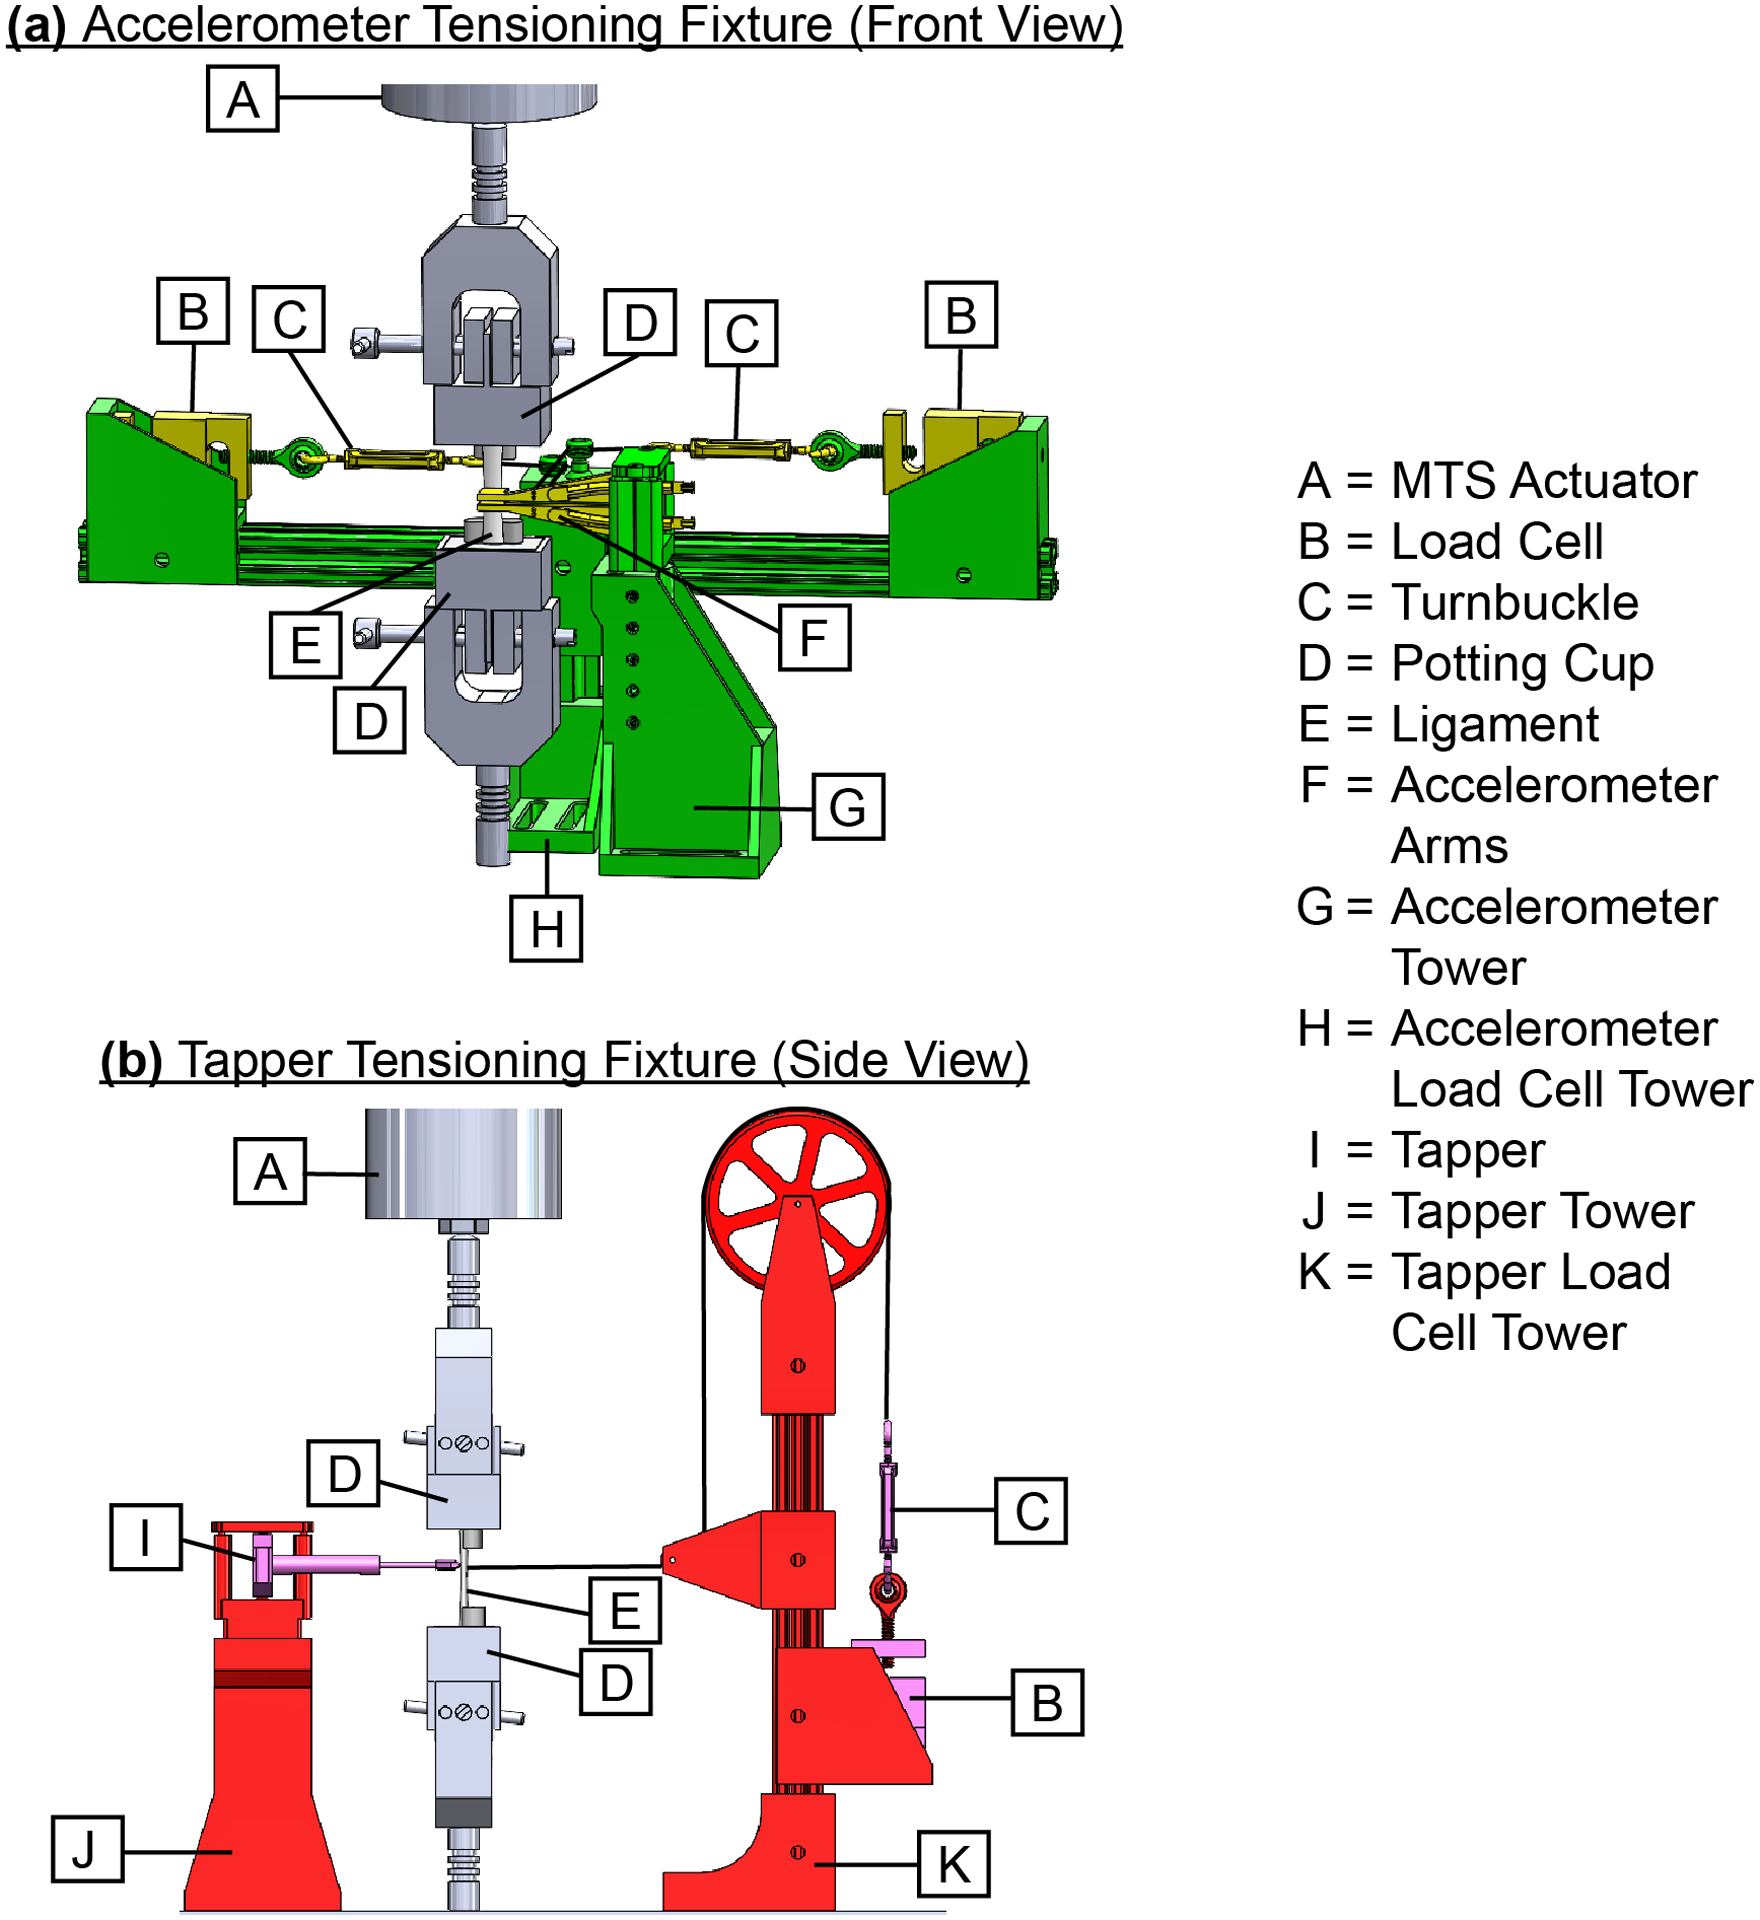
Renderings of CAD assembly show the test apparatus used to control the application forces of the tensiometer components against the ligament. The bony attachments of each ligament were fixed within two potting cups mounted to the MTS actuator. The two main subassemblies were the (a) Accelerometer Tensioning Fixture and (b) Tapper Tensioning Fixture. These subassemblies were set-up together, but are not shown together above for clarity. The Accelerometer Tensioning Fixture included two accelerometers housed in 3D-printed accelerometer arms mounted to the accelerometer tower and two load cells attached to the accelerometer load cell tower. Each accelerometer arm was connected to its own load cell with a turnbuckle and fishing line. Turnbuckles were used to adjust the tension in each fishing line (Dorisea Extreme Braid 0.63 mm) to control the application force of each accelerometer arm against the ligament. The accelerometer arms, load cells, and turnbuckles are shown in yellow, and the accelerometer tower and accelerometer load cell tower are shown in green. The Tapper Tensioning Fixture included a tapper mounted to the tapper tower and a load cell attached to the tapper load cell tower. A turnbuckle and fishing line connected the tapper and load cell. Similar to the Accelerometer Tensioning Fixture, the turnbuckle was used to adjust the tension in the fishing line to control the application force of the tapper against the ligament. The tapper, load cell, and turnbuckle are shown in pink, and the tapper tower and tapper load cell tower are shown in red. Further details on the piezoelectric tapper, the accelerometer arms, and the entire apparatus are described in the Supplemental materials (Supplement A, Figures S-1, S-2, and S-3)
Before testing, we preconditioned each ligament with the following procedure. First, we axially loaded each ligament with 50 cycles from 25 to 250 N at 1 Hz followed by a static hold at 250 N for 30 minutes to minimize viscoelastic effects.30 We limited the maximum load to 250 N based on pilot studies that showed failures at the bony attachments of some porcine ligaments when applied loads exceeded 250 N. Also, based on these pilot studies and assuming the resting tension in the collateral ligaments is 50 N36, we determined that 250 N represents about 2–3 mm of overstuffing, which covers the expected overstuffing in a vast majority of patients undergoing mechanically aligned TKA.2 We recorded the maximum stretch during the 30-minute static hold at 250 N, referred to subsequently as δ250.
Following preconditioning, we measured shear wave speeds before and after sets of incremental releases. First, we cycled each ligament 10 times between its slack length and δ250 at 1 Hz, and then we measured the shear wave speeds with the intact ligament held to a stretch of δ250. We then repeated three steps (i.e., release, cycle, and measure) to characterize changes in shear wave speed following incremental releases (Figure 2). In the release step, we stretched the ligament to δ250 and performed a set of incremental releases. Each set of releases consisted of a minimum of five punctures across the ligament width using an 18-gauge needle. We performed more than five punctures for some trials to ensure that the tension in the ligament stretch to δ250 dropped by at least 10 N in each set of releases. We performed subsequent release sets about 2 mm above the previous row of punctures. In the cycle step, we cycled the ligament 10 times between its slack length and δ250 at 1 Hz to simulate the surgeon intraoperatively flexing and extending the knee following release (i.e., pie crusting). In the measure step, we held the ligament at a stretch of δ250 and placed the tapper and accelerometer arms on the surface of the ligament as described previously. We held the ligament at a stretch of δ250 for 10 seconds while measuring both the shear wave speed and applied axial tension. We repeated this release-cycle-measure procedure until the tension in the ligament when stretched to δ250 was below 50 N. Throughout testing, we kept the ligaments moist by regularly spraying them with 0.9% saline.
Figure 2.

The experimental procedure to characterize changes in shear wave speed following incremental releases included three steps: (a) Release: the ligament was ramped to the maximum displacement under 250 N tension, δ250, which we measured during preconditioning. The ligament was punctured at least 5 times with an 18-gauge needle until tension in the ligament decreased by at least 10 N. (b) Cycle: the ligament was cycled between slack length and δ250 for 10 cycles at 1 Hz. (c) Measure: the shear wave tensiometer was used to measure the shear wave speed during a 10-second static hold using the tapper to excite a shear wave and arms with embedded accelerometers to measure the shear wave propagation. This process was repeated until the tension in the ligament at δ250 dropped below 50 N.
Post-processing
We post-processed the recorded accelerometer signals to obtain the data used in later analyses. We computed the shear wave speeds following each tap by measuring the time delay between the arrivals of the shear waves at the two accelerometers. We filtered waveforms using a second-order Butterworth bandpass filter (MATLAB R2020b) with lower and upper cutoff frequencies of 150 and 2500 Hz, respectively. We selected the cutoff settings of the bandpass filter to eliminate signal not associated with tapper-induced vibration (e.g., high frequency noise, DC offset), while ensuring the frequency of the peak wave signal (range = 550–1270 Hz) was well within the cutoff frequencies. To determine the time delay in shear wave arrival between accelerometers, we computed the normalized cross-correlation between the first accelerometer waveform (i.e., the template signal was the first 0.8 ms of the transient response after tap onset) with the second accelerometer waveform (i.e., a search region that extended to 1.0 ms after tap onset).29 The time shift that maximized the normalized cross-correlation was determined. We performed a sub-sample interpolation using a local 3-point cosine fit of the normalized cross-correlation values.37 We computed the shear wave speeds from each tap by dividing the spacing between the accelerometers (6.5 mm) by the time delay in wave arrival. We averaged the shear wave speeds from each tap event to compute a shear wave speed across the 10-second measurement. Similarly, the tension was ascertained by averaging the data from the MTS load cell (661.18E-02, MTS, reported hysteresis/non-linearity = 0.08% full scale) across the 10-second measurement.
Statistical analysis
To characterize the relationship between shear wave speed and tension, we performed simple linear regressions for each ligament type with shear wave speed squared as the independent variable and tension as the dependent variable. Although the analytic relationship is between shear wave speed squared and axial stress, we chose to use tension in the present study because (1) tension is a more understandable quantity for clinicians, and (2) our ligaments all had similar cross-sectional areas so using tension instead of axial stress only scaled the slope of our fits. The level of significance, α, was set to 0.05. With at least seven ligaments of each type, we could detect relationships between shear wave speed squared and tension with R2 ≥ 0.64 with α = 0.05 and power, 1-β, set to 0.8.38
To determine the errors in predicting tension after releases, we evaluated three different cases that could potentially be used to calibrate a shear wave tensiometer for tracking releases. For the first case, we performed a leave-one-out analysis in which we performed a linear regression between shear wave speed squared and tension from 14 ligaments and then used this regression equation to predict the tension in the 15th ligament. We computed the errors in predicted tension for the 15th ligament as the difference between the predicted and actual tensions for that ligament. We pooled the errors in the predicted tensions for that ligament and then determined the bias (mean of the errors), precision (standard deviation of the errors), and root-mean-square error (RMSE) per ISO 5725-139 and ASTM E177-13.35 We repeated this procedure for all combinations of the 15 ligaments. We then pooled the errors in the predicted tensions for each ligament type (i.e., errors from all seven MCLs or all eight LCLs) and computed the overall bias, precision, and RMSE for that ligament type. This first case represents a translational use case in which pooled shear wave speed data from all MCLs and LCLs is used to calibrate the shear wave tensiometer.
For the second case, we performed separate leave-one-out analyses for each ligament type. Thus, we performed the linear regression using data from all but one MCL or LCL and then predicted tension in the left-out MCL or LCL, respectively. For example, we predicted tension in the 1st LCL using a shear wave speed-tension relationship fit to data from the 2nd-8th LCLs. We computed the errors in predicted tension for the left-out MCL/LCL as the difference between the predicted and actual tensions for that ligament. We pooled the errors in the predicted tensions for that ligament and then determined the bias (mean of errors), precision (standard deviation of the errors), and root-mean-square error (RMSE) per ISO 5725-139 and ASTM E177-13.35 We repeated this procedure for all ligaments. We then pooled the errors in the predicted tensions for each ligament type (i.e., errors from all seven MCLs or all eight LCLs) and computed the overall bias, precision, and RMSE for that ligament type. This second case represents a translational use case in which pooled shear wave speed data from previously collected ligaments of a specific type (i.e., MCLs) is used to calibrate the shear wave tensiometer for measurements on that same ligament type.
For the third case, we performed a linear regression between tension and shear wave speed squared for each MCL and LCL. We computed the errors in predicted tension for each ligament using the residual errors from that regression. We pooled these residual errors for each ligament and determined the bias (mean of the errors), precision (standard deviation of the errors), and root-mean-square error (RMSE) per ISO 5725-139 and ASTM E177-13.35 We then pooled the errors in the predicted tensions for each ligament type (i.e., errors from all seven MCLs or all eight LCLs) and computed the overall bias, precision, and RMSE for that ligament type. This third case represents a translational use case in which a ligament-specific calibration of the shear wave tensiometer is performed before performing releases (e.g., during an intraoperative laxity assessment).
RESULTS
The shear wave speed squared of both the MCL and the LCL decreased linearly with decreasing tension (Figure 3). The mean ± standard deviation of the coefficients of determination (R2) of the individual MCLs and LCLs were 0.76 ± 0.18 and 0.94 ± 0.07, respectively (individual data shown in Supplement C, Figures S-6 and S-7, and additional regression parameters included in Supplement D, Table S-1). Within each ligament type, the R2 values for fits to the pooled data of each ligament decreased to 0.58 and 0.73 for the MCL and LCL, respectively.
Figure 3.

Scatter plots show the linear relationship between shear wave speed squared and tension after incremental releases in both the (a) MCL and (b) LCL. The solid black line indicates the linear regression of the specimens pooled together, and the gray shaded region represents a 95% confidence interval of the fit line. The data points for each specimen are plotted in a different color.49
The error analysis showed that the errors in the predicted tension using shear wave speed were smallest when using ligament-specific data compared to using data from other ligaments (Tables 1 and 2). For the MCL, the overall RMSEs of predicted tension were 45.3 N (18.1% of 250-N max) when predicting based on data from all other MCLs and LCLs, 43.0 N (17.2% of 250-N max) when predicting based on data from all other MCLs, and 26.2 N (10.5% of 250-N max) when predicting based on data from the specific MCL (Table 1). For the LCL, the overall RMSEs of predicted tension were 41.6 N (16.6% of 250-N max) when predicting based on the data from all other MCLs and LCLs, 45.9 N (18.4% of 250-N max) when predicting based on data from all other LCLs, and 14.2 N (5.7% of 250-N max) when predicting based on data from the specific LCL (Table 2).
Table 1.
Results from our error analysis of predicted MCL tension using data from all other MCLs and LCLs, using data from all other MCLs, and using data from the specific MCL. The values shown are the bias (mean of the errors), precision (standard deviation of the errors), and root-mean-square error (RMSE).
| Predicted Specimen | Error in Predicted Tension (N) | ||||||||
|---|---|---|---|---|---|---|---|---|---|
| Case 1: MCLs and LCLs | Case 2: MCLs | Case 3: Specific MCL | |||||||
| Bias | Precision | RMSE | Bias | Precision | RMSE | Bias | Precision | RMSE | |
| MCL 1 | −5.4 | 37.0 | 36.2 | 7.8 | 39.2 | 38.6 | −1.3 | 27.4 | 26.5 |
| MCL 2 | 7.2 | 21.4 | 21.4 | 16.5 | 25.5 | 29.2 | 0.5 | 16.8 | 15.9 |
| MCL 3 | −30.7 | 41.0 | 49.6 | −17.8 | 42.0 | 43.7 | 0.4 | 40.7 | 38.7 |
| MCL 4 | 9.3 | 39.3 | 38.4 | 18.8 | 40.6 | 42.9 | 6.1 | 38.8 | 37.4 |
| MCL 5 | −1.5 | 22.7 | 21.4 | 7.1 | 25.8 | 25.3 | 3.2 | 21.9 | 20.9 |
| MCL 6 | −70.5 | 32.9 | 77.2 | −56.8 | 25.0 | 61.6 | 0.5 | 14.7 | 14.0 |
| MCL 7 | 20.7 | 34.1 | 38.2 | 28.1 | 36.8 | 44.6 | 0.2 | 19.2 | 18.1 |
| Overall | −12.2 | 43.9 | 45.3 | −1.2 | 43.3 | 43.0 | 1.2 | 26.4 | 26.2 |
Table 2.
Results from our error analysis of predicted LCL tension using data from all other MCLs and LCLs, using data from all other LCLs, and using data from the specific LCL. The values shown are the bias (mean of the errors), precision (standard deviation of the errors), and root-mean-square error (RMSE).
| Predicted Specimen | Error in Predicted Tension (N) | ||||||||
|---|---|---|---|---|---|---|---|---|---|
| Case 1: MCLs and LCLs | Case 2: LCLs | Case 3: Specific LCL | |||||||
| Bias | Precision | RMSE | Bias | Precision | RMSE | Bias | Precision | RMSE | |
| LCL 1 | −0.9 | 25.7 | 25.0 | −43.8 | 24.6 | 49.8 | −0.2 | 21.4 | 20.8 |
| LCL 2 | 19.6 | 41.3 | 43.3 | 17.7 | 30.7 | 33.7 | −0.1 | 15.9 | 14.9 |
| LCL 3 | 8.3 | 33.9 | 32.5 | 8.0 | 21.3 | 21.2 | 0.01 | 11.0 | 10.2 |
| LCL 4 | 35.8 | 40.3 | 52.6 | 32.1 | 30.0 | 43.1 | −1.9 | 9.6 | 9.4 |
| LCL 5 | −2.6 | 26.3 | 25.2 | −23.7 | 10.7 | 25.8 | −0.5 | 9.8 | 9.4 |
| LCL 6 | −52.3 | 24.9 | 57.0 | −81.0 | 64.1 | 99.9 | 0.05 | 4.8 | 4.3 |
| LCL 7 | 33.1 | 27.9 | 42.6 | 24.8 | 13.2 | 27.8 | −0.1 | 9.8 | 9.3 |
| LCL 8 | 20.6 | 52.7 | 54.1 | 17.1 | 45.1 | 46.0 | −0.05 | 20.5 | 19.4 |
| Overall | 10.8 | 40.4 | 41.6 | −5.3 | 34.9 | 45.9 | −0.4 | 14.3 | 14.2 |
DISCUSSION
Previous studies have shown a relationship between shear wave speed and tension in intact tendons and collateral ligaments.29,30 In this study, we sought to determine whether this relationship held in collateral ligaments following incremental releases. The first key finding was that there were linear relationships between shear wave speed squared and tension in both the MCL and the LCL following incremental releases. The second key finding was that ligament tension could be predicted from the measured shear wave speeds to within 26.2 N for the MCL and 14.2 N for the LCL.
Regarding the first key finding, we demonstrated that the tensioned beam model,29 shown previously to hold in intact ligaments,30 also applies to ligaments damaged by iterative releases. Our extension of shear wave tensiometry to ligaments damaged by needle punctures suggests that our technique could also work in ligaments damaged by other means (e.g., ligament sprain). The individual R2-values for the LCL (0.94 ± 0.07) are consistent with previous studies using shear wave tensiometry to measure intact MCLs and LCLs (R2 = 0.94 and 0.98, respectively) and porcine digital flexor tendons (mean R2 = 0.96–0.98).29,30,40 However, the individual R2-values for the MCL (0.76 ± 0.18) are on average lower than those both for the LCL in the present study and for both the MCL and LCL from previous studies.30 One possible explanation for these lower R2-values in the MCL compared to those in the LCL is that the fibers in the MCL might engage more non-uniformly than fibers in the LCL. We are not aware of any studies that have characterized ligament fiber engagement in porcine collateral ligaments, but assuming that the engagement patterns are similar to those in human collateral ligaments, the fibers of the MCL will engage less uniformly across the width of ligament compared to those in the LCL due to the wider footprint of the MCL.41,42 This non-uniform engagement of fibers in the MCL could increase the variability of the measured shear wave speeds after releases because each puncture could have a different impact on shear wave propagation depending on whether the needle severed a tighter or looser fiber. Investigating these regional differences is beyond the scope of the present study, but regional differences are a topic of ongoing research in our lab.
The range of shear wave speeds in the present study were lower than that in a previous study with intact porcine ligaments.30 In the present study, the shear wave speeds ranged from 14.3 to 46.5 m/s, whereas Blank et al. measured shear wave speeds in intact ligaments to be 32.5 to 160.3 m/s for the same load range.30 The primary difference between the two studies is the sensors used to track shear wave propagation. Blank et al. tracked shear wave propagation with laser Doppler vibrometers,30 a non-contact measurement technique. We tracked shear wave propagation with accelerometers, a contact measurement technique. The contacting accelerometers likely increase inertia and damping present in the system. The tensioned beam model suggests that the effective material density is the constant of proportionality between shear wave speed squared and stress.29 Effective material density includes both the material density and inertia of the surroundings. For example, a previous study showed that shear wave speeds in porcine digital flexor tendons immersed in a saline were 22% less than those measured in air.40 In the present study, we expect the added mass of the tensiometer components (Figure 1) to be greater than that of saline surrounding the tissue, which likely explains why the range of our shear wave speeds are on average 75% lower than those measured with laser Doppler vibrometers in air.30 Inherent damping due to the contact tensiometer may also alter the frequency content of the vibration measured at the two sensors, and thereby alter the wave speed as ascertained from the transient vibrations. The potential added-mass and damping effect indicates that the shear wave speeds measured are dependent on the tensiometer design, and care must be taken to consider such effects when interpreting wave speed measures in tensioned tissues.
Regarding the second key finding, our errors in predicting tension in a released ligament (14.2 to 45.9 N) are comparable to current intraoperative measurements of tibiofemoral contact forces (VERASENSE, OrthoSensor, Inc).43 Intraoperatively, tibiofemoral contact forces are largely determined by the tension in all the ligaments. A recent study showed that the best-case RMSE for contact force of the femur on the tibia within a compartment measured by the VERASENSE was 13.8 N.44 Prior studies have used the VERASENSE to distinguish between satisfied and dissatisfied patients;45 hence these errors are likely acceptable for detecting clinically relevant changes in ligament tension. Assuming the resting tension in the collateral ligaments is 50 N,36 a ligament-specific calibration (Case 3, Tables 1 and 2) is likely necessary to detect clinically important changes in ligament tension. Errors using a non-ligament specific calibration (Cases 1 and 2, Tables 1 and 2) might be too large to detect clinically important changes in ligament tensions. However, further work is needed to determine what is a clinically important change in ligament tension, and whether optimization of our tensiometer will be required before translation into the clinic.
There are several ways to calibrate the shear wave tensiometer to predict tension based on shear wave speed measurements. However, achieving the minimum errors reported requires a ligament-specific calibration. Because shear wave tensiometry has been shown to track tension using shear wave speed squared in both intact30 and released ligaments, one possible option to calibrate shear wave speeds in a particular ligament that is to be released is to calibrate the shear wave speed-tension relationship during a laxity assessment before release. The tension in the ligament pre-release could be estimated based on the applied load and the patient’s anatomy.46 The shear wave speed-tension relationship pre-release could then be determined using a regression between shear wave speed squared and the estimated tension, and this pre-release relationship could then be used to determine reductions in tension following iterative releases.
Three limitations should be considered when interpreting our findings. First, we performed these measurements in porcine ligaments rather than human ligaments. The human MCL, in particular, has a greater aspect ratio (average human = 15.347 and average porcine MCL = 3.0; Supplement E, Tables S-2 and S-3), which may lead to a greater non-uniformity of fiber engagement. Further investigation is needed to ascertain whether the larger aspect ratio results in more variable effects of a needle puncture. The similar mechanical behavior between human and porcine MCLs31 suggests that human ligaments would also demonstrate a predictable reduction in shear wave speed with ligament releases, but that the absolute changes in shear wave speed may differ from those determined in the present study.
The second limitation is that we studied isolated ligaments in the present study, which do not match the boundary conditions of ligaments in vivo. One difference between our isolated ex vivo setup and in vivo conditions is that there are tissues surrounding the ligament in vivo. Prior work comparing shear wave speeds in a tendon that is in or out of a water bath40 suggests that shear wave speeds are reduced by the added mass of surrounding media. Thus, we expect that the superficial tissue will systematically reduce the shear wave speeds, but will likely not impede the sensor’s ability to detect tension changes. Further investigation is needed to characterize this relationship in situ/in vivo because surgeons do not remove superficial tissue (e.g., overlying fat, tendons crossing over collateral ligaments) during TKAs. A second difference between our isolated ex vivo setup and in vivo conditions is the uniformity of tension across the width of ligaments. It is likely that a non-uniform tension gradient exists in ligaments in vivo due to the width of their attachments.42,48 It is likely that some non-uniformity was present in the ligaments in this study because we assessed the tension gradient by palpating fibers across the width of the ligament. In terms of the conclusions of the present study, the effect of any residual non-uniformity of the load distribution across the ligaments is systematic across release levels, and thus, is removed when we analyzed changes between release levels. In terms of future translation to in situ loading conditions, our preliminary studies in non-uniformly loaded tissues suggest that non-uniform tension gradients do not prevent us from tracking ligament tension. We chose to isolate ligaments in the present study to remove potential confounding effects from this initial study of shear wave tensiometry in ligaments following release. Now that we have shown that the relationship between shear wave speed and tension holds in isolated ligaments following release, we are able to take the next steps in exploring whether this relationship changes in conditions more similar to those during surgery.
The third limitation is that we were unable to directly compare our errors in predicted tension to clinically relevant changes in ligament tension. We were unable to make this comparison because we are not aware of any previous studies that have directly connected changes in ligament tension to patient-reported outcomes (e.g., stiffness or pain) or risk of implant failure. However, prior studies using instrumented tibial trials (VERASENSE, OrthoSensor, Inc) with comparable errors to those determined in the present study were able to distinguish between satisfied and dissatisfied patients.45 Thus, we expect that we should also be able to detect clinically meaningful differences in ligament tension. However, as mentioned previously, further improvements in our sensor will be necessary if future studies determine that the tolerance of optimal ligament tensions are on the order of our reported errors.
In conclusion, this study showed that shear wave tensiometry can track reductions in tension due incremental releases of the MCL and LCL within 26.2 N and 14.2 N, respectively (10.5 and 5.7% of the initial 250-N tension). The strength of the relationship between shear wave speed and tension was similar following release to that seen previously in intact ligaments.30 Additional in situ and in vivo studies validating the use of shear wave tensiometry for tracking ligament tensions before and after releases are needed before clinical translation.
Supplementary Material
ACKNOWLEDGMENTS
This work was supported by the National Institute of Biomedical Imaging and Bioengineering (NIBIB) of the National Institutes of Health under award number R21EB024957. Two of the authors (JDR and DGT) are co-inventors on a pending patent application for technology relating to the methods described herein.
REFERENCES
- 1.Gu Y, Howell SM, Hull ML. 2017. Simulation of total knee arthroplasty in 5 degrees or 7 degrees valgus: A study of gap imbalances and changes in limb and knee alignments from native. J Orthop Res 35:2031–2039. [DOI] [PubMed] [Google Scholar]
- 2.Gu Y, Roth JD, Howell SM, et al. 2014. How Frequently Do Four Methods for Mechanically Aligning a Total Knee Arthroplasty Cause Collateral Ligament Imbalance and Change Alignment from Normal in White Patients? J Bone Joint Surg Am 96:e101. [DOI] [PubMed] [Google Scholar]
- 3.Roth JD, Howell SM, Hull ML. 2015. Native Knee Laxities at 0 degrees, 45 degrees, and 90 degrees of Flexion and Their Relationship to the Goal of the Gap-Balancing Alignment Method of Total Knee Arthroplasty. J Bone Joint Surg Am 97:1678–1684. [DOI] [PubMed] [Google Scholar]
- 4.Bellemans J, Colyn W, Vandenneucker H, et al. 2012. The Chitranjan Ranawat Award: is neutral mechanical alignment normal for all patients?: the concept of constitutional varus. Clinical Orthopaedics and Related Research® 470:45–53. [DOI] [PMC free article] [PubMed] [Google Scholar]
- 5.Fishkin Z, Miller D, Ritter C, et al. 2002. Changes in human knee ligament stiffness secondary to osteoarthritis. J Orthop Res 20:204–207. [DOI] [PubMed] [Google Scholar]
- 6.Bellemans J, Vandenneucker H, Vanlauwe J, et al. 2010. The influence of coronal plane deformity on mediolateral ligament status: an observational study in varus knees. Knee Surg Sports Traumatol Arthrosc 18:152–156. [DOI] [PubMed] [Google Scholar]
- 7.Peters CL, Jimenez C, Erickson J, et al. 2013. Lessons learned from selective soft-tissue release for gap balancing in primary total knee arthroplasty: an analysis of 1216 consecutive total knee arthroplasties: AAOS exhibit selection. J Bone Joint Surg Am 95:e152. [DOI] [PMC free article] [PubMed] [Google Scholar]
- 8.Bellemans J, Vandenneucker H, Van Lauwe J, et al. 2010. A new surgical technique for medial collateral ligament balancing: multiple needle puncturing. J Arthroplasty 25:1151–1156. [DOI] [PubMed] [Google Scholar]
- 9.Mihalko WM, Woodard EL, Hebert CT, et al. 2015. Biomechanical validation of medial pie-crusting for soft-tissue balancing in knee arthroplasty. J Arthroplasty 30:296–299. [DOI] [PubMed] [Google Scholar]
- 10.Koh IJ, Kwak DS, Kim TK, et al. 2014. How effective is multiple needle puncturing for medial soft tissue balancing during total knee arthroplasty? A cadaveric study. J Arthroplasty 29:2478–2483. [DOI] [PubMed] [Google Scholar]
- 11.Roussignol X, Gauthe R, Rahali S, et al. 2015. Opening the medial tibiofemoral compartment by pie-crusting the superficial medial collateral ligament at its tibial insertion: a cadaver study. Orthop Traumatol Surg Res 101:529–533. [DOI] [PubMed] [Google Scholar]
- 12.de Mont-Marin GD, Babusiaux D, Brilhault J. 2016. Medial collateral ligament lengthening by standardized pie-crusting technique: a cadaver study. Orthopaedics & Traumatology: Surgery & Research 102:S209–S212. [DOI] [PubMed] [Google Scholar]
- 13.Iamthanaporn K, Geater A, Yuenyongviwat V. 2018. Predictability of open superficial medial collateral ligament lengthening technique in total knee arthroplasty. Comparison of multiple needle puncturing and subperiosteal elevation: A cadaver study. Orthop Traumatol Surg Res 104:977–982. [DOI] [PubMed] [Google Scholar]
- 14.Meneghini RM, Daluga AT, Sturgis LA, et al. 2013. Is the pie-crusting technique safe for MCL release in varus deformity correction in total knee arthroplasty? The Journal of arthroplasty 28:1306–1309. [DOI] [PubMed] [Google Scholar]
- 15.Ahn JH, Yang TY, Lee JY. 2016. Reduction Osteotomy vs Pie-Crust Technique as Possible Alternatives for Medial Release in Total Knee Arthroplasty and Compared in a Prospective Randomized Controlled Trial. J Arthroplasty 31:1470–1475. [DOI] [PubMed] [Google Scholar]
- 16.Deakin AH, Smith MA, Wallace DT, et al. 2019. Fulfilment of preoperative expectations and postoperative patient satisfaction after total knee replacement. A prospective analysis of 200 patients. Knee 26:1403–1412. [DOI] [PubMed] [Google Scholar]
- 17.Baker PN, van der Meulen JH, Lewsey J, et al. 2007. The role of pain and function in determining patient satisfaction after total knee replacement. Data from the National Joint Registry for England and Wales. J Bone Joint Surg Br 89:893–900. [DOI] [PubMed] [Google Scholar]
- 18.Gustke KA, Golladay GJ, Roche MW, et al. 2014. A new method for defining balance: promising short-term clinical outcomes of sensor-guided TKA. J Arthroplasty 29:955–960. [DOI] [PubMed] [Google Scholar]
- 19.Bourne RB, Chesworth BM, Davis AM, et al. 2010. Patient satisfaction after total knee arthroplasty: who is satisfied and who is not? Clin Orthop Relat Res 468:57–63. [DOI] [PMC free article] [PubMed] [Google Scholar]
- 20.Scott CE, Howie CR, MacDonald D, et al. 2010. Predicting dissatisfaction following total knee replacement: a prospective study of 1217 patients. J Bone Joint Surg Br 92:1253–1258. [DOI] [PubMed] [Google Scholar]
- 21.Casino D, Zaffagnini S, Martelli S, et al. 2009. Intraoperative evaluation of total knee replacement: kinematic assessment with a navigation system. Knee Surg Sports Traumatol Arthrosc 17:369–373. [DOI] [PubMed] [Google Scholar]
- 22.Siston RA, Maack TL, Hutter EE, et al. 2012. Design and cadaveric validation of a novel device to quantify knee stability during total knee arthroplasty. J Biomech Eng 134:115001. [DOI] [PMC free article] [PubMed] [Google Scholar]
- 23.Fujimoto E, Sasashige Y, Tomita T, et al. 2016. Intra-operative gaps affect outcome and postoperative kinematics in vivo following cruciate-retaining total knee arthroplasty. Int Orthop 40:41–49. [DOI] [PubMed] [Google Scholar]
- 24.Nowakowski AM, Majewski M, Muller-Gerbl M, et al. 2012. Measurement of knee joint gaps without bone resection: “physiologic” extension and flexion gaps in total knee arthroplasty are asymmetric and unequal and anterior and posterior cruciate ligament resections produce different gap changes. J Orthop Res 30:522–527. [DOI] [PubMed] [Google Scholar]
- 25.Daines BK, Dennis DA. 2014. Gap balancing vs. measured resection technique in total knee arthroplasty. Clin Orthop Surg 6:1–8. [DOI] [PMC free article] [PubMed] [Google Scholar]
- 26.Elmallah RK, Mistry JB, Cherian JJ, et al. 2016. Can We Really “Feel” a Balanced Total Knee Arthroplasty? J Arthroplasty 31:102–105. [DOI] [PubMed] [Google Scholar]
- 27.Verstraete MA, Meere PA, Salvadore G, et al. 2017. Contact forces in the tibiofemoral joint from soft tissue tensions: Implications to soft tissue balancing in total knee arthroplasty. J Biomech 58:195–202. [DOI] [PubMed] [Google Scholar]
- 28.Camarata DA. 2014. Soft tissue balance in total knee arthroplasty with a force sensor. Orthop Clin North Am 45:175–184. [DOI] [PubMed] [Google Scholar]
- 29.Martin JA, Brandon SCE, Keuler EM, et al. 2018. Gauging force by tapping tendons. Nat Commun 9:1592. [DOI] [PMC free article] [PubMed] [Google Scholar]
- 30.Blank JL, Thelen DG, Roth JD. 2020. Shear wave speeds track axial stress in porcine collateral ligaments. J Mech Behav Biomed Mater 105:103704. [DOI] [PMC free article] [PubMed] [Google Scholar]
- 31.Germscheid NM, Thornton GM, Hart DA, et al. 2011. A biomechanical assessment to evaluate breed differences in normal porcine medial collateral ligaments. J Biomech 44:725–731. [DOI] [PubMed] [Google Scholar]
- 32.Moon DK, Woo SL, Takakura Y, et al. 2006. The effects of refreezing on the viscoelastic and tensile properties of ligaments. J Biomech 39:1153–1157. [DOI] [PubMed] [Google Scholar]
- 33.Woo SL, Orlando CA, Camp JF, et al. 1986. Effects of postmortem storage by freezing on ligament tensile behavior. J Biomech 19:399–404. [DOI] [PubMed] [Google Scholar]
- 34.Blank J, Thelen DG, Roth JD. 2019. Ligament Shear Wave Speeds are Sensitive to Tensiometer-Tissue Interactions: A Parametric Modeling Study. CMBBE. New York City, New York. [Google Scholar]
- 35.ASTM E. 2013. 177–13. Standard Practice for Use of the Terms Precision and Bias in ASTM Test Methods.
- 36.Elmasry SS, Chalmers BP, Kahlenberg CA, et al. 2021. Simulation of preoperative flexion contracture in a computational model of total knee arthroplasty: Development and evaluation. J Biomech 120:110367. [DOI] [PMC free article] [PubMed] [Google Scholar]
- 37.Cespedes I, Huang Y, Ophir J, et al. 1995. Methods for estimation of subsample time delays of digitized echo signals. Ultrason Imaging 17:142–171. [DOI] [PubMed] [Google Scholar]
- 38.Faul F, Erdfelder E, Buchner A, et al. 2009. Statistical power analysis using G* Power 3.1: Tests for correlation and regression analysis. Behavioral Research Methods, 41, 1149–1160. [DOI] [PubMed] [Google Scholar]
- 39.Standardization IOf. 1994. ISO 5725-1: 1994: accuracy (trueness and precision) of measurement methods and results-part 1: general principles and definitions: International Organization for Standardization;
- 40.Martin JA, Schmitz DG, Ehlers AC, et al. 2019. Calibration of the shear wave speed-stress relationship in ex vivo tendons. J Biomech 90:9–15. [DOI] [PMC free article] [PubMed] [Google Scholar]
- 41.Gardiner JC, Weiss JA. 2003. Subject-specific finite element analysis of the human medial collateral ligament during valgus knee loading. J Orthop Res 21:1098–1106. [DOI] [PubMed] [Google Scholar]
- 42.Willinger L, Shinohara S, Athwal KK, et al. 2020. Length-change patterns of the medial collateral ligament and posterior oblique ligament in relation to their function and surgery. Knee Surgery, Sports Traumatology, Arthroscopy 28:3720–3732. [DOI] [PMC free article] [PubMed] [Google Scholar]
- 43.Gustke K 2012. Use of smart trials for soft-tissue balancing in total knee replacement surgery. J Bone Joint Surg Br 94:147–150. [DOI] [PubMed] [Google Scholar]
- 44.Nicolet-Petersen SJ, Howell SM, Hull M. 2018. Force and Contact Location Measurement Errors of the VERASENSE. J Biomech Eng 140:124502-124502-124506. [DOI] [PubMed] [Google Scholar]
- 45.Gustke KA, Golladay GJ, Roche MW, et al. 2014. Increased satisfaction after total knee replacement using sensor-guided technology. Bone Joint J 96-B:1333–1338. [DOI] [PubMed] [Google Scholar]
- 46.Grood ES, Noyes FR, Butler DL, et al. 1981. Ligamentous and capsular restraints preventing straight medial and lateral laxity in intact human cadaver knees. J Bone Joint Surg Am 63:1257–1269. [PubMed] [Google Scholar]
- 47.Wilson WT, Deakin AH, Payne AP, et al. 2012. Comparative analysis of the structural properties of the collateral ligaments of the human knee. J Orthop Sports Phys Ther 42:345–351. [DOI] [PubMed] [Google Scholar]
- 48.Meister BR, Michael SP, Moyer RA, et al. 2000. Anatomy and kinematics of the lateral collateral ligament of the knee. Am J Sports Med 28:869–878. [DOI] [PubMed] [Google Scholar]
- 49.Crameri F, Shephard GE, Heron PJ. 2020. The misuse of colour in science communication. Nat Commun 11:5444. [DOI] [PMC free article] [PubMed] [Google Scholar]
Associated Data
This section collects any data citations, data availability statements, or supplementary materials included in this article.