

Abstract
Background
Neuroendocrine carcinomas of the gastrointestinal tract (GI‐NECs) remain a disease of grim prognosis with limited therapeutic options. Their molecular characteristics are still undefined. This study aimed to explore the underlying genetic basis and heterogeneity of GI‐NECs.
Methods
Comprehensive genomic analysis using whole‐exome sequencing was performed on 143 formalin‐fixed, paraffin‐embedded samples of surgically resected GI‐NEC with a thorough histological evaluation. Mutational signatures, somatic mutations, and copy number aberrations were analyzed and compared across anatomic locations and histological subtypes. Survival analysis was conducted to identify the independent factors.
Results
In total, 143 GI‐NECs were examined: the stomach, 87 cases (60.8%); the esophagus, 29 cases (20.3%); the colorectum, 20 cases (14.0%); and the small intestine, 7 cases (4.9%). Eighty‐three (58.0%) and 60 (42.0%) cases were subclassified into small cell and large cell subtypes, respectively. GI‐NECs showed distinct genetic alterations from their lung counterparts and non‐neuroendocrine carcinomas in the same locations. Obvious heterogeneity of mutational signatures, somatic mutations, and copy number variations was revealed across anatomic locations rather than histological subtypes. Except for tumor protein p53 (TP53) and retinoblastoma 1 (RB1), the most frequently mutated genes in the stomach, esophagus, colorectum, and small intestine were low‐density lipoprotein receptor‐related protein 1B (LRP1B), notch receptor 1 (NOTCH1), adenomatosis polyposis coli (APC), catenin beta 1 (CTNNB1), respectively. Mutations in the WNT‐β‐catenin, NOTCH and erythroblastic leukemia viral oncogene B (ERBB) pathways were prevalently identified in gastric, esophageal, and colorectal NECs, respectively. Importantly, 104 (72.7%) GI‐NECs harbored putative clinically relevant alterations, and non‐gastric location and RB1 bi‐allelic inactivation with copy number alterations were identified as two independent poor prognostic factors. Furthermore, we found that tumor cells in GI‐NECs first gain clonal mutations in TP53, RB1, NOTCH1 and APC, followed by subsequent whole‐genome doubling (WGD) and post‐WGD clonal mutations in LRP1B, CUB and Sushi multiple domains 3 (CSMD3), FAT tumor suppressor homolog 4 (FAT4) and erb‐b2 receptor tyrosine kinase 4 (ERBB4), and finally develop subclonal mutations.
Conclusions
GI‐NECs harbor distinct genomic landscapes and demonstrate significant genetic heterogeneity across different anatomic locations. Moreover, potentially actionable alterations and prognostic factors were revealed for GI‐NECs.
Keywords: Neuroendocrine carcinomas, Gastrointestinal tract, Genomic characterization, Heterogeneity, Therapeutic implications
Abbreviations
- L‐LCNECs
large cell neuroendocrine carcinomas of the lung
- WES
whole‐exome sequencing
- PCAWG
Pan‐Cancer Analysis of Whole Genomes
- SBS
single‐base substitution
- COSMIC
Catalogue of Somatic Mutations in Cancer
- YAPSA
Yet Another Package for Signature Analysis
- SNVs
single nucleotide variants
- Indels
small insertions and deletions
- CIViC
Clinical Interpretation of Variants in Cancer
- CGI
Cancer Genome Interpreter
- IntOGEN
Integrative Onco‐Genomics
- FATHMM‐MKL
Functional Analysis through Hidden Markov Models
- SIFT
Sorting Intolerant from Tolerant
- PolyPhen‐2
Polymorphism Phenotyping version 2
- TCGA
The Cancer Genome Atlas
- Mb
megabase
- TMB
tumor mutation burden
- MSI
microsatellite instability
- KEGG
Kyoto Encyclopedia of Genes and Genomes
- CNVs
copy number variations
- PHIAL
Precision Heuristics for Interpreting the Alteration Landscape
- WGD
Whole Genome Doubling
- OS
overall survival
- PFS
progression‐free survival
1. BACKGROUND
Neuroendocrine neoplasms (NENs) of the gastrointestinal (GI) tract are a rare, heterogeneous group of tumors that originate from the diffuse neuroendocrine system of the GI tract. NENs of the GI tract (GI‐NENs) are broadly classified into two distinct histopathological and molecular subtypes: well‐differentiated neuroendocrine tumors (NETs) and poorly‐differentiated neuroendocrine carcinomas (NECs) [1]. NECs of the GI tract (GI‐NECs) are further separated into small cell neuroendocrine carcinomas (GI‐SCNECs) and large cell neuroendocrine carcinomas (GI‐LCNECs) based on histological criteria similar to small cell lung cancers (SCLCs) and large cell neuroendocrine carcinomas of the lung (L‐LCNECs).
GI‐NECs are characterized by highly aggressive clinical behaviors and poor prognosis, currently lacking therapeutic options. The systemic treatment of GI‐NECs has, to date, been driven by the experience in SCLCs [2], whereas GI‐NECs are staged using the staging systems for other primary carcinomas at the same locations. More effective and precise treatment strategies and prognostic stratification tailored for GI‐NECs are urgently needed. However, the molecular features of GI‐NECs have not been well clarified. Moreover, little information is known about the molecular heterogeneity among different anatomic locations or histological subtypes of GI‐NECs, which also have important clinical implications for diagnosis and therapy.
NECs are most common and have been best characterized in the lung and pancreas [3, 4, 5]. Recently, several studies have explored the genetic features of GI‐NENs [6, 7]. However, their analyses mainly focused on the molecular differences between low‐grade NETs and high‐grade NECs and/or between GI‐NENs and pancreatic NENs, which did not analyze GI‐NECs separately from pancreatic NECs, GI‐NETs, or Grade 3 NETs. These studies were also limited by small sample sizes of GI‐NECs, targeted sequencing strategies which only focus on a selected set of genes or gene regions, and/or lacking analyses of the heterogeneity among different anatomic locations or histological subtypes [6, 7, 8, 9, 10, 11]. In addition, small biopsy specimens were utilized in these studies, making it unreliable to distinguish GI‐NECs from Grade 3 NETs or mixed neuroendocrine tumors, and distinguish GI‐SCNECs from GI‐LCNECs.
Herein, we performed a comprehensive genomic profiling of surgically resected GI‐NECs in a relatively large, multicenter, retrospective cohort using whole‐exome sequencing (WES), and we compared our data with previously published lung NECs and non‐neuroendocrine carcinomas (non‐NECs) of the GI tract, aiming to determine the molecular features of GI‐NECs, clarify their location (the stomach, esophagus, colorectum, and small intestine) and histological heterogeneity (GI‐SCNECs and GI‐LCNECs), and further explore their potential clinical significance. The present study used only surgical resection specimens for a thorough histological evaluation to exclude Grade 3 NETs and mixed neuroendocrine/non‐neuroendocrine carcinomas that have contaminated previous studies of this cancer type, and to accurately distinguish between SCNECs and LCNECs.
2. MATERIALS AND METHODS
2.1. Patients and samples
Surgical resection specimens of GI‐NEN diagnosed between October 2008 and December 2019 were retrospectively collected from eight tertiary medical centers in China. Pathological review was conducted as per the World Health Organization (WHO) 2019 classification [1, 12]. All slides were examined by two experienced pathologists independently (HW and JW). If there was no agreement on the pathological diagnoses, a third expert pathologist (ZL) would review the case to achieve a majority vote. Low‐grade NEN (Grade 1‐2 NET), high‐grade NEN (Grade 3 NET), high‐grade NEN with ambiguous morphology between Grade 3 NET and NEC, and NEC with admixed adenocarcinoma or squamous cell carcinoma component were excluded. Finally, only patients with a confirmed diagnosis of pure GI‐NECs were enrolled, and all GI‐NECs were histologically classified into either GI‐LCNECs or GI‐SCNECs (Figure 1). All patients had not received neoadjuvant therapy. Paired formalin‐fixed, paraffin‐embedded (FFPE) tumor and adjacent normal tissues were collected for whole‐exome sequencing. This study was approved by the institutional review board of Peking Union Medical College Hospital (Beijing, China), and written informed consent were obtained from all study participants for the use of tissue samples.
FIGURE 1.
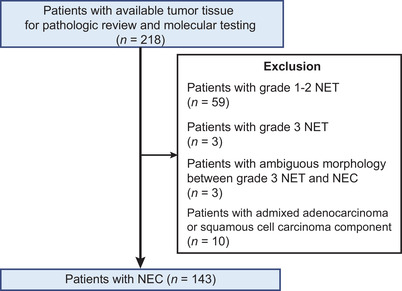
Flow diagram of sample selection in the present study.
Abbreviations: NET, neuroendocrine tumors; NEC, neuroendocrine carcinomas.
2.2. Library construction and whole‐exome sequencing
DNA was extracted using TIANamp Genomic DNA kit (DP304, Tiangen Biotech, Beijing, China) as per manufacturer's instructions, and then fragmented, purified and size‐selected (100‐250 bp). The purity and concentration of DNA were determined using Nanodrop 2000 spectrophotometer (ND2000, Thermo Fisher Scientific, Waltham, MA, USA) and Qubit 2.0 Fluorometer (Q32866, Thermo Fisher Scientific) with Quanti‐IT dsDNA HS Assay Kit (Q33120, Thermo Fisher Scientific). At least 10 ng DNA was required to prepare sequencing libraries. Library construction was then performed using a custom 53M length capturing probe (Integrated DNA Technologies, Coralville, IA, USA). Samples with a DNA library concentration ≥20 ng/uL were then subjected to sequencing. Captured libraries were then pair‐end sequenced in 2◊ 100‐bp lengths with Geneplus‐2000 sequencing platform (Geneplus, Beijing, China), based on MGI DNBSEQ‐G400 sequencer (https://en.mgi‐tech.com/products/) which utilized DNA nano‐ball (DNB) preparation technology and fluorescent signal detection for base calling. Raw data were filtered using fastp (version 1) to remove: (a) reads containing adaptor; (b) reads with proportions of N base (unsure base) > 10% of the total lengths; (c) single‐end reads with proportions of low‐quality base (Phred score < 5) > 50% of the total lengths. Only samples with proportions of high‐quality reads (Phred score >30) ≥80% of the total reads and successfully sequenced data of both tumor and normal tissue samples were kept for further analysis. Clean reads were then mapped to the reference human genome (hg19) and re‐ordered (with duplicate reads marked) utilizing Burrows‐Wheeler Alignment (BWA version 0.7.10) (https://sourceforge.net/projects/bio‐bwa/files/). Duplicate reads were further removed, and local indel re‐alignment was performed using GATK (version 4.0) (https://github.com/broadinstitute/gatk/releases) in the mutation calling process. The mean coverage after deduplication was 381◊ (standard deviation = 115.79) for tumor tissues and 188◊ (standard deviation = 58.28) for paired normal tissues. The details of the quality assessment are presented in Supplementary Table S1. Default parameters were used in the present study for all software tools unless otherwise specified in Supplementary Table S2.
2.3. Detection of somatic mutations
Somatic single nucleotide variants (SNVs) and small insertions and deletions (Indels) were detected using MuTect (version 1.1.4) packed in GATK (version 4.0). Variants were filtered out as previously reported [13, 14]. All variants were first filtered based on the following criteria: (a) allele frequencies ≥ 0.01; (b) allele frequencies ≤ 0.001 in the 1000 Genomes Project Consortium (https://www.internationalgenome.org/), the Genome Aggregation Database (http://gnomad.broadinstitute.org) and the Exome Aggregation Consortium (http://gnomad.broadinstitute.org); (c) located in the coding region of the genome. For cancer‐associated genes, candidate variants had to be present in genes characterized in either COSMIC Cancer Gene Census (CGC) (Tier 1 and 2 genes) (https://cancer.sanger.ac.uk/cosmic/census) [15], OncoKB (https://www.oncokb.org/cancerGenes), Clinical Interpretation of Variants in Cancer (CIvic) (https://civicdb.org/genes/home), Cancer Genome Interpreter (CGI) (https://www.cancergenomeinterpreter.org/2018/genes) or Integrative Onco‐Genomics (IntOGEN) (https://www.intogen.org/download). Nonsense mutations, canonical splice‐site mutations, and in‐frame/frame‐shift Indels were kept. Missense mutations were kept only when they were reported in COSMIC Cancer Mutation Census (https://cancer.sanger.ac.uk/cmc/home) with a Functional Analysis through Hidden Markov Models (FATHMM‐MKL) (http://fathmm.biocompute.org.uk/fathmmMKL.htm) score of >0.5; or classified as deleterious by at least two of the three in‐silico algorithms: Sorting Intolerant from Tolerant (SIFT), Polymorphism Phenotyping version 2 (PolyPhen‐2) and FATHMM‐MKL.
External mutation data were either downloaded from The Cancer Genome Atlas (TCGA) database (https://portal.gdc.cancer.gov/) or published datasets (L‐LCNEC: Miyoshi et al. [16], 78 cases; Rizvi et al. [17], 7 cases; SCLC: Miyoshi et al. [16], 90 cases, George et al. [4], 110 cases). The mutation profiles of GI‐NECs were compared with those of non‐NECs at the same locations and lung NECs. The number of somatic coding non‐synonymous SNVs and Indels per megabase (Muts/Mb) was gauged as tumor mutation burden (TMB). Microsatellite instability (MSI) status was determined utilizing MSIsensor (version 0.2) [18].
2.4. Mutational signature analysis
The trinucleotide mutational patterns were matched to 47 Pan‐Cancer Analysis of Whole Genomes (PCAWG) single‐base substitution (SBS) signatures from Catalogue of Somatic Mutations in Cancer (COSMIC) database (version 3.1) (June 2020) (https://cancer.sanger.ac.uk/signatures/sbs/) [19], using the R package Yet Another Package for Signature Analysis (YAPSA) (version 0.2.5) [20].
2.5. Recurrently mutated pathway analysis
ClusterProfiler (version 3.12.0) [21] was used to analyze the enrichment of mutated cancer‐associated genes. Mutated genes were compared with the Kyoto Encyclopedia of Genes and Genomes (KEGG) (http://www.genome.ad.jp/kegg/) and REACTOME databases (http://reactome.org) to determine the altered pathways. The P values of KEGG and REACTOME pathway enrichment were calculated based on hypergeometric distribution with false discovery rate (FDR) correction using the Benjamini and Hochberg method. Representative key signaling pathways with an FDR‐corrected P value < 0.05 were exhibited for different anatomic locations.
2.6. Analysis of somatic copy number variations (CNVs)
Arm‐level and focal CNVs were detected and analyzed by GATK (version 4.0) and GISTIC (version 2.0). Genes encompassed by focal CNVs were also inferred using GISTIC (version 2.0). Focal amplifications in canonical oncogenes and focal deletions in canonical tumor suppressor genes were then annotated according to COSMIC CGC cancer driver gene list. Significant somatic CNVs were analyzed in a group‐wise fashion using GISTIC (version 2.0). Somatic CNV events of each sample were also obtained using GISTIC (version 2.0) to reveal recurrent CNV events and compare the frequencies of CNV events across different anatomic locations, where P value was calculated by Fisher's exact test. The sample‐specific CNV data were also used to calculate CNV burden of each sample. A burden score was given to each CNV event based on the amplitude of the log2 copy number ratio of the varied region. Then the arm‐level or chromosomal‐level CNV burden of a sample was determined by summing up the scores of all arm‐level or chromosomal‐level CNV events identified in the sample [22]. The allele‐specific copy number analysis of Chr13q (retinoblastoma 1 [RB1])) and Chr17p (tumor protein p53 [TP53]) was performed by GATK (version 4.0) and ABSOLUTE (version 1.2), as follows: (a) deletion when both major and minor copy numbers of respective arm equal to 0; (b) loss of heterozygosity (LOH) when major and minor copy numbers equal to 1 and 0 accordingly; (c) copy neutral LOH when major and minor copy numbers equal to 2 and 0 accordingly; (d) LOH at higher ploidy when minor copy number equals to 0 whereas major copy number is more than 2.
2.7. Analysis of putative clinically relevant alterations
Somatic SNV/Indel and CNVs were analyzed by Precision Heuristics for Interpreting the Alteration Landscape (PHIAL) software (version 1.0.R) (https://github.com/vanallenlab/phial) with default parameters and database.
2.8. Clonal architecture and whole‐genome doubling (WGD) analysis
The clonal architecture of somatic alterations was inferred using the method described previously [23]. The identification of WGD and the temporal ordering of WGD with somatic mutations were performed as reported [24]. Cancer cell fractions of specific genes and WGD were estimated by GATK (version 4.0) together with ABSOLUTE (version 1.2). Events with estimated upper 95% confidence intervals of cancer cell fraction of 1 were defined as clonal, whereas the rest were defined as subclonal. WGD was defined as over 50% of the whole genome with a major copy number of 2 or more. The temporal order of the occurrence of mutations in relation to WGD was speculated by looking at the allelic copy numbers (ACN) of specific alterations and the total copy numbers (TCN) of the segment. Clonal mutations in regions with 1) TCN < 3 or 2) TCN = 3 and ACN ≤ 1 were determined as ambiguous and excluded from downstream analyses. Clonal mutations with TCN > 3 and ACN ≤ 1 were regarded as post‐WGD events. All other clonal mutations were considered as arising before WGD, whereas all subclonal mutations were considered as post‐WGD events. To test if mutations in specific driver genes were enriched before or after WGD across the cohort, the amounts of pre‐WGD mutations and post‐WGD mutations in specific genes were compared against the cumulative number of all pre‐WGD mutations and all post‐WGD mutations using Fisher's exact test with P value adjusted by Benjamini & Hochberg method.
Using the previously described method [23], the potential temporal order between two somatic mutations in cancer‐related genes (clonal‐subclonal pair) in the same patient was inferred. The clonal mutation was considered to occur earlier than the subclonal mutation during tumor evolution in the same patient. For two mutations in cancer‐associated genes A and B from the same patients, we counted the numbers of “A clonal‐B subclonal” and “A subclonal‐B clonal” pairs in these patients. When at least 3 of these pairs were observed in total, binomial tests were performed. Gene A was considered significantly more likely to mutate prior to B if an enrichment of “A clonal‐B subclonal” was found with statistical significance (P < 0.05). Based on these temporal ordering analyses of somatic mutations and WGD, we proposed the timeline model of mutation acquisitions during tumor evolution in GI‐NECs.
2.9. Statistical analyses
Student's t test and/or one‐way analysis of variance (ANOVA) was employed to compare the contributions of mutational signatures or TMB across cohorts. Two‐sided Mann‐Whitney and Fisher's exact tests were performed on Graphpad Prism (version 7.01, GraphPad Software, La Jolla, CA, USA) or R (version 3.6.1) to generate the P value in association analyses. Binomial tests were carried out on R. Progression‐free survival (PFS) was calculated from the date of surgery to the first documented local/distant recurrence or the last follow‐up (March 3, 2021). Overall survival (OS) was calculated from the date of surgery to death from any cause or the last follow‐up. Log‐rank tests were employed to compare the Kaplan‐Meier survival curves of patients on Graphpad Prism (version 8.0). Cox proportional hazards regression models were used to perform multivariate survival analysis. For all two‐sided tests, a P value < 0.05 was considered statistically significant. All data visualization was performed using Graphpad Prism or R.
3. RESULTS
3.1. Clinicopathologic characteristics
Among 218 GI‐NENs with surgical resection specimens, 143 were finally included in our series (Figure 1). Clinicopathologic characteristics are summarized (Table 1). Detailed clinicopathologic characteristics are presented in Supplementary Table S3. The median age at diagnosis was 65 (range, 45‐86) years, and 100 (69.9%) patients were male. The anatomic resection locations were distributed as follows: the stomach, 87 (60.8%); the esophagus, 29 (20.3%); the colorectum, 20 (14.0%); and the small intestine, 7 (4.9%). Eighty‐three (58.0%) cases (the stomach, 49; the esophagus, 22; the colorectum, 10; the small intestine, 2) were histologically classified into SCNECs, while the other 60 (42.0%) cases (the stomach, 38; the esophagus, 7; the colorectum, 10; the small intestine, 5) were diagnosed as LCNECs. Representative H&E images of SCNECs and LCNECs from four anatomic locations are presented in Supplementary Figure S1.
TABLE 1.
Clinicopathological characteristics of 143 patients with GI‐NEC
| Characteristics | Whole cohort [cases (%)] |
|---|---|
| Age (years) | |
| <60 | 37 (25.9) |
| ≥60 | 106 (74.1) |
| Sex | |
| Female | 43 (30.1) |
| Male | 100 (69.9) |
| Anatomic site | |
| Esophagus | 29 (20.3) |
| Stomach | 87 (60.8) |
| Small intestine | 7 (4.9) |
| Colorectum | 20 (14.0) |
| AJCC TNM stage | |
| I | 13 (9.1) |
| II | 28 (19.6) |
| III | 84 (58.7) |
| IV | 18 (12.6) |
| Ki‐67 index | |
| <55% | 22 (15.4) |
| ≥55% | 121 (84.6) |
| Histological type | |
| SCNEC | 83 (58.0) |
| LCNEC | 60 (42.0) |
Abbreviations: GI‐NECs, Neuroendocrine carcinomas of the gastrointestinal tract; AJCC, the American Joint Committee on Cancer; SCNEC, small cell neuroendocrine carcinomas; LCNEC: large cell neuroendocrine carcinomas.
3.2. Mutational signatures of GI‐NECs
Among 47 mutational signatures analyzed (Supplementary Table S3), the top five SBS mutational signatures in 143 GI‐NECs were SBS1 (age‐related spontaneous deamination of 5‐methylcytosine), SBS15, SBS10b (associated with polymerase epsilon exonuclease domain mutations), SBS39 (unknown etiology), and SBS6 (Supplementary Figure S2A‐B). Both SBS15 and SBS6 have been found to be related to defective DNA mismatch repair (MMR). Distinct patterns of mutational signatures were observed across different anatomic locations (Supplementary Figure S2C). Gastric and colorectal NECs had higher SBS1 activity compared to esophageal and small intestinal NECs, and a significant difference was observed between colorectal and esophageal NECs (P = 0.003) (Supplementary Figure S2D). Significant difference in SBS4 (associated with tobacco smoking behavior) exposure was observed between gastric and esophageal NECs (P = 0.003). SBS21 activity was significantly higher in small intestinal NECs compared to NECs at other locations (all P < 0.05). No significant difference in mutational signatures was observed between GI‐LCNECs and GI‐SCNECs (Supplementary Figure S2E‐F).
3.3. Overall landscape of somatic mutations in GI‐NECs
All somatic SNVs and Indels in 143 GI‐NECs are detailed in Supplementary Table S3. After applying our filtering strategy, 2106 SNVs and Indels were detected in 899 known cancer‐associated genes. TP53 was the most frequently mutated gene with a mutation frequency of 88.8% (127/143), followed by RB1 (36/143, 25.2%), adenomatosis polyposis coli (APC) (26/143, 18.2%), low‐density lipoprotein receptor‐related protein 1B (LRP1B) (22/143, 15.4%) and tumor suppressor homolog 4 (FAT4) (17/143, 11.9%) (Figure 2A). The mutation landscape varied substantially across different anatomic locations. Overall, only 7 genes (TP53, RB1, APC, piccolo presynaptic cytomatrix protein [PCLO], mucin 4, cell surface associated 4 [MUC4], mitogen‐activated protein kinase kinase kinase 13 [MAP3K13] and CUB and Sushi multiple domains 3 [CSMD3]) were mutated in all locations (Figure 2B, Supplementary Table S4). RB1 mutations were more prevalent in esophageal NECs than in gastric NECs (12/29, 41.4% vs. 16/87, 18.4%; P = 0.025) (Figure 2C). Notch receptor 1 (NOTCH1), FAT1, AT‐rich interaction domain 3A (ARID3A), and NFE2 like bZIP transcription factor 2 (NFE2L2) were more frequently mutated in esophageal NECs compared to GI‐NECs of other locations, and significant differences were revealed between esophageal and gastric NECs (all P < 0.05). Esophageal NECs also had a significantly higher frequency of NOTCH1 mutations than colorectal NECs (31.0% vs. 0; P = 0.003). LRP1B mutations were observed in 20/87 (23.0%) of gastric NECs, which was significantly higher than that of esophageal NECs (0/29) (P = 0.002). Notably, colorectal NECs harbored a drastically higher proportion of APC mutations (14/20, 70.0%) than the other groups (the stomach: 10/87, 11.5%, P < 0.001; the esophagus: 1/29, 3.4%, P < 0.001; the small intestine: 1/7, 14.3%, P = 0.024). Similar results or trends were observed for KRAS proto‑oncogene, GTPase (KRAS), B‐Raf proto‐oncogene, serine/threonine kinase (BRAF), F‐box and WD repeat domain containing 7 (FBXW7) (without statistical significance), SRY‐box transcription factor 9 (SOX9), and MAX dimerization protein MGA (MGA) mutations. Intriguingly, catenin beta 1 (CTNNB1) was mutated with a higher frequency in small intestinal NECs (2/7, 28.6%), although no statistical significance was found probably due to the small sample size.
FIGURE 2.
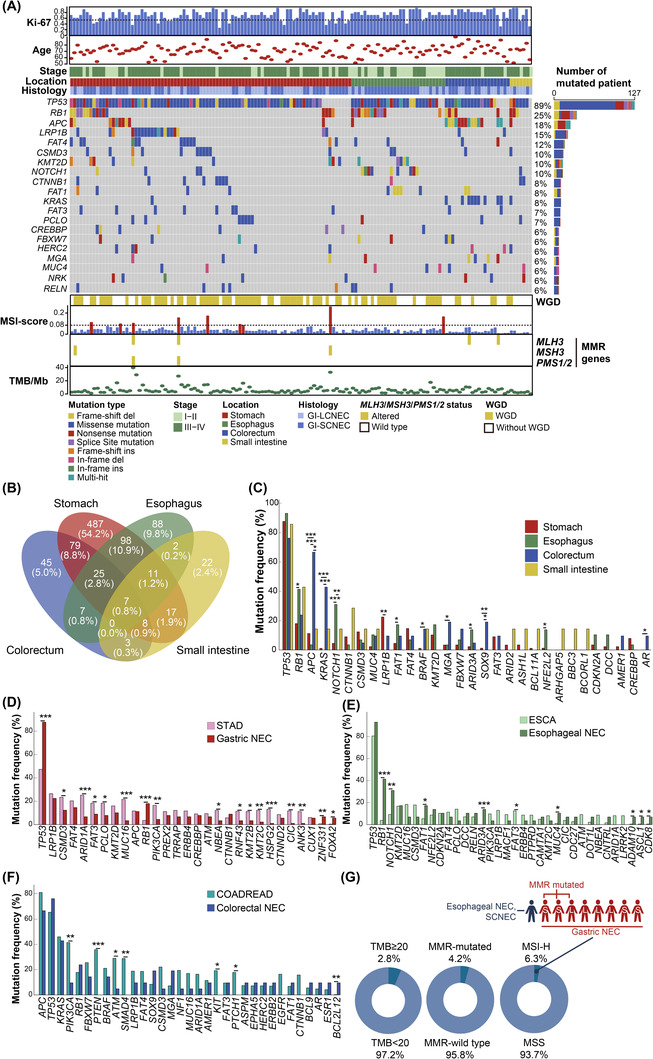
Mutation Landscape of 143 GI‐NECs. (A) Recurrently mutated cancer‐associated genes are displayed as an oncoplot. Samples are ordered by the locations. The clinicopathological data are shown at the top. WGD events, MSI score, somatic MMR gene mutations and TMB are displayed in the bottom panel. The horizontal dashed black lines indicate 55% for Ki‐67 and 0.08 for MSI score, respectively. (B) The Venn diagram shows shared and distinct mutated cancer‐associated genes across four anatomic locations. (C) Mutation frequencies of 30 top recurrently mutated cancer‐associated genes across four locations. (D) Comparison of mutation frequencies of top mutated cancer‐associated genes between gastric NECs (n = 87) and TCGA STAD cohort (n = 393). (E) Comparison of mutation frequencies of top mutated cancer‐associated genes between esophageal NECs (n = 29) and TCGA ESCA cohort (n = 185). (F) Comparison of mutation frequencies of top mutated cancer‐associated genes between colorectal NECs (n = 20) and TCGA COADREAD cohort (n = 489). (G) Percentage and distribution of GI‐NECs with TMB ≥ 20/Mb, somatic MMR gene mutations, and MSI‐H in our cohort.
Abbreviations: Ki‐67, marker of proliferation Ki‐67; WGD, Whole Genome Doubling; MSI, microsatellite instability; MMR, DNA mismatch repair; TMB, tumor mutation burden; TCGA, The Cancer Genome Atlas; NECs, neuroendocrine carcinomas; MLH3, MutL homolog 3; MSH3, MutS homolog 3; PMS1/2, homolog 1 or 2, mismatch repair system component.
Similar mutation profiles were observed between GI‐LCNECs and GI‐SCNECs, except for CTNNB1 and CUX1 (Supplementary Figure S3A‐B, Supplementary Table S4).
Mutations in genes other than previously identified cancer‐associated genes were also explored (Supplementary Figure S4). However, no highly recurrently mutated genes were revealed.
3.4. Comparison of somatic mutation landscape with non‐NECs and lung NECs
In view of the potential similarity, we compared the mutation profiles of 143 GI‐NECs at different anatomic locations with those of non‐NECs at the same locations using WES data of gastric adenocarcinoma (STAD, n = 393), esophageal carcinoma (ESCA, n = 185), and colorectal adenocarcinoma (colon adenocarcinoma, COAD, n = 367; rectal adenocarcinoma, READ, n = 122) from TCGA. Distinct mutation profiles between GI‐NECs and non‐NECs at the same locations were revealed. Although gastric NECs and STAD had similar LRP1B mutation frequency, mutations in TP53, RB1, zinc finger protein 331 (ZNF331) and forkhead box A2 (FOXA2) were significantly more prevalent in gastric NECs, whereas STAD had significantly higher mutation frequencies in multiple other genes, including CSMD3, AT‐rich interaction domain 1A (ARID1A), FAT3, PCLO, MUC16, phosphatidylinositol‐4,5‐bisphosphate 3‐kinase catalytic subunit alpha (PIK3CA), lysine methyltransferase 2B (KMT2B) and KMT2C (Figure 2D). Both esophageal NECs and ESCA had extremely high frequencies of TP53 mutations. However, RB1, NOTCH1, FAT1, ARID3A, MUC4, ADAM metallopeptidase domain 10 (ADAM10), achaete‐scute family bHLH transcription factor 1 (ASCL1) and cyclin dependent kinase 8 (CDK8) were more frequently mutated in esophageal NECs than in ESCA, whereas ESCA had a significantly higher frequency of FAT3 mutations (Figure 2E). For colorectal cancers, APC, TP53 and KRAS were the top three mutated genes for both colorectal NECs and colorectal adenocarcinomas with similar mutation frequencies (Figure 2F). Nevertheless, BCL2 like 12 (BCL2L12) mutations were significantly more frequent in colorectal NECs, whereas colorectal adenocarcinomas had significantly higher mutation frequencies in PIK3CA, phosphatase and tensin homolog (PTEN), ATM serine/threonine kinase (ATM), SMAD family member 4 (SMAD4), KIT proto‐oncogene, receptor tyrosine kinase (KIT) and patched 1 (PTCH1).
Given that GI‐NECs are often treated in analogy to their lung counterparts, the mutation profiles of GI‐SCNECs and GI‐LCNECs were compared with SCLCs and L‐LCNECs, respectively, using previously published data [4, 16, 17]. Substantial differences were also observed between GI‐NECs and their lung counterparts (Supplementary Figure S3C‐D).
3.5. Key signaling pathways affected by somatic mutations
KEGG and REACTOME enrichment analysis of mutated cancer‐associated genes in 143 GI‐NECs revealed multiple significantly enriched pathways (P < 0.05), including receptor tyrosine kinases, phosphatidylinositol 3‐kinase (PI3K)/protein kinase B (AKT), neurogenic locus notch homolog protein (NOTCH), erythroblastic leukemia viral oncogene B (ERBB), wingless and int‐1 (WNT) ‐β‐catenin, FMS‐like tyrosine kinase 3 (FLT3), vascular endothelial growth factor (VEGF), and insulin‐like growth factor 1 (IGF‐1) (Supplementary Figure S5). Representative significantly enriched pathways for different anatomic locations are shown in Figure 3. PI3K‐AKT pathway was altered in 26 (18.2%) GI‐NECs (P < 0.05) (Figure 3A). Of particular interest, altered key signaling pathways also showed tumor location heterogeneity. WNT‐β‐catenin pathway was recurrently altered in 51 (58.6%) of 87 gastric NECs (P < 0.05) (Figure 3B). In esophageal NECs, NOTCH pathway mutations were prevalently enriched (15/29, 51.7%) (P < 0.05) (Figure 3C). NOTCH1 and ADAM10 were observed in 10 (34.5%) and 2 (6.9%) of 29 patients, respectively. Moreover, recurrent alterations were identified in multiple genes encoding proteins to form NOTCH1‐ proline, glutamic acid, serine, and threonine (PEST) coactivators, including E1A binding protein p300 (EP300), FBXW7, CDK8, histone deacetylase 7 (HDAC7) and CREB binding protein (CREBBP). The majority (15/20, 75.0%) of colorectal NECs harbored mutations in ERBB pathway genes, including ERBB2/3 (3/20, 15.0%), KRAS (9/20, 45.0%), NRAS (1/20, 5.0%), PIK3CA (2/20, 10.0%), and BRAF (3/20, 15.0%) (P < 0.05) (Figure 3D).
FIGURE 3.
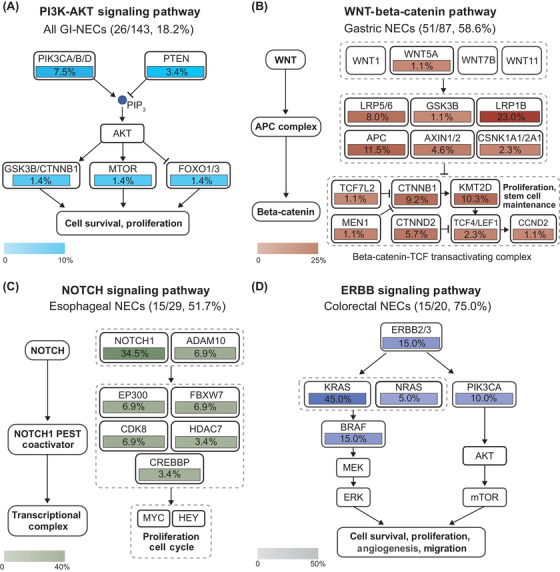
Recurrently mutated key signaling pathways across tumor locations in GI‐NECs. The PI3K‐AKT (A), WNT‐Beta‐catenin (B), NOTCH (C), and ERBB signaling pathways (D) were recurrently mutated in all GI‐NECs, gastric NECs, esophageal NECs and colorectal NECs, respectively. Boxes with different colors show the fractions of samples with alterations in these genes.
Abbreviations: PI3K‐AKT, phosphatidylinositol 3‐kinase/protein kinase B; WNT, wingless and int‐1; NOTCH, neurogenic locus notch homolog protein; ERBB, erythroblastic leukemia viral oncogene B; NECs, neuroendocrine carcinomas.
3.6. TMB and MSI
Our 143 GI‐NECs had a median TMB of 4.67 mutations/Mb (Range: 0.15‐39.73 mut/Mb), and 4 cases (2.8%) had TMB ≥20 mutations/Mb (Figure 2A, 2G). No significant differences in TMB were observed across different locations or histological subtypes (Supplementary Figure S6A‐B). GI‐NECs with LRP1B mutations had significantly higher TMB than those without LRP1B mutations (P = 0.021, Supplementary Figure S6C).
MSI‐high (MSI‐H) was detected in 9 (6.3%) GI‐NECs, including 8 gastric cases and 1 colorectal case. Somatic mutations in MMR genes were found in 6 (4.2%) cases (Figure 2G). There was a significant association between MSI‐H status and MMR gene mutations (P = 0.004, Supplementary Figure S6D). As expected, MSI‐H cases had a significantly higher TMB than MSS cases (P < 0.001). Similarly, patients harboring somatic mutations in MMR genes had significantly higher TMB than wild‐type cases (P < 0.001) (Supplementary Figure S6E).
3.7. Somatic CNVs
Overall, 17 and 135 significant arm‐level and focal CNVs were detected in 143 GI‐NECs, respectively (Figure 4A, Supplementary Table S3). Notably, 19q12 (cyclin E1 [CCNE1]) was significantly amplified in gastric and esophageal NECs, whereas 17q12 (erb‐b2 receptor tyrosine kinase 2 [ERBB2]) was significantly amplified in gastric and colorectal NECs. 8q24.21 (MYC) was significantly amplified in gastric, esophageal, and colorectal NECs. Significant arm‐level CNVs (Figure 4B) and focal CNVs (Figure 4C) varied substantially across locations. There were no significant arm‐level CNVs found in the small intestine, probably due to the small number of small intestine NECs.
FIGURE 4.
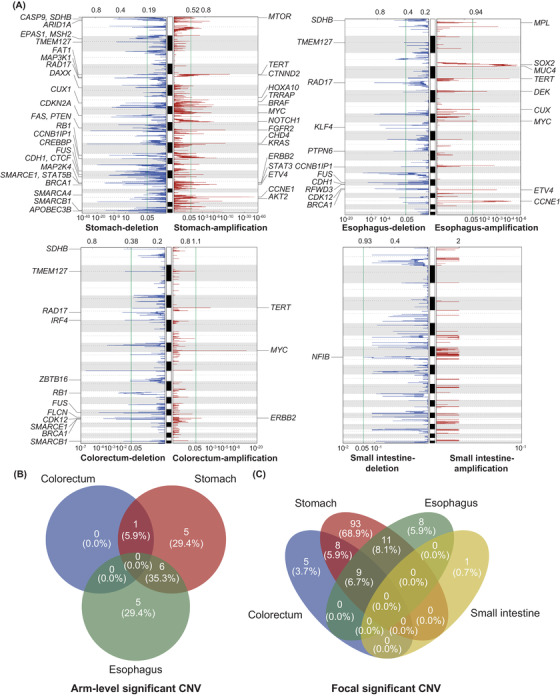
Landscape of significantly altered somatic CNVs in GI‐NECs. (A) Significant somatic CNVs in NECs from the stomach, esophagus, colorectum, and small intestine were obtained using GISTIC. The axis on the top stands for G scores of CNVs, while the axis on the bottom represents adjusted Q values of CNVs. The green line indicates the threshold of Q value = 0.05. Canonical cancer‐associated genes in significantly amplified or deleted focal peaks are labeled. (B‐C) The Venn diagram shows shared and distinct significant arm‐level (B) and focal CNVs (C) across different locations.
Abbreviations: CNVs, copy number variations; NECs, neuroendocrine carcinomas.
The most frequent arm‐level CNV events across 143 GI‐NECs were gain of 20p (74/143, 51.7%), gain of 8q (72/143, 50.3%), gain of 20q (69/143, 48.3%) and loss of 16q (68/143, 47.6%). The most frequent focal CNV events across the cohort were copy number gain of 8q24.21 (MYC; 89/143, 62.2%), gain of 5p15.33 (88/143, 61.5%), gain of 20p13 (85/143, 61.5%), gain of 8q11.23 (SOX17, 84/143, 58.7%), gain of 20q13.33 (protein tyrosine kinase 6 [PTK6], 82/143, 57.3%), loss of 5q14.3 (cyclin H [CCNH], 82/143, 57.3%) and gain of 5p15.2 (catenin delta 2 [CTNND2], 82/143, 57.3%) (Supplementary Figure S7A). Frequencies of CNV events and burdens varied substantially across anatomic locations (Supplementary Figure S7B‐C). Similar chromosomal‐level CNV burden was observed between GI‐LCNECs and GI‐SCNECs, whereas GI‐LCNECs had a significantly higher arm‐level CNV burden (P = 0.013) (Supplementary Figure S7D).
Allelic‐specific copy numbers of 17p and 13q were also analyzed, and bi‐allelic inactivation of TP53 and RB1 were observed in 109/143 (76.2%) and 29/143 (20.3%) of GI‐NECs, respectively (Supplementary Figure S8).
3.8. Therapeutic implications of somatic alterations
In total, 104 (72.7%) patients were detected with at least one clinically relevant genetic change. Putatively actionable events were found in 63 (72.4%), 20 (69.0%), 16 (80.0%), and 5 (71.4%) patients with gastric, esophageal, colorectal, and small intestinal NECs, respectively (Figure 5A). Putatively actionable alterations with their indicated therapies are presented in Figure 5B and Supplementary Table S5. Numbers of actionable alterations varied among patients (median, 4 alterations/patient; range, 0‐12 alterations/patient) and locations (Figure 5C). Differential therapeutic implications were revealed across locations. The most common putatively actionable alterations were identified in CCNE1 (39/143, 27.3%), RB1 (15/143, 10.5%), APC (13/143, 9.0%), KRAS (11/143, 7.7%), CTNNB1 (10/143, 7.0%), and ERBB2 (9/143, 6.3%) (Figure 5D), with corresponding therapeutic implications for CDK2 inhibitors, PI3K/mechanistic target of rapamycin kinase (mTOR) pathway inhibitors, WNT pathway inhibitors, mitogen‐activated protein kinase kinase (MEK) inhibitors, and so on (Figure 5E).
FIGURE 5.
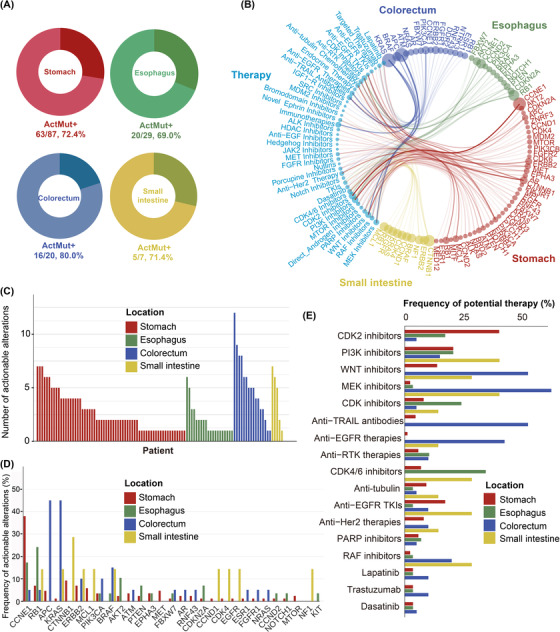
An overview of clinically relevant somatic alterations in 143 GI‐NECs using PHIAL software. (A) Proportions of patients harboring clinically relevant somatic alterations across four different locations. ActMut+ indicates patients with somatic actionable alterations. (B) Landscape of somatic altered genes and their corresponding putative therapeutic implications in GI‐NECs across four locations. Colors of the circles indicate disease locations; sizes of the circles stand for the frequencies of clinically relevant somatic alterations in these genes or their corresponding putative therapeutic implications. (C) Numbers of clinically relevant somatic alterations across four locations. (D) Frequencies of clinically relevant somatic alterations in commonly altered genes across four locations. (E) Proportions of patients that might benefit from or resist to specific therapies for GI‐NECs across four locations.
Abbreviations: GI‐NECs, neuroendocrine carcinomas of the gastrointestinal tract; PHIAL, Precision Heuristics for Interpreting the Alteration Landscape.
3.9. WGD and Clonal Architecture Analysis
WGD was identified in 81 (56.6%) GI‐NECs (Supplementary Table S3). The frequencies of WGD varied across anatomic locations (the stomach 58/87, 66.7%; the esophagus 16/29, 55.2%; the colorectum 6/20, 30.0%; the small intestine 1/7, 14.3%; P = 0.002), but not between GI‐LCNECs (39/60, 51.0%) and GI‐SCNECs (42/83, 50.6%) (P = 0.091).
We then inferred cancer cell fraction of somatic mutations and timed the emergence of somatic mutations and WGD in the molecular pathogenesis of GI‐NEC. In total, cancer cell fraction values of 1995 mutations were inferred, among which 978 (49.0%) mutations were defined as clonal. More than 50% of mutations in canonical cancer drivers (e.g., TP53, NOTCH1, RB1, APC, KRAS, ERBB4, KMT2D, PIK3CA) were identified clonal, whereas subclonal mutations preponderated in genes including ARID3A, PCLO and CSMD3 (Figure 6A). Cancer cell fraction of all somatic mutations in samples without WGD and with WGD are depicted in Figure 6B, respectively. In samples with WGD, 499 (48.4%) of 1030 mutations were considered to occur prior to WGD. Seventy‐five (92.6%) of 81 TP53 mutations and 20 (90.9%) of 22 RB1 mutations arose before WGD. Binomial distribution test showed significant enrichment of mutations in these two genes in pre‐WGD stage (both P < 0.001). The majority of APC (87.5%) and NOTCH1 (80.0%) mutations also occurred prior to WGD. Instead, mutations in LRP1B, ERBB4, FAT4, CSMD3, PCLO, reelin (RELN), and other genes tended to occur after WGD. Given that a small number of clonal mutations were observed to occur after WGD, we further classified somatic mutations into pre‐WGD clonal, post‐WGD clonal and subclonal based on their clonality and temporal orders in relation to WGD (Figure 6A‐B). TP53, RB1, NOTCH1 and APC mutations were mostly pre‐WGD clonal; LRP1B, ERBB4 and FAT4 mutations were distributed relatively even in the three groups; mutations in RELN and PCLO were typically subclonal.
FIGURE 6.
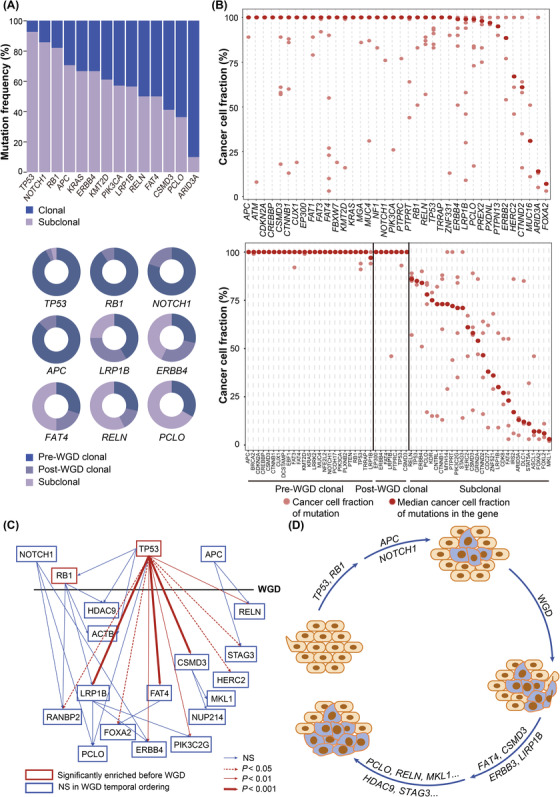
WGD and clonal architecture analysis of GI‐NECs. (A) Distributions of clonal and subclonal mutations in commonly mutated cancer‐associated genes in GI‐NECs (upper). Distributions of pre‐WGD clonal, post‐WGD clonal and subclonal mutations in commonly mutated cancer‐associated genes in GI‐NECs with WGD (bottom). (B) Cancer cell fraction of somatic mutations in canonical cancer‐associated genes in GI‐NECs without WGD (upper) and with WGD (bottom). (C) Temporal ordering of somatic driver mutations in canonical cancer‐associated genes. The horizontal black line represents the occurring time of WGD, and genes with somatic mutations mainly occurring before WGD are plotted above the line. The temporal ordering of recurrent clone‐subclonal mutation pairs between two genes are indicated with arrows. (D) A proposed model shows the temporal accumulation of multiple genetic alterations during tumorigenesis in GI‐NECs.
Abbreviations: WGD, whole‐genome doubling; GI‐NECs, neuroendocrine carcinomas of the gastrointestinal tract; Freq, frequency; NS, no significant difference.
The potential temporal relationship between two somatic mutations (clonal‐subclonal pair) in the same patient was inferred [23]. The clonal mutation was considered to occur earlier than the subclonal mutation in the same patient. TP53 somatic mutations were more likely to occur prior to multiple recurrent mutations in RELN, stromal antigen 3 (STAG3), HECT and RLD domain containing E3 ubiquitin protein ligase 2 (HERC2), CSMD3, PIK3C2G, FAT4, ERBB4, FOXA2, LRP1B and RAN binding protein 2 (RANBP2) (all P < 0.05) (Figure 6C). Subsequently, LRP1B mutations showed a tendency to occur earlier than PCLO, ERBB4 and PIK3C2G mutations, FAT4 tended to be mutated earlier than FOXA2, and CSMD3 was more likely to be mutated earlier than nucleoporin 214 (NUP214) and megakaryoblastic leukemia 1 (MKL1). Moreover, clone‐subclonal mutation pairs were also frequently observed in RB1 with HDAC9, actin beta (ACTB), RANBP2 and LRP1B, APC with HERC2 and STAG3, and NOTCH1 with RANBP2, PCLO and ERBB4.
Taken together, we speculated that tumor cells first gain clonal mutations in TP53, RB1, NOTCH1 and APC, followed by subsequent WGD and post‐WGD clonal mutations in other cancer‐associated genes (LRP1B, CSMD3, FAT4, ERBB4, and so on), and finally develop subclonal mutations in RELN, PCLO, MKL1, and so on (Figure 6D).
Given the heterogeneity of driver mutations across anatomic locations, our clonality and timing analyses were further detailed by anatomic locations. Predominantly clonal mutations were found in different genes at different locations (the stomach: FAT3 and KMT2D; the esophagus: cyclin‐dependent kinase inhibitor 2A (CDKN2A) and NOTCH1; the colorectum: ERBB2, KRAS and BRAF; the small intestine: CTNNB1), except that TP53 and RB1 mutations were mainly clonal across all locations (Supplementary Figures S9‐12A). Subclonal mutations also varied at different locations (the stomach: CSMD3, RELN, PCLO, and so on; the esophagus: KMT2D, RELN, ARID3A, and so on; the colorectum: HERC2, ARID3A, LRP1B, and so on; the small intestine: CSMD3, HERC2). The distribution of pre‐WGD clonal, post‐WGD clonal and subclonal mutations in cancer‐associated genes was further analyzed (Supplementary Figures S9‐11 & S12B‐D). Mutations in TP53 and RB1 (all locations), KMT2D and FAT3 (the stomach), CDKN2A and NOTCH1 (the esophagus), KRAS (the colorectum), and APC (the stomach, colorectum and small intestine) were mostly pre‐WGD clonal. LRP1B, ERBB4 and FAT4 mutations at the stomach were evenly distributed among the three groups. Post‐WGD clonal mutations were observed in CSMD3 and FAT1 at the esophagus, and RANBP2 at the colorectum. Notably, no post‐WGD clonal mutations were identified in small intestinal NECs, probably due to the small sample size (n = 7). Subclonal mutations were enriched in RELN and PCLO at the stomach, CSMD3 at the stomach and small intestine, ARID3A at the esophagus and colorectum, LRP1B at the colorectum, and HERC2 at the colorectum and small intestine. The “clonal‐subclonal” pairs were frequently observed between TP53 and multiple genes (the stomach: APC, LRP1B, CTNNB1, RELN and CSMD3; the esophagus: FAT1, ARID3A, NGFI‐A binding protein 2 (NAB2) and RB1; the colorectum: APC, LRP1B, FAT1, ARID3A, KRAS and NRAS) (Supplementary Figure S9‐11E). In gastric NECs, recurrent “clonal‐subclonal” pairs were observed between LRP1B and PIK3CA, between PCLO and ERBB4, and between RB1 and CTNND1/KMT2D. KMT2D tended to be mutated earlier than CSMD3 and CTNND1. In esophageal NECs, FAT1 clonal mutations tended to pair with subclonal mutations in MUC16, ARID3A and NAB2. CDKN2A was more likely to be mutated earlier than NAB2, and NOTCH1 and RB1 mutations tended to precede mutations in RANBP2. In colorectal NECs, RB1 tended to be mutated before KRAS, while KRAS mutations tended to occur earlier than mutations in FAT4. Besides, APC tended to be mutated earlier than ARID3A and FAT4. Probably due to the limited sample size of small intestinal NECs, no recurrent “clonal‐subclonal” pairs were observed. The temporal order of somatic mutation acquisitions in GI‐NECs at the stomach, esophagus and colorectum were then deciphered, respectively (Supplementary Figure S9‐11F). GI‐NECs of the stomach, esophagus and colorectum first gain clonal mutations in key driver genes including TP53 and RB1 (all three anatomic locations), APC and KMT2D (the stomach), NOTCH1 and CDKN2A (the esophagus), APC and KRAS (the colorectum), followed by subsequent WGD and post‐WGD clonal mutations in other cancer‐associated genes (the stomach: LRP1B; the esophagus: CSMD3; the colorectum: RANBP2), and finally develop subclonal mutations (the stomach: RELN and PCLO; the esophagus: ARID3A; the colorectum: HERC2).
3.10. Survival analysis
Patients with gastric NECs had significantly longer OS compared to those with GI‐NECs of other locations (P < 0.001) (Figure 7A‐B). In addition, patients harboring RB1 bi‐allelic inactivation with CNVs of 13q were observed to have significantly shorter OS (P = 0.007) (Figure 7C). In multivariate analyses, tumor location (P < 0.001) and RB1 bi‐allelic inactivation status (P = 0.031) were both independent prognostic indicators for OS in GI‐NEC (Supplementary Table S6). Similar trends were also found for PFS, albeit no significance for RB1 status in the univariate analysis (Figure 7D‐F, Supplementary Table S6).
FIGURE 7.
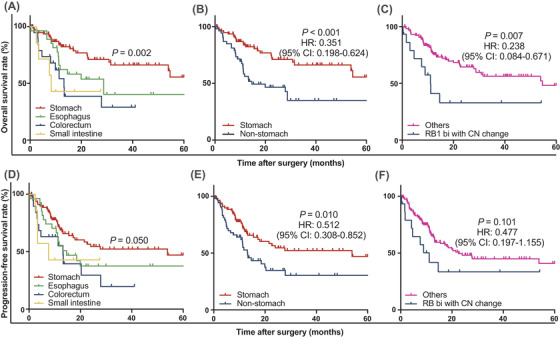
Kaplan‐Meier curves for OS and PFS in 143 GI‐NECs. Significant differences in OS are observed across GI‐NECs from different anatomic locations (A, B) or RB1 bi‐allelic inactivation status (C). Borderline statistical significance (P = 0.05) in PFS is observed across GI‐NECs from different anatomic (D). Significant differences in PFS are observed between gastric NECs and non‐gastric NECs (E). No significance is observed between RB1 bi‐allelic inactivation status and PFS (F).
Abbreviations: GI‐NECs, neuroendocrine carcinomas of the gastrointestinal tract; OS, overall survival; PFS, progression‐free survival; bi, bi‐allelic inactivation; CN, copy number.
4. DISCUSSION
The present study revealed that GI‐NECs showed distinct genetic features from both their lung counterparts and non‐NECs in the same locations. Substantial heterogeneity in the genomic landscape was found across anatomic locations rather than histological subtypes. Moreover, potentially actionable alterations and prognostic factors were revealed.
The concept of systemic treatment of GI‐NECs was mainly based on the experience in SCLCs [2]. Although anatomic location‐specific genetic variations were revealed in gastroenteropancreatic NETs [25], it has not been well demonstrated in GI‐NECs, and thus site‐specific treatment remains unaffordable. We revealed substantial tumor location heterogeneity in commonly mutated genes and signaling pathways. NOTCH1, FAT1, ARID3A and NFE2L2 were more frequently mutated in esophageal NECs. Concordantly, NOTCH1 and FAT1 have recently been reported to occur at a relatively high frequency in esophageal small cell carcinomas [11]. Moreover, the present study revealed that half of esophageal NECs harbored mutations in NOTCH1 and other NOTCH pathway genes. Mutational inactivation of NOTCH family genes has also been found in up to 25% of SCLCs, and suggested to cause neuroendocrine differentiation [4, 26]. LRP1B mutation was mainly observed in gastric NECs. LRP1B was previously identified as a novel tumor suppressor gene for gastric cancer, and has been recently reported to be associated with TMB and immunotherapy response in a variety of cancers [27, 28]. We also observed that LRP1B mutation was associated with higher TMB in GI‐NECs. Its predictive value for immunotherapy response in GI‐NECs warrants further validation. Moreover, we revealed that WNT signaling pathway genes were recurrently altered in more than half of gastric NECs. Colorectal NECs harbored higher frequencies of APC, KRAS, BRAF, FBXW7, SOX9 and MGA mutations. As for key pathways, 75% of colorectal NECs harbored mutations in ERBB pathway genes. Similarly, there was also substantial tumor location heterogeneity of mutational signatures, CNVs, WGD frequencies, and therapeutic and prognostic implications, all indicating that different molecular mechanisms might underlie the tumorigenesis and progression of NECs originating from different GI locations, justifying site‐specific treatment for GI‐NECs.
Findings from recent research have revealed the molecular differences between SCLCs and L‐LCNECs, raising the possibility of stratified targeted treatment [3, 29]. However, it remains unknown whether a similar situation could be observed in NECs arising from other locations. The present study revealed that the genetic profiles were highly concordant between GI‐SCNECs and GI‐LCNECs. Our results suggested that it might be unnecessary to histologically subclassify GI‐NECs when the differential diagnosis poses challenges in clinical practice, especially on small biopsy samples.
It remains controversial whether the genetic characteristics of GI‐NECs were more similar to prototypic lung NECs or non‐NECs at the same locations. Li et al. [11] reported that esophageal small cell carcinomas had genomic and transcriptomic features highly similar to SCLCs but distinct from esophageal squamous cell carcinomas or adenocarcinomas, while others concluded that colorectal GI‐NECs were often more similar to colorectal adenocarcinomas than lung NECs [10, 30‐32]. Our results showed that GI‐NECs harbored distinct genetic alterations, albeit partially overlapping with both their lung counterparts and non‐NECs in the same locations. Similar with NECs arising from other locations [3, 16], TP53 and RB1 were the two most frequently mutated genes in our cohort of GI‐NECs. However, GI‐SCNECs had a significantly lower frequency of RB1 mutations than SCLCs. Concordantly, RB1 mutation frequencies varied considerably across different anatomic locations according to previous studies [4, 33, 34]. Moreover, multiple other genes, including those detected in GI adenocarcinomas (e.g., APC and CTNNB1), were also differentially mutated between GI‐NECs and their lung counterparts. Although increasing evidence showed that the two distinct components in mixed adenoneuroendocrine carcinomas of the GI tract were genetically closely related, indicating a common monoclonal origin of the two components [31, 35], the genetic differences between pure GI‐NECs and non‐NECs at the same locations remained largely unknown. To make our results easy to interpret and compare, only pure NECs were included in our cohort by thorough histological examination of surgically resected samples. Consistent with previous studies [10, 31, 32, 36], we found that GI‐NECs shared some highly prevalent alterations (APC, TP53, KRAS, BRAF, FBXW7, and so on) with non‐NECs in the same location. However, we also revealed that somatic mutations of PIK3CA, PTEN and SMAD4 were extremely low in colorectal NECs, whereas these genes are all well‐known to be frequently mutated in colorectal adenocarcinoma [37, 38]. Interestingly, Jesinghaus et al. [31] found that APC was much less frequently mutated in colorectal mixed adenoneuroendocrine carcinomas than either colorectal NECs or adenocarcinomas, which might provide a potential explanation for the wide range of APC mutation frequencies in colorectal NECs in previous studies [10, 31, 32, 36]. As for esophageal NECs, significantly higher frequencies of NOTCH1, FAT and ARID3A mutations were observed compared with esophageal squamous cell carcinoma. Our results shed light on the unique genetic features of GI‐NECs, which were distinguished from lung NECs and non‐NECs at the same locations.
Kinesin family member‐18A (KIF18A), a kinesin motor protein involved in mitotic spindle control, has been recently reported to be specifically required for the proliferation of cancer cells with chromosomal instability [39]. Our results showed that CNV events were common in GI‐NECs and associated with TP53 inactivation, implicating high chromosomal instability and potential therapeutic opportunity for the inhibition of KIF18A in GI‐NECs. Furthermore, albeit obvious tumor location heterogeneity, 8q24.21 (MYC) and 19q12 (CCNE1) were commonly and significantly amplified in GI‐NECs, consistent with findings from colorectal [10, 40] and gastric NECs [9]. In addition, bi‐allelic inactivation of TP53 and/or RB1 was detected in most GI‐NECs, generally due to LOH events, demonstrating that frequent bi‐allelic inactivation of these two tumor suppressor genes is also the critical event in GI‐NECs as previously reported in SCLCs [4].
We further revealed that most GI‐NECs harbored at least one alteration with targeted therapeutic implications. Previous in vivo and in vitro studies showed that these inhibitors, either alone or in combination treatment, exhibited antitumor activity against NECs [26, 41‐43]. Differential targeted therapeutic implications across tumor locations justify more effective treatment tailored to the primary locations of origin. Moreover, TMB‐H and MSI‐H occurred in a small proportion of GI‐NECs, indicating the possibility of immunotherapy in GI‐NECs [44].
WGD is a common and distinguishing characteristic of tumors, occurring early in tumorigenesis after an antecedent transforming driver mutation and contributing to tumor evolution. The occurrence of WGD varied substantially among different tumor subtypes [24]. We revealed that most GI‐NECs harbored WGD, probably due to the highly frequent inactivation of TP53, which could remove the major barrier to the proliferation of tumor cells with WGD [45]. The potential of KIF18A as a therapeutic target specific to tumors with WGD has been recently reported [45]. Through relative timing of WGD events with driver mutations, we proposed a temporal accumulation of key genetic alterations during tumorigenesis of GI‐NECs. TP53, RB1, NOTCH1 and APC mutations were considered as major early driver events in GI‐NECs. Supporting this view, inactivating NOTCH mutations and activation of the WNT signaling pathway in addition to P53 and RB1 inactivation might drive the early‐stage carcinogenesis and thus provide a preclinical rationale for therapeutically testing WNT inhibitors in SCLCs [26, 46]. Considering the significant genetic heterogeneity in GI‐NECs across anatomic locations, it is not surprising to find that the relative timing of genetic alteration accumulation varied across different anatomic locations. APC and KMT2D, NOTCH1 and CDKN2A, APC and KRAS were major early driver events for GI‐NECs arising from the stomach, esophagus and colorectum, respectively, also justifying site‐specific treatment for GI‐NECs.
As we know, there is a lack of reliable prognostic factors in GI‐NECs. Importantly, the present study demonstrated that both non‐gastric location and RB1 bi‐allelic inactivation with CNVs were independent prognostic factors indicating worse OS for GI‐NECs. Our results further highlighted the tumor location heterogeneity and helped recognize particularly high‐risk GI‐NECs. Interestingly, RB1 bi‐allelic inactivation with CNVs has also been identified as an independent poor prognostic marker in multiple myeloma [47].
The present study had several limitations. First, although a large cohort of patients was recruited, the sample size of small intestinal NECs was too small to analyze separately and draw meaningful conclusions. Second, only genomic data were used in this study. Comprehensive multi‐omic profiling would provide a more in‐depth exploration of molecular characterization and heterogeneity in GI‐NECs. In addition, due to the retrospective and descriptive nature of this study, our findings require further validation to guide clinical decision‐making.
5. CONCLUSIONS
GI‐NECs showed substantial tumor location rather than histology heterogeneity in mutational landscapes and signatures, CNVs, and WGD frequencies with important therapeutic and prognostic implications. GI‐NECs harbored distinct genetic features from both lung NECs and non‐NECs at the same locations. Most GI‐NECs harbor putative clinically relevant alterations and WGD events. Through relative timing of somatic mutations and WGD events, a temporal accumulation of key genetic alterations during tumorigenesis of GI‐NECs was proposed. Moreover, non‐gastric location and RB1 bi‐allelic inactivation status were both independent poor prognostic factors for GI‐NECs.
DECLARATIONS
CONFLICT OF INTERESTS
The authors declare no competing interests.
ETHICS APPROVAL AND CONSENT TO PARTICIPATE
This study was approved by the institutional review board of Peking Union Medical College Hospital (HS‐1908), and written informed consent were obtained.
CONSENT FOR PUBLICATION
Not applicable.
AUTHOR CONTRIBUTIONS
Z.L. and H.W. jointly overseen, coordinated, and provided funding for this study. Z.L., H.W., D.S., X.N., and L.Y. conceptualized and designed analyses and experiments. Y.L., L.G., L.L., L.T., L.G., J.W, X.N., and D.S. participated in collection of the specimens. Z.L., H.W., and J.W. performed pathological review of specimens and assessment of IHC stains. J.G. participated in extraction and quality control of nucleic acids. H.W., Z.Y., and R.L. performed data analysis. H.W., Z.Y., and R.L. participated in conceptual design and generation of plots and tables. The manuscript was written by H.W. and Z.Y., and approved by all authors.
Supporting information
SUPPORTING INFORMATION
SUPPORTING INFORMATION
ACKNOWLEDGMENTS
This work was supported by Chinese Academy of Medical Sciences Innovation Fund for Medical Sciences (CIFMS) (2021‐I2M‐1‐002 to H.W.), National High Level Hospital Clinical Research Funding (2022‐PUMCH‐A‐001), and National Natural Science Foundation of China (82072747 to Z.L.; 82072749 to H.W.).
Wu H, Yu Z, Liu Y, Guo L, Teng L, Guo L, et al. Genomic characterization reveals distinct mutation landscapes and therapeutic implications in neuroendocrine carcinomas of the gastrointestinal tract. Cancer Commun. 2022;42:1367–1386. 10.1002/cac2.12372
Contributor Information
Xiu Nie, Email: niexiuyishi@126.com.
Dan Su, Email: sudan@zjcc.org.cn.
Zhiyong Liang, Email: liangzy@pumch.cn.
DATA AVAILABILITY STATEMENT
Sequencing data have been deposited to China National GeneBank DataBase (CNGBdb) (https://db.cngb.org/; project code: CNP0003109).
REFERENCES
- 1. Nagtegaal ID, Odze RD, Klimstra D, Paradis V, Rugge M, Schirmacher P, et al. The 2019 WHO classification of tumours of the digestive system. Histopathology. 2020;76(2):182‐8. [DOI] [PMC free article] [PubMed] [Google Scholar]
- 2. Mollazadegan K, Welin S, Crona J. Systemic Treatment of Gastroenteropancreatic Neuroendocrine Carcinoma. Curr Treat Options Oncol. 2021;22(8):68. [DOI] [PMC free article] [PubMed] [Google Scholar]
- 3. George J, Walter V, Peifer M, Alexandrov LB, Seidel D, Leenders F, et al. Integrative genomic profiling of large‐cell neuroendocrine carcinomas reveals distinct subtypes of high‐grade neuroendocrine lung tumors. Nat Commun. 2018;9(1):1048. [DOI] [PMC free article] [PubMed] [Google Scholar]
- 4. George J, Lim JS, Jang SJ, Cun Y, Ozretic L, Kong G, et al. Comprehensive genomic profiles of small cell lung cancer. Nature. 2015;524(7563):47‐53. [DOI] [PMC free article] [PubMed] [Google Scholar]
- 5. Yachida S, Vakiani E, White CM, Zhong Y, Saunders T, Morgan R, et al. Small cell and large cell neuroendocrine carcinomas of the pancreas are genetically similar and distinct from well‐differentiated pancreatic neuroendocrine tumors. Am J Surg Pathol. 2012;36(2):173‐84. [DOI] [PMC free article] [PubMed] [Google Scholar]
- 6. Puccini A, Poorman K, Salem ME, Soldato D, Seeber A, Goldberg RM, et al. Comprehensive Genomic Profiling of Gastroenteropancreatic Neuroendocrine Neoplasms (GEP‐NENs). Clin Cancer Res. 2020;26(22):5943‐51. [DOI] [PMC free article] [PubMed] [Google Scholar]
- 7. van Riet J, van de Werken HJG, Cuppen E, Eskens F, Tesselaar M, van Veenendaal LM, et al. The genomic landscape of 85 advanced neuroendocrine neoplasms reveals subtype‐heterogeneity and potential therapeutic targets. Nat Commun. 2021;12(1):4612. [DOI] [PMC free article] [PubMed] [Google Scholar]
- 8. Chen D, Bao X, Zhang R, Ding Y, Zhang M, Li B, et al. Depiction of the genomic and genetic landscape identifies CCL5 as a protective factor in colorectal neuroendocrine carcinoma. Br J Cancer. 2021;125(7):994‐1002. [DOI] [PMC free article] [PubMed] [Google Scholar]
- 9. Koh J, Nam SK, Kwak Y, Kim G, Kim KK, Lee BC, et al. Comprehensive genetic features of gastric mixed adenoneuroendocrine carcinomas and pure neuroendocrine carcinomas. J Pathol. 2021;253(1):94‐105. [DOI] [PubMed] [Google Scholar]
- 10. Chen L, Liu M, Zhang Y, Guo Y, Chen MH, Chen J. Genetic Characteristics of Colorectal Neuroendocrine Carcinoma: More Similar to Colorectal Adenocarcinoma. Clin Colorectal Cancer. 2021;20(2):177‐185.e13. [DOI] [PubMed] [Google Scholar]
- 11. Li R, Yang Z, Shao F, Cheng H, Wen Y, Sun S, et al. Multi‐omics profiling of primary small cell carcinoma of the esophagus reveals RB1 disruption and additional molecular subtypes. Nat Commun. 2021;12(1):3785. [DOI] [PMC free article] [PubMed] [Google Scholar]
- 12. Lokuhetty D, White VA, Watanabe R, Cree IA. WHO classification of tumours. Digestive system tumours. 5th ed. Lyon: IARC Press; 2019. [Google Scholar]
- 13. Li X, Huang H, Guan Y, Gong Y, He CY, Yi X, et al. Whole‐exome sequencing predicted cancer epitope trees of 23 early cervical cancers in Chinese women. 2017;6(1):207‐19. [DOI] [PMC free article] [PubMed] [Google Scholar]
- 14. Angus L, Smid M, Wilting SM, van Riet J, Van Hoeck A, Nguyen L, et al. The genomic landscape of metastatic breast cancer highlights changes in mutation and signature frequencies. Nat Genet. 2019;51(10):1450‐8. [DOI] [PMC free article] [PubMed] [Google Scholar]
- 15. Sondka Z, Bamford S, Cole CG, Ward SA, Dunham I, Forbes SA. The COSMIC Cancer Gene Census: describing genetic dysfunction across all human cancers. Nat Rev Cancer. 2018;18(11):696‐705. [DOI] [PMC free article] [PubMed] [Google Scholar]
- 16. Miyoshi T, Umemura S, Matsumura Y, Mimaki S, Tada S, Makinoshima H, et al. Genomic Profiling of Large‐Cell Neuroendocrine Carcinoma of the Lung. Clin Cancer Res. 2017;23(3):757‐65. [DOI] [PubMed] [Google Scholar]
- 17. Rizvi H, Sanchez‐Vega F, La K, Chatila W, Jonsson P, Halpenny D, et al. Molecular Determinants of Response to Anti‐Programmed Cell Death (PD)‐1 and Anti‐Programmed Death‐Ligand 1 (PD‐L1) Blockade in Patients With Non‐Small‐Cell Lung Cancer Profiled With Targeted Next‐Generation Sequencing. J Clin Oncol. 2018;36(7):633‐41. [DOI] [PMC free article] [PubMed] [Google Scholar]
- 18. Niu B, Ye K, Zhang Q, Lu C, Xie M, McLellan MD, et al. MSIsensor: microsatellite instability detection using paired tumor‐normal sequence data. Bioinformatics. 2014;30(7):1015‐6. [DOI] [PMC free article] [PubMed] [Google Scholar]
- 19. Alexandrov LB, Kim J, Haradhvala NJ, Huang MN, Tian Ng AW, Wu Y, et al. The repertoire of mutational signatures in human cancer. Nature. 2020;578(7793):94‐101. [DOI] [PMC free article] [PubMed] [Google Scholar]
- 20. Hubschmann D, Jopp‐Saile L, Andresen C, Kramer S, Gu Z, Heilig CE, et al. Analysis of mutational signatures with yet another package for signature analysis. Genes Chromosomes Cancer. 2021;60(5):314‐31. [DOI] [PubMed] [Google Scholar]
- 21. Yu G, Wang LG, Han Y, He QY. clusterProfiler: an R package for comparing biological themes among gene clusters. OMICS. 2012;16(5):284‐7. [DOI] [PMC free article] [PubMed] [Google Scholar]
- 22. Davoli T, Uno H, Wooten EC, Elledge SJ. Tumor aneuploidy correlates with markers of immune evasion and with reduced response to immunotherapy. Science. 2017;355(6322):eaaf8399. [DOI] [PMC free article] [PubMed] [Google Scholar]
- 23. Huang Y, Wang J, Jia P, Li X, Pei G, Wang C, et al. Clonal architectures predict clinical outcome in clear cell renal cell carcinoma. Nat Commun. 2019;10(1):1245. [DOI] [PMC free article] [PubMed] [Google Scholar]
- 24. Bielski CM, Zehir A, Penson AV, Donoghue MTA, Chatila W, Armenia J, et al. Genome doubling shapes the evolution and prognosis of advanced cancers. Nat Genet. 2018;50(8):1189‐95. [DOI] [PMC free article] [PubMed] [Google Scholar]
- 25. Mafficini A, Scarpa A. Genetics and Epigenetics of Gastroenteropancreatic Neuroendocrine Neoplasms. Endocr Rev. 2019;40(2):506‐36. [DOI] [PMC free article] [PubMed] [Google Scholar]
- 26. Meder L, Konig K, Ozretic L, Schultheis AM, Ueckeroth F, Ade CP, et al. NOTCH, ASCL1, p53 and RB alterations define an alternative pathway driving neuroendocrine and small cell lung carcinomas. Int J Cancer. 2016;138(4):927‐38. [DOI] [PMC free article] [PubMed] [Google Scholar]
- 27. Takeda H, Rust AG, Ward JM, Yew CC, Jenkins NA, Copeland NG. Sleeping beauty transposon mutagenesis identifies genes that cooperate with mutant Smad4 in gastric cancer development. Proc Natl Acad Sci U S A. 2016;113(14):E2057‐65. [DOI] [PMC free article] [PubMed] [Google Scholar]
- 28. Chen H, Chong W, Wu Q, Yao Y, Mao M, Wang X. Association of LRP1B Mutation With Tumor Mutation Burden and Outcomes in Melanoma and Non‐small Cell Lung Cancer Patients Treated With Immune Check‐Point Blockades. Front Immunol. 2019;10:1113. [DOI] [PMC free article] [PubMed] [Google Scholar]
- 29. Rekhtman N, Pietanza MC, Hellmann MD, Naidoo J, Arora A, Won H, et al. Next‐Generation Sequencing of Pulmonary Large Cell Neuroendocrine Carcinoma Reveals Small Cell Carcinoma‐like and Non‐Small Cell Carcinoma‐like Subsets. Clin Cancer Res. 2016;22(14):3618‐29. [DOI] [PMC free article] [PubMed] [Google Scholar]
- 30. Uccella S, La Rosa S, Metovic J, Marchiori D, Scoazec JY, Volante M, et al. Genomics of High‐Grade Neuroendocrine Neoplasms: Well‐Differentiated Neuroendocrine Tumor with High‐Grade Features (G3 NET) and Neuroendocrine Carcinomas (NEC) of Various Anatomic Sites. Endocr Pathol. 2021. [DOI] [PubMed] [Google Scholar]
- 31. Jesinghaus M, Konukiewitz B, Keller G, Kloor M, Steiger K, Reiche M, et al. Colorectal mixed adenoneuroendocrine carcinomas and neuroendocrine carcinomas are genetically closely related to colorectal adenocarcinomas. Mod Pathol. 2017;30(4):610‐9. [DOI] [PubMed] [Google Scholar]
- 32. Takizawa N, Ohishi Y, Hirahashi M, Takahashi S, Nakamura K, Tanaka M, et al. Molecular characteristics of colorectal neuroendocrine carcinoma; similarities with adenocarcinoma rather than neuroendocrine tumor. Hum Pathol. 2015;46(12):1890‐900. [DOI] [PubMed] [Google Scholar]
- 33. Tan HL, Sood A, Rahimi HA, Wang W, Gupta N, Hicks J, et al. Rb loss is characteristic of prostatic small cell neuroendocrine carcinoma. Clin Cancer Res. 2014;20(4):890‐903. [DOI] [PMC free article] [PubMed] [Google Scholar]
- 34. Ohmoto A, Sato Y, Asaka R, Fukuda N, Wang X, Urasaki T, et al. Clinicopathological and genomic features in patients with head and neck neuroendocrine carcinoma. Mod Pathol. 2021;34(11):1979‐1989. [DOI] [PMC free article] [PubMed] [Google Scholar]
- 35. Frizziero M, Chakrabarty B, Nagy B, Lamarca A, Hubner RA, Valle JW, et al. Mixed Neuroendocrine Non‐Neuroendocrine Neoplasms: A Systematic Review of a Controversial and Underestimated Diagnosis. J Clin Med. 2020;9(1):273. [DOI] [PMC free article] [PubMed] [Google Scholar]
- 36. Chen D, Bao X, Zhang R, Ding Y, Zhang M, Li B, et al. Depiction of the genomic and genetic landscape identifies CCL5 as a protective factor in colorectal neuroendocrine carcinoma. Br J Cancer. 2021;125(7):994‐1002. [DOI] [PMC free article] [PubMed] [Google Scholar]
- 37. Chen J, Zhou L, Gao J, Lu T, Wang J, Wu H, et al. Clinicopathological Characteristics and Mutation Spectrum of Colorectal Adenocarcinoma With Mucinous Component in a Chinese Cohort: Comparison With Classical Adenocarcinoma. Front Oncol. 2020;10:917. [DOI] [PMC free article] [PubMed] [Google Scholar]
- 38. Wang J, Li R, He Y, Yi Y, Wu H, Liang Z. Next‐generation sequencing reveals heterogeneous genetic alterations in key signaling pathways of mismatch repair deficient colorectal carcinomas. Mod Pathol. 2020;33(12):2591‐601. [DOI] [PubMed] [Google Scholar]
- 39. Marquis C, Fonseca CL, Queen KA, Wood L, Vandal SE, Malaby HLH, et al. Chromosomally unstable tumor cells specifically require KIF18A for proliferation. Nat Commun. 2021;12(1):1213. [DOI] [PMC free article] [PubMed] [Google Scholar]
- 40. Shamir ER, Devine WP, Pekmezci M, Umetsu SE, Krings G, Federman S, et al. Identification of high‐risk human papillomavirus and Rb/E2F pathway genomic alterations in mutually exclusive subsets of colorectal neuroendocrine carcinoma. Mod Pathol. 2019;32(2):290‐305. [DOI] [PubMed] [Google Scholar]
- 41. Bland T, Wang J, Yin L, Pu T, Li J, Gao J, et al. WLS‐Wnt signaling promotes neuroendocrine prostate cancer. iScience. 2021;24(1):101970. [DOI] [PMC free article] [PubMed] [Google Scholar]
- 42. Jin XF, Spottl G, Maurer J, Nolting S, Auernhammer CJ. Antitumoral Activity of the MEK Inhibitor Trametinib (TMT212) Alone and in Combination with the CDK4/6 Inhibitor Ribociclib (LEE011) in Neuroendocrine Tumor Cells In Vitro. Cancers (Basel). 2021;13(6):1485. [DOI] [PMC free article] [PubMed] [Google Scholar]
- 43. Jin XF, Spoettl G, Maurer J, Nolting S, Auernhammer CJ. Inhibition of Wnt/beta‐Catenin Signaling in Neuroendocrine Tumors in vitro: Antitumoral Effects. Cancers (Basel). 2020;12(2):345. [DOI] [PMC free article] [PubMed] [Google Scholar]
- 44. Whitman J, Kardosh A, Diaz L Jr, Fong L, Hope T, Onodera C, et al. Complete Response and Immune‐Mediated Adverse Effects With Checkpoint Blockade: Treatment of Mismatch Repair–Deficient Colorectal Neuroendocrine Carcinoma. JCO Precis Oncol. 2019;3:1‐7. [DOI] [PubMed] [Google Scholar]
- 45. Quinton RJ, DiDomizio A, Vittoria MA, Kotynkova K, Ticas CJ, Patel S, et al. Whole‐genome doubling confers unique genetic vulnerabilities on tumour cells. Nature. 2021;590(7846):492‐7. [DOI] [PMC free article] [PubMed] [Google Scholar]
- 46. Chen HJ, Poran A, Unni AM, Huang SX, Elemento O, Snoeck HW, et al. Generation of pulmonary neuroendocrine cells and SCLC‐like tumors from human embryonic stem cells. J Exp Med. 2019;216(3):674‐87. [DOI] [PMC free article] [PubMed] [Google Scholar]
- 47. Chavan SS, He J, Tytarenko R, Deshpande S, Patel P, Bailey M, et al. Bi‐allelic inactivation is more prevalent at relapse in multiple myeloma, identifying RB1 as an independent prognostic marker. Blood Cancer J. 2017;7(2):e535. [DOI] [PMC free article] [PubMed] [Google Scholar]
Associated Data
This section collects any data citations, data availability statements, or supplementary materials included in this article.
Supplementary Materials
SUPPORTING INFORMATION
SUPPORTING INFORMATION
Data Availability Statement
Sequencing data have been deposited to China National GeneBank DataBase (CNGBdb) (https://db.cngb.org/; project code: CNP0003109).