

Abstract
Classical phenylketonuria (PKU, OMIM 261600) owes to hepatic deficiency of phenylalanine hydroxylase (PAH) that enzymatically converts phenylalanine (Phe) to tyrosine (Tyr). PKU neurologic phenotypes include impaired brain development, decreased myelination, early onset mental retardation, seizures, and late-onset features (neuropsychiatric, Parkinsonism). Phe over-representation is systemic; however, tissue response to hyperphenylalaninemia is not consistent. To characterize hyperphenylalaninemia tissue response, metabolomics was applied to Pahenu2 classical PKU mouse blood, liver, and brain. In blood and liver over-represented analytes were principally Phe, Phe catabolites, and Phe-related analytes (Phe-conjugates, Phe-containing dipeptides). In addition to Phe and Phe-related analytes, the metabolomic profile of Pahenu2 brain tissue evidenced oxidative stress responses and energy dysregulation. Glutathione and homocarnosine anti-oxidative responses are apparent Pahenu2 brain. Oxidative stress in Pahenu2 brain was further evidenced by increased reactive oxygen species. Pahenu2 brain presents an increased NADH/NAD ratio suggesting respiratory chain complex 1 dysfunction. Respirometry in Pahenu2 brain mitochondria functionally confirmed reduced respiratory chain activity with an attenuated response to pyruvate substrate. Glycolysis pathway analytes are over-represented in Pahenu2 brain tissue. PKU pathologies owe to liver metabolic deficiency; yet, Pahenu2 liver tissue shows neither energy disruption nor anti-oxidative response. Unique aspects of metabolomic homeostasis in PKU brain tissue along with increased reactive oxygen species and respiratory chain deficit provide insight to neurologic disease mechanisms. While some elements of assumed, long standing PKU neuropathology are enforced by metabolomic data (e.g. reduced tryptophan and serotonin representation), energy dysregulation and tissue oxidative stress expand mechanisms underlying neuropathology.
1. Introduction
PAH deficient PKU (OMIM 261600) is the paradigm treatable metabolic disease being the principal motivation for prospective newborn screening [1–3]. PKU clinical management is primarily focused on neurologic phenotypes; however, less prominent bone, vascular, and optic phenotypes are recognized [4–6]. Biochemically, blood hyperphenylalaninemia defines PKU; however, Phe over-representation extends to essentially all tissues [7]. Since the 1960’s and continuing to this day, dietary substrate reduction (i.e. Phe restriction) has served as the primary interventional means [8,9]. Cofactor therapy (Sapropterin) and alternative-pathway enzyme therapy (Palynziq) are among contemporary Phe reduction means [10,11]. Independent of the interventional strategy, treatment monitoring exclusively relies upon plasma amino acid assessment [9].
Characterization of PKU neurologic pathophysiology remains incomplete. The long accepted, albeit poorly supported, neuropathology mechanism centers upon the blood:brain barrier, the large neutral amino acid transporter (LAT1, SLC7A5 gene product), and high blood Phe concentration precipitating imbalanced cerebral amino acid transport to reduce Tyr and tryptophan (Trp) concentrations [12]. A consequence of Tyr and Trp under-representation is paucities of dopaminergic and serotonergic neurotransmitters [13,14]. A linear pathway relates Phe, Tyr, and dopamine. As PAH deficiency blocks Tyr synthesis, secondary dopamine deficiency is intuitive. Serotonergic neurotransmitter deficiency postulates Phe inhibition of tryptophan hydroxylase [15] or alternatively, imbalanced blood brain barrier amino acid transport reduces Trp availability, depriving tryptophan hydroxylase of substrate with ensuing serotonin deficiency. Shortcoming of hypotheses where neurotransmitter paucities drive PKU neuropathology lies in clinical phenotypes of genuine neurotransmitter deficiencies (e.g. tyrosine hydroxylase deficiency) where dystonia and seizures are primary presentation, not mental retardation as occurs in PKU [16]. Direct Phe toxicity is suggested as causal in microcephaly, demyelination, and other white matter disease [17]. Specifically regarding myelin, it is suggested that under the influence of hyperphenylalaninemia myelin is normally produced but the product is in some manner functionally impaired [18]. Genuine evidence supporting Phe-toxicity as a driver of white matter disease is minimal.
The breadth of altered biochemical homeostasis owing to hepatic PAH deficiency remains ill defined. In both experimental and clinical studies involving PKU patients and PKU animal models, biochemical assessment is largely limited to amino acids and monoamine neurotransmitters. To appreciate systemic implications of PKU upon biochemical homeostasis, we applied untargeted metabolomics to the Pahenu2 classical PKU mouse. Further, metabolomics was applied to blood plasma, liver tissue, and frontal cortex brain tissue. Phe, Phe catabolites, and Phe related analytes (e.g. Phe conjugates, Phe containing peptides) were detected universally across tissues. Biochemical homeostasis of Pahenu2 brain tissue was complex and unique. Observed were altered representation of standard amino acids (e.g. Phe, Tyr, Trp, His), amino acid catabolites, amino acid conjugates, intrinsic oxidative stress response analytes (glutathione pathway, homocarnosine pathway), and energy pathway analytes (glycolysis, oxidative phosphorylation). In Pahenu2 brain tissue, oxidative stress is demonstrated by reactive oxygen species over-representation providing clear insight for anti-oxidative response evidenced by increased glutathione and homocarnosine pathway analytes. High-resolution respirometry performed in Pahenu2 brain tissue mitochondria demonstrated attenuated respiratory chain complex 1 activity in response to pyruvate substrate. Pahenu2 brain tissue metabolomics identified an increased NADH/NAD ratio being further evidence of respiratory chain complex 1 dysfunction. Summation of the brain metabolomic profile, reactive oxygen species, and respirometry gives indication PKU neuropathology involves energy deficit and oxidative stress. Among neurodegenerative diseases (e.g. Parkinson’s disease, amyotrophic lateral sclerosis), energy deficit and oxidative stress are recognized pathophysiological drivers [19,20]. Data presented herein suggests similar mechanisms are participatory in PKU. Early identified, continuously treated classical PKU patients avoid severe early onset mental retardation; however, reduced IQ compared to unaffected siblings, executive function deficit, and late onset neurologic phenotypes are common. We posit oxidative stress and energy disruption impact susceptible cell populations in the brain being a central element in PKU neuropathology. Aggressive therapy supporting cerebral energetics and reducing oxidative stress may be required to ameliorate residual PKU neurologic disease.
2. Methods and materials
2.1. Pahenu2 and control animals
Maintenance of Pahenu2 animals utilizes an approved protocol in the Rangos Research Center animal facility at Children’s Hospital of Pittsburgh. Experimental and control animals were generated mating heterozygous females and heterozygous males. Offspring genotyping is as described [21]. Alternative homozygous genotypes (PKU enu2/enu2, control wt/wt) were selected for experimental cohorts, each consisting of six animals (3 male, 3 female). After weaning, animals were provided standard mouse chow thereby maintaining hyperphenylalaninemia (~2200 μM Phe females; ~2000 μM Phe males) among homozygous experimental animals. Wild type littermates, provide an identical diet, have blood Phe ranging from 50 to 85 μM. Experimental and control animals were used in the fed state. While cohorts contain equal male and female representation, no effort was made to determine sex-specific difference in metabolomic profiles and other metrics assessed (reactive oxygen species, respirometry). Animal sacrifice applied CO2 asphyxiation at 3 months of age. Blood was collected by terminal draw and plasma prepared by centrifugation. Liver and brain frontal cortex tissue were dissected. For metabolomics, samples (plasma, liver, brain) were stored at −80 °C prior to utilization. For high-resolution respirometry and reactive oxygen species assessment, a portion of frontal cortex brain tissue or liver tissue was placed on ice and used immediately as described below.
2.2. Small molecule metabolomics
Metabolon Research Services provided Pahenu2 and C57bl/6 tissue metabolomic assessment (plasma, liver tissue, brain tissue). Data analysis applied previously described means [22–26]. Both automated and visual comparison of ion features to reference standards (retention time, mass-to-charge ratio, fragmentation mass spectra) was determined. Statistical analysis applied “R” version 2.14 where p ≤ 0.05 determined significant differences.
2.3. Oroboros high-resolution respirometry
Freshly collected Pahenu2 frontal cortex brain tissue and C57bl/6 control frontal cortex tissue was minced and homogenized in 0.2 M mannitol, 50 mM sucrose, 10 mM KCl, 1 mM EDTA, 2.5 mM bovine serum albumin, 10 mM Hepes, pH 7.4. Homogenates were cleared by centrifugation (600 ×g) and subsequently the mitochondrial fraction was pelleted by centrifugation (10,000 ×g). The mitochondria fraction was dispersed in MiR05 mitochondrial respiration buffer [27] and used immediately.
An Oroboros Oxygraph-2 K was applied to measure mitochondrial respiration [28]. Substrate additions were cytochrome C (10 μM) and malate (2 mM) combined, followed by 5 mM ADP to stimulate state 3 respiration. Next, 5 mM pyruvate and 10 mM glutamate were added to drive Complex I and 10 mM succinate to drive combined activity of Complex I + II. Finally, rotenone was applied, inhibiting complex 1 to enable determination of complex II oxygen consumption. Oxygen consumption rates were normalized to protein content.
2.4. Reactive oxygen species measurement with 2′,7′-dichlorodihydrofluorescein diacetate (DCF)
In Pahenu2 mouse frontal cortex brain tissue, reactive oxygen species were measured utilizing the DCF protocol [29]. Sample preparation for reactive oxygen assessment utilizes the protocol described above for Oroboros high-resolution respirometry. Spectrophotometric measurement uses excitation at 485 nm and emission at 520 nm, with normalization to protein content. Samples from six Pahenu2 and six control C57bl/6 animals were assessed. Data analysis applied Graphpad software and student t-test.
2.5. NADP/NADPH quantification
In Pahenu2 mouse frontal cortex tissue, NADP and NADPH were quantified with the Sigma NADP/NADPH Assay Kit (catalog number MAK321) according to the manufacturer. NADP/NADPH quantification is based on a glucose dehydrogenase cycling reaction, where NADPH probe reduction creates a fluorescent product [30]. Samples from six Pahenu2 and six control C57bl/6 animals were assessed. Data analysis applied Graphpad software and student t-test.
3. Results
3.1. Small molecule metabolomics
Table 1 provides fold-differences of selected blood plasma, liver tissue, and brain tissue analytes where experimental Pahenu2 samples are compared to equivalent C57bl/6 control samples. Unless specifically indicated, Tables 1 Pahenu2 tissue analytes possess statistically significant differences (p ≤ 0.05) from controls. Analyte profiles from Pahenu2 liver and plasma, excluding PHE, PHE-conjugates, and PHE catabolites, are not overtly abnormal. Pronounced analyte misrepresentation occurs in brain tissue. Similar to plasma and liver, Pahenu2 brain over-represents Phe, Phe catabolites, and Phe-conjugates. However, the Pah-enu2 brain evidences cerebral oxidative stress responses (glutathione pathway, homocarnosine pathway) and energy dysregulation (glycolysis, increased NADH/NAD ratio). Fig. 1A is a general pathway schematic for Phe metabolism relevant to all tissues assessed. Fig. 1B is a schematic of metabolomic data relating to intrinsic cerebral oxidative stress responses by homocarnosine and glutathione pathways. Homocarnosine synthesis condenses His and γ-aminobutyrate. Putrescine and N-acetylputrescine are proximal analytes in cerebral γ-aminobutyrate synthesis; putrescine is over-represented. His is over-represented and chronic over-representation is evidenced by concurrent over-representation of His conjugates (N-acetylhistidine, γ-glutamylhistidine, 1-carboxyethylhistidine) and the His catabolite histamine (Table 1). Conjugates of His (acetyl, γ-glutamyl, 1-carboxyethyl) are identical to conjugates over-represented secondary to hyperphenylalaninemia (Fig. 1A, Table 1). Metabolomics did not resolve γ-aminobutyrate. Evidence is emerging for the role of homocarnosine as a neuroprotective antioxidant. Over-representation of oxidized glutathione and cysteine-glutathione disulfide provide further evidence of cerebral oxidative stress response (Table 1).
Table 1.
Pahenu2 metabolomics: plasma, liver, brain.
| Plasma | Liver | Brain | |
|---|---|---|---|
| Phe and Related | |||
| Phenylalanine | 16.78 | 4.10 | 6.05 |
| N-acetylphenylalanine | 37.72 | 8.99 | 26.98 |
| N-formylphenylalanine | 9.44 | 3.99 | 7.38 |
| γ-glutamylphenylalanine | 36.46 | 42.70 | 20.75 |
| 1-carboxyethylphenylalanine | 13.90 | 8.72 | 11.47 |
| Phenylpyruvate | 283.06 | 21.27 | ND |
| Phenyllactate | 104.15 | 96.25 | 101.42 |
| Phenylacetate | 23.15 | ND | ND |
| 2-hydroxyphenylacetate | 37.16 | 20.34 | ND |
| Tyr and Related | |||
| Tyrosine | 0.74 | 0.96 ns | 0.62 |
| N-acetyltyrosine | 1.51 | 0.94 ns | 1.37 |
| Dopamine | ND | ND | 0.83 ns |
| Trp and Related | |||
| Tryptophan | 0.84 ns | 0.95 ns | 0.65 |
| Serotonin | 0.32 | 0.15 | 0.44 |
| Kynurenine | 0.58 | 0.67 | 0.27 |
| Glutathione | |||
| Glutathione reduced | ND | 0.82 ns | 0.64 ns |
| Glutathione oxidized | 0.43 ns | 1.12 ns | 1.21 |
| Cysteine-glutathione disulfide | 0.41 ns | 1.03 ns | 1.28 |
| Cysteinylglycine | ND | 0.68 | 0.86 ns |
| 5-oxoproline | 0.82 ns | 1.00 ns | 0.99 ns |
| Sulfocysteine | 1.39 ns | ND | ND |
| Homocarnosine Pathway | |||
| Histidine | 1.13 ns | 0.92 ns | 1.54 |
| N-acetylhistidine | 1.26 ns | 1.12 ns | 3.11 |
| 1-carboxyethylhistidine | ND | 0.59 | 1.62 |
| γ-glutamylhistidine | 1.06 ns | 1.19 ns | 1.62 |
| Histamine | 1.15 ns | 1.32 ns | 2.09 |
| Homocarnosine | ND | ND | 1.65 |
| Putrescine | 1.00 ns | 1.01 ns | 1.26 |
| N-acetylputrescine | 1.27 ns | 1.24 ns | 1.01 ns |
| γ-aminobutyrate | ND | ND | ND |
| Glycolysis and Respiratory Complex 1 | |||
| Glucose 6-phosphate | 0.68 | 0.75 | 1.60 |
| Fructose 1,6-diphosphate | ND | 1.26 ns | 1.90 |
| Dihydroxyacetone phosphate | ND | 1.55 ns | 1.75 |
| 2,3-diphosphoglycerate | ND | ND | ND |
| 2-phosphoglycerate | 0.38 | 1.32 ns | ND |
| 3-phosphoglycerate | 0.52 | 1.47 ns | 1.45 |
| Phosphoenolpyruvate | 0.40 | 1.25 ns | 1.69 |
| Pyruvate | 1.07 ns | 1.01 ns | 0.93 ns |
| Lactate | 1.00 ns | 0.92 ns | 1.01 ns |
| NADH | ND | 1.06 ns | 2.99 |
| NAD | ND | 0.92 ns | 0.64 |
| Lipid Related Analytes | |||
| Malonate# | 1.41 ns | 1.16 ns | 1.24 |
| Acetyl CoA | ND | 0.79 ns | 1.09 ns |
| 3-hydroxy-3-methylglutarate | 1.45 | 1.37 ns | 0.97 ns |
| Cholesterol+ | 1.79 ns | 1.08 ns | 0.95 ns |
| Docosahexaenoate* | 1.43 ns | 0.95 ns | 1.09 ns |
| Eicosapentaenoate* | 1.10 ns | 1.18 ns | 1.44 ns |
Fig. 1.


A.Phe metabolism in Pahenu2blood, liver, and brain tissue.
+analyte not observed in liver tissue; #analyte not observed in brain tissue
B. Intrinsic cerebral anti-oxidative responses. Over-represented analytes are highlighted. Pathway analytes not identified by metabolomics or showing normal representation are in black font. Left side: Homocarnosine synthesis pathway. Chronic His over representation is demonstrated by conjugation reactions (similar to Phe conjugates see Fig. 1A) and the catabolite histamine. Right side: Glutathione pathway. ROS = reactive oxygen species
C. Cerebral energy dysregulation. Over-represented analytes are highlighted. Pathway analytes not identified by metabolomics or showing normal representation are in black font. Upper Area: Pahenu2 frontal cortex over-represented glycolysis analytes. Lower Area: NADH over-representation with increased NADH/NAD ratio suggests respiratory chain complex 1 deficit, confirmed in Fig. 2 respirometry.
Altered representation of glycolysis and respiratory chain complex 1 analytes provide evidence of cerebral energy dysregulation. Fig. 1C provides a schematic of cerebral energy metabolism. An elevated NADH/NAD ratio suggests respiratory chain complex 1 dysregulation. Below, respirometry (Fig. 2) provides confirmatory evidence of respiratory chain complex 1 dysfunction. Glycolysis pathway analyte over-representation (Table 1) evidences glycolytic compensation for reduced cerebral oxidative energy production.
Fig. 2.

Oxygen consumption rates by respirometry using fresh mouse frontal cortex mitochondria. Black arrows indicate substrate additions; Green font indicates flux response of Complex I (CI), Complex II (CII), and combined CI + CII. Mal = malate; ADP = adenosine diphosphate; Pyr = pyruvate; Glu = glutamate; Suc = succinate; Rot = rotenone
3.2. Respirometry identifies mitochondrial dysfunction in Pahenu2 frontal cortex
Fig. 2 provides a representative Oroboros oxygen consumption trace comparing substrate-induced respiratory activation in mitochondria prepared from frontal cortex tissue of an unmanaged Pahenu2 mouse and a wild-type littermate. Two additional assessments (Pahenu2 vs Control) were performed, generating identical results. Complex 1 respiration in response to pyruvate substrate is attenuated. Pahenu2 respiration in response to glutamate is similar to control albeit starting from a lower baseline. Complex II induction by succinate substrate is similar between Pahenu2 and wild-type controls. Upon rotenone Complex I inhibition, Pahenu2 and wild-type mitochondria respire at similar rates, serving as further indication respiration through Complex II was not impacted in Paheu2 brain. These data suggest a Complex I deficit in response to pyruvate substrate to support metabolomic data (increased NADH/NAD ratio, Table 1, Fig. 1A).
Respirometry was performed with Pahenu2 liver tissue. Substrate-induced liver mitochondria respiration through Complexes I and II was in-distinguishable between Pahenu2 and C57bl/6 controls (data not shown). Unlike brain tissue, in the context of PAH deficiency, liver tissue has no clinical phenotype. We posit altered biochemical homeostasis induces a secondary mitochondrial deficit in one or more cell populations within affected tissue (e.g. brain) while unaffected tissue (e.g. liver) retain normal mitochondrial function. These data do not identify means by which some tissues are refractory (liver) while others are sensitive (brain, bone).
3.3. Pahenu2 cerebral oxidative stress
Table 1 demonstrates an oxidative stress response (homocarnosine pathway, glutathione pathway) in Pahenu2 brain tissue. Fig. 3 shows brain tissue 2′,7′-dichlorodihydrofluorescein diacetate (DCF) fluorescence from cohorts of 6 Pahenu2 animals (3 male, 3 female) and 6 control animals (3 male, 3 female). A statistically significant increase in DCF fluorescence (p ≤ 0.001), indicating increased ROS in the Pahenu2 brain demonstrates oxidative stress further evidenced by the anti-oxidative response (Fig. 1B, Table 1).
Fig. 3.
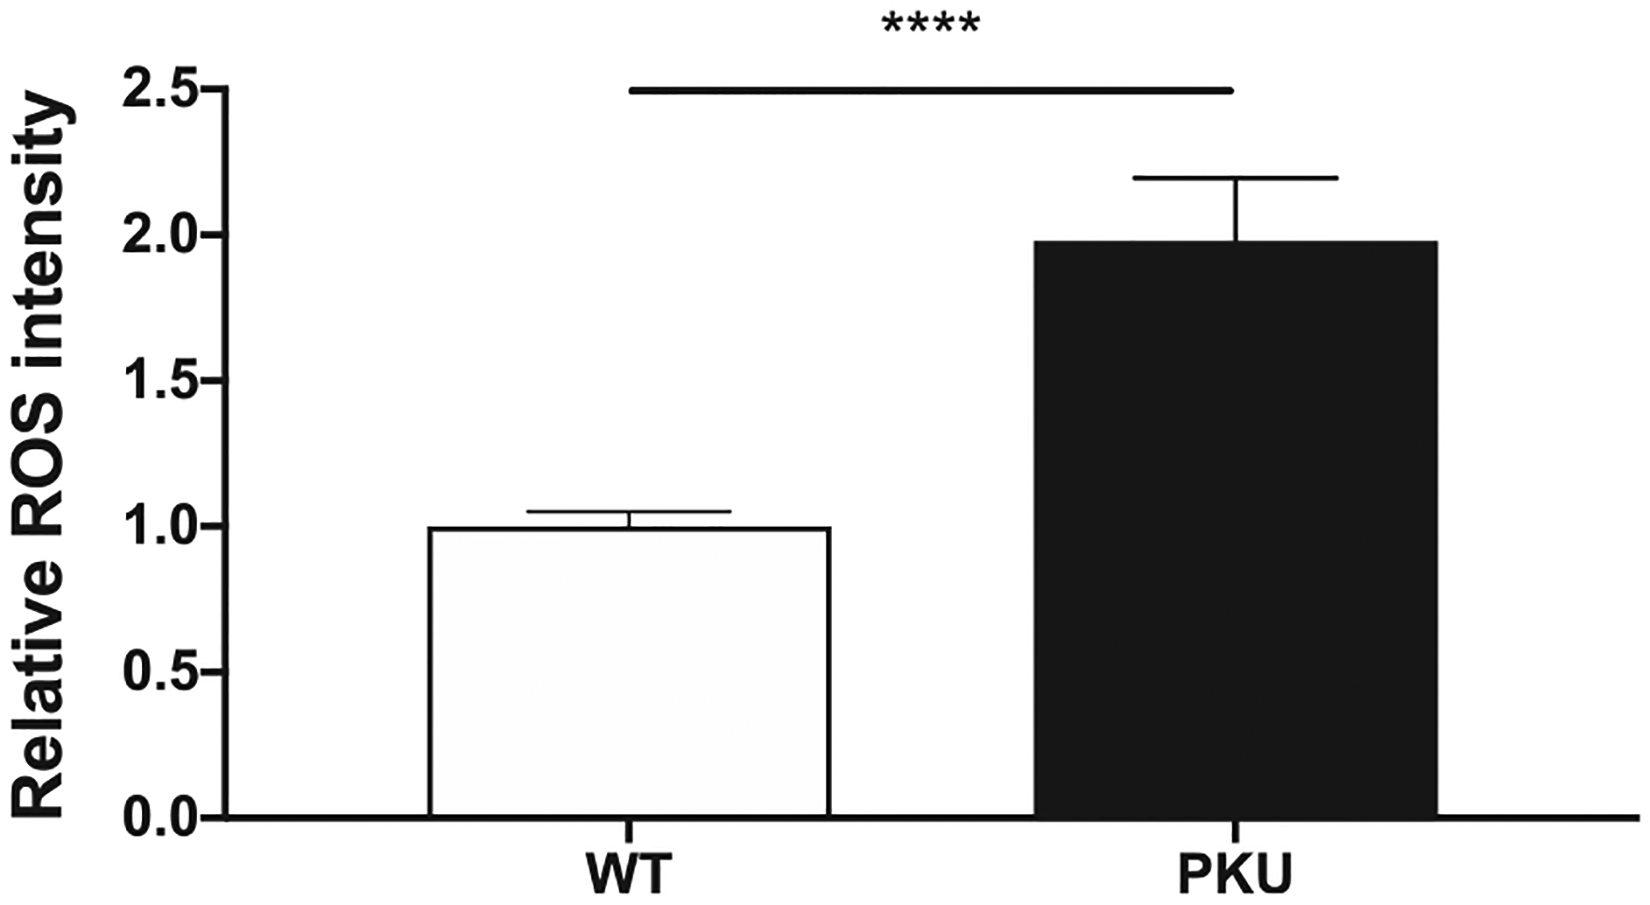
Reactive oxygen species in brain tissue. Brain tissue from six C57bl/6 control animals (3 male, 3 female) and six hyperphenylalaninemic Pahenu2 animals (3 male, 3 female) were assessed. **** p≤0.001
3.4. Pahenu2 altered cerebral NADP and NADPH representation
Glutathione reductase requires niacinamide adenine dinucleotide phosphate (NADPH) cofactor to drive anti-oxidative response by glutathione disulfide cleavage. Glucose-6-phosphate dehydrogenase, whose activity is inhibited by the Phe catabolite phenylpyruvate, is a critical source of cerebral NADPH [31]. Fig. 4 shows brain concentrations of NADP and NADPH from cohorts of 6 Pahenu2 animals (3 male, 3 female) and 6 C57bl/6 animals (3 male, 3 female). Compared to C57bl/6, Pahenu2 brain NADPH representation is reduced while NADP is over-represented. Table 1 shows over-representation of cysteine-glutathione disulfide the glutathione reductase substrate. Under-represented NADPH may constrain glutathione reductase activity allowing cysteine-glutathione disulfide accumulation.
Fig. 4.
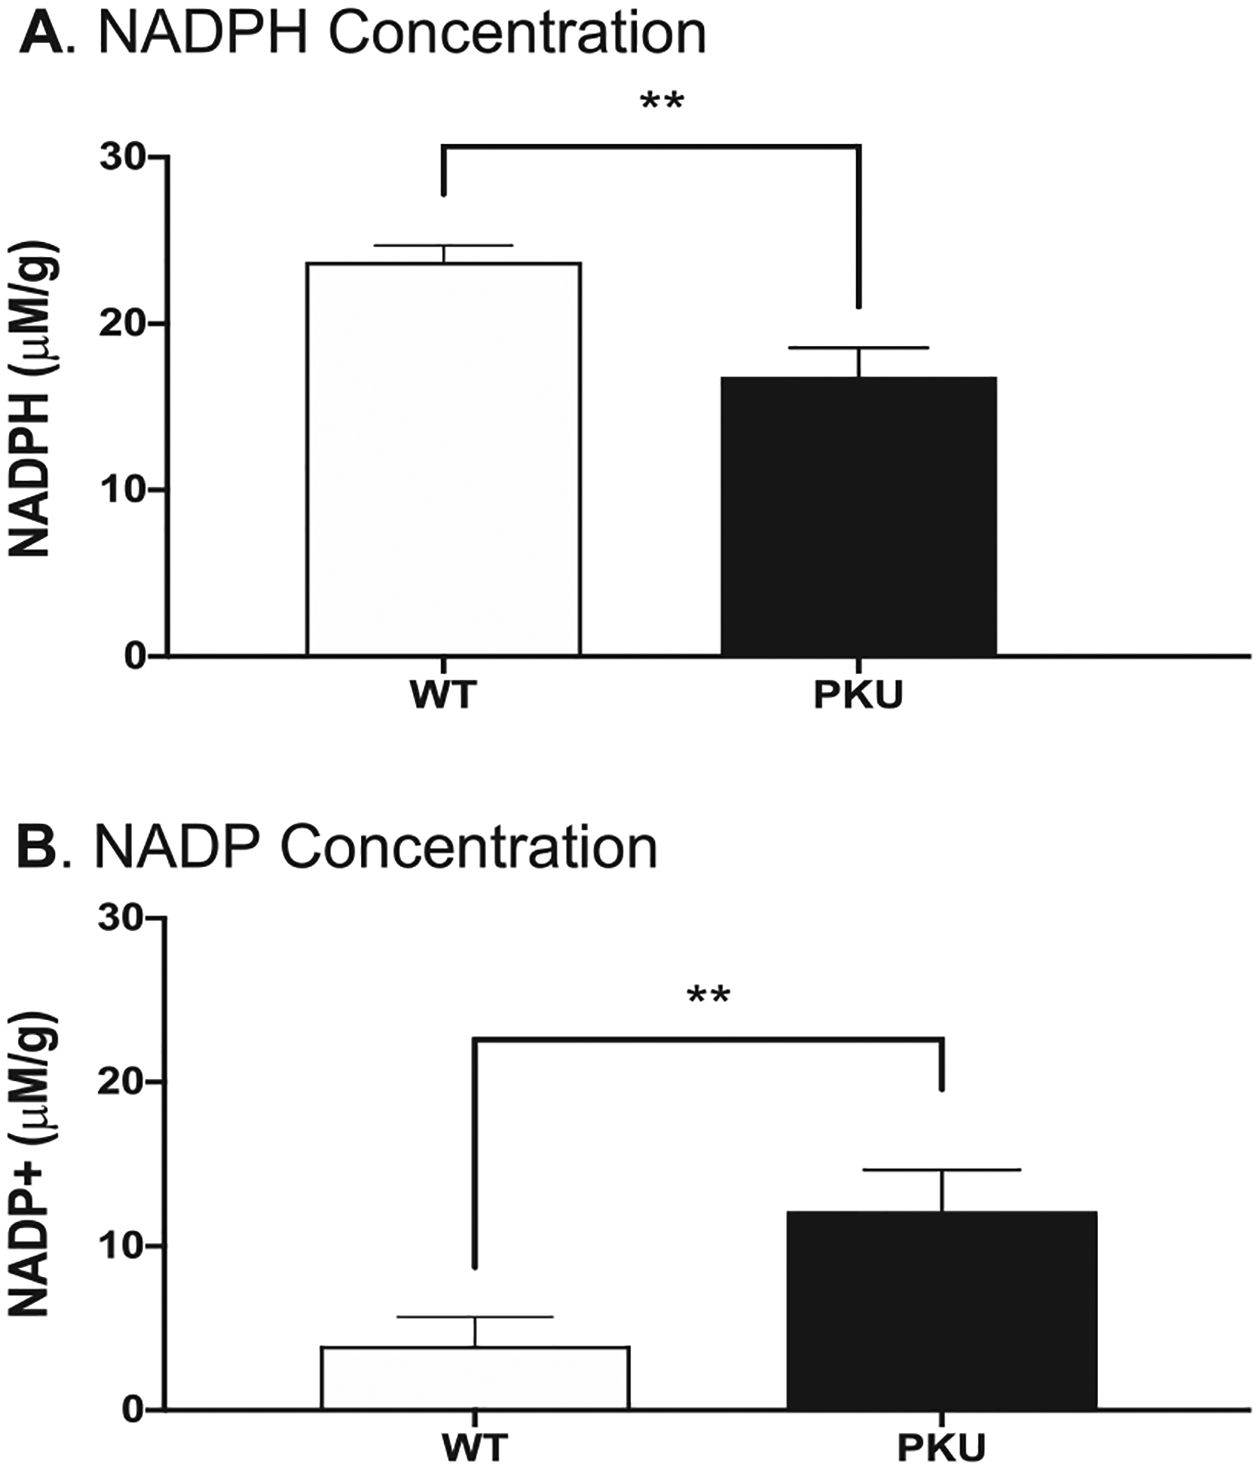
Frontal cortex tissue from six Pahenu2 and six C57bl/6 were assayed for NADP and NADPH. Fig. 4A. Quantification of NADPH. Fig. 4B. Quantification of NADP. ** p≤0.01 μM/g = micromole per gram tissue
4. Discussion
Plasma Phe concentration and the Phe/Tyr ratio are metrics applied to PKU diagnosis and following application of disease management, as the primary gauge monitoring interventional efficacy [8,9]. Measurement of primary Phe catabolites, phenylpyruvate and phenyllactate, has been performed in patients; however, these analytes are not applied in diagnostics or management monitoring. The entirety of PKU biochemical homeostasis remains poorly characterized. In the inborn error of metabolism space, metabolomics provides a natural extension to common targeted analyte assessment (e.g. acylcarnitines, amino acids). Metabolomics enables extensive characterization of biochemical homeostasis, provides pathophysiological insight, and may provide means to ascertain unrealized interventional routes [26,32,33].
Hyperphenylalaninemia is systemic in PKU, yet severe phenotypes are restricted to the brain and to a lesser extent bone. Metabolomics determined Phe, Phe catabolites, and Phe conjugates are over-represented in all tissues assessed; however, brain tissue, which realizes severe clinical phenotypes, displays a unique pattern of altered biochemical elements. Two themes are apparent in the PKU brain metabolomic profile: 1. Altered energy metabolism and 2. Anti-oxidative responses. Legacy data from the late 1960’s to mid-1970s identified aberrant PKU mitochondria function [34–37]. Contemporary investigations further a case for PKU energy dysregulation [28,38–42]. We have shown in the Pahenu2 mouse, a brain-restricted increased NADH/NAD ratio (Table 1) suggesting respiratory chain complex 1 dysfunction where respirometry functionally confirmed reduced complex 1 activity (Fig. 2). Moreover, brain over-representation of glycolysis pathway analytes suggests reduced oxidative energy production induces glycolysis pathway compensation. Phe restriction prompts a degree of reversibility in PKU white matter disease [18]. We posit Phe management lowers oxidative stress and increases oxidative energy production enabling white matter restoration, mirroring reversible cardiac phenotypes in long chain fatty acid oxidation defects when intervention restores energy homeostasis [43].
Oxidative stress in PKU is established [44,45]. Pahenu2 brain oxidative stress responses are apparent by glutathione and homocarnosine pathways analytes. Fig. 3 reactive oxygen species over-representation confirms cerebral oxidative stress. Glutathione is the most recognized antioxidant system, while the role of homocarnosine in oxidative neuro-protection is emerging [46,47]. Inborn errors of metabolism where oxidative stress is recognized includes peroxisomal disorders and mutase deficient methylmalonic acidemia (MMA). Respiratory complex inhibition in MMA is attributed to methylmalonate and its metabolites malonate and methylcitrate [48–53]. Dysfunction of multiple respiratory chain complexes is implicated [54–56]. Reduced glutathione is observed in MMA patients and animal models [57]. Culture studies in SHS-5Y cells suggest methylmalonate exposure reduces cellular glutathione; however, further investigation is necessary to establish in vivo cerebral effect [58]. As peroxisomal very long chain fatty acid oxidation creates hydrogen peroxide, it is logical peroxisome functional defects would precipitate oxidative stress. Mechanisms of peroxisomal disorder oxidative stress are two-fold: 1. ROS of peroxisomal origin; and 2. ROS of mitochondrial origin. Relevant to our PKU studies, in X-linked adrenoleucodystrophy hexacosanoic acid (C26:0) directly impairs oxidative phosphorylation upregulating ROS production [59,60]. Further, phytanate, the analyte over-represented in Refsum disease, is recognized to specifically inhibit respiratory chain complex 1 generating oxidative stress [61]. It would be highly relevant to compare tissue metabolomics among inborn errors for common themes (e.g. analyte patterns) related to oxidative stress to aid in ascertaining clinical significance.
Data presented herein does not provide mechanisms underlying either PKU cerebral respiratory chain deficit or oxidative stress. However, prior investigations and data provided herein provide a level of insight. The Phe catabolite phenylpyruvate is a characterized inhibitor of glucose-6-phosphate dehydrogenase (G6PD, UniProt O95479) and mitochondrial pyruvate carrier (UniProt Q9Y5U8, O95563) [31,62,63]. Fig. 2 respirometry applies substrates to activate respiratory chain complex 1 and complex 2. Control mitochondria respond robustly to pyruvate substrate, while Pahenu2 mitochondria response is attenuated. Succinate driven respiratory complex 2 activation is similar between control and Pahenu2 mitochondria. Attenuated response to pyruvate substrate suggests the PKU catabolite phenylpyruvate inhibits mitochondria pyruvate transport, subsequently limiting complex 1 response. Prior studies indicate phenylpyruvate inhibits G6PD [31]. In the pentose phosphate pathway, G6PD is rate limiting but equally important, G6PD produces (along with 6-phosphogluconate dehydrogenase, UniProt P52209) nicotinamide adenine dinucleotide phosphate (NADPH) the glutathione reductase (UniProt P78417) obligatory cofactor. Table 1 identifies glutathione disulfide in Pahenu2 brain. Glutathione reductase, in an NADPH dependent manner, cleaves glutathione disulfide to glutathione monomers. Phenylpyruvate down-regulation of pentose phosphate pathway oxidative steps reduces NADPH production attenuating glutathione reductase participation in oxidative stress management. Concurrently inhibiting pyruvate transport and G6PD, phenylpyruvate is complicit in energy deficit and oxidative stress. Metabolomics resolved phenylpyruvate in liver and plasma demonstrating over-representation. Phenylpyruvate was not resolved in brain. Brain phenyllactate is increased 101-fold being the analyte immediately distal to phenylpyruvate; therefore, indicating phenylpyruvate over-representation in cerebral tissue. While our analyte and functional data support a cerebral PKU respiratory deficit restricted to complex 1, further investigation is required to characterize mechanisms underlying the energy deficit.
Metabolomics identified relatively consistent analyte profiles between blood and liver providing little evidence of energy dysregulation or oxidative stress response. Energy dysregulation and oxidative stress response is brain restricted. A recent analyte study in succinylsemialdehyde dehydrogenase deficiency determined relevant analyte disruption occurred in affected tissue and peripheral blood was a less informative source of pathological analytes [64]. We previously reported altered epigenome homeostasis in brain tissue of PKU patients and the Pahenu2 mouse [21,65]. Oxidative stress induces epigenome re-patterning [66–68]. We theorize oxidative stress is a proximal step in PKU brain pathology precipitating down-stream elements including epigenome-mediated alteration of gene function (promoter methylation, micro-RNA). We view PKU neuropathology as far more complex than simple traditional models of asymmetric blood:brain barrier amino acid transport precipitating direct Phe tissue toxicity and neurotransmitter paucities. Patient presentation such as lower IQ compared to siblings and the plethora of late onset neurologic phenotypes evidence standard of care treatment is suboptimal. Characterizing the entirety of PKU pathology will enable more thorough and effective treatment regimens. We suggest cerebral energy support and oxidative stress reduction may ameliorate residual early onset and late onset PKU neurologic phenotypes.
Table 1. Assessment used terminal draw plasma, liver tissue, and frontal cortex brain tissue from six Pahenu2 animals receiving standard diet. Control samples (plasma, liver, frontal cortex brain) used six C57bl/6 animals receiving standard diet. Fold change are statistically significant unless specifically indicated. ND not detected, the analyte was not identified; ns not significant, the fold change does not differ from controls; # acetylCoA ester of malonate is rate limiting in lipid [1] synthesis; + Cholesterol reported low in human PKU brain tissue. * Docosahexaenoate and eicosapentaenoate previously reported low in human PKU plasma.
References
- [1].Guthrie R, Sussi A, A simple phenylalanine method for detecting phenylketonuria in large populations of newborn infants, Pediatrics. 32 (1963) 318–322. [PubMed] [Google Scholar]
- [2].Bickel H, Gerrard J, Hickmans EM, Influence of phenylalanine intake on phenylketonuria, Lancet. 265 (1953) 812. [DOI] [PubMed] [Google Scholar]
- [3].MacCready RA, Admissions of phenylketonuric patients to residential institutions before and after screening programs of the newborn infant, J. Pediatr 85 (1974) 383. [DOI] [PubMed] [Google Scholar]
- [4].Azabdaftari A, van der Giet M, Schuchardt M, Hennermann JB, Plöckinger U, Querfeld U, The cardiovascular phenotype of adult patients with phenylketonuria, Orphanet J Rare Dis 14 (2019) 213. [DOI] [PMC free article] [PubMed] [Google Scholar]
- [5].Demirdas S, Coakley KE, Bisschop PH, Hollak CE, Bosch AM, Singh RH, Bone health in phenylketonuria: a systematic review and meta-analysis, Orphanet J Rare Dis 10 (2015) 17. [DOI] [PMC free article] [PubMed] [Google Scholar]
- [6].Serfozo C, Barta AG, Horvath E, Sumanszki C, Csakany B, Resch M, Nagy ZZ, Reismann P, Altered visual functions, macular ganglion cell and papillary retinal nerve fiber layer thickness in early-treated adult PKU patients, Mol Genet Metab Rep 25 (2020), 100649. [DOI] [PMC free article] [PubMed] [Google Scholar]
- [7].Jervis GA, Phenylpyruvic oligophrenia: deficiency of phenylalanine oxidizing system, Proc. Soc. Exp. Biol. Med 82 (1953) 514. [PubMed] [Google Scholar]
- [8].van Spronsen FJ, van Wegberg AM, Ahring K, Bélanger-Quintana A, Blau N, Bosch AM, Burlina A, Campistol J, Feillet F, Giżewska M, Huijbregts SC, Kearney S, Leuzzi V, Maillot F, Muntau AC, Trefz FK, van Rijn M, Walter JH, MacDonald A, Key European guidelines for the diagnosis and management of patients with phenylketonuria, Lancet Diabetes Endocrinol 5 (2017) 743–756. [DOI] [PubMed] [Google Scholar]
- [9].Vockley J, Andersson HC, Antshel KM, Braverman NE, Burton BK, Frazier DM, Mitchell J, Smith WE, Thompson BH, Berry SA, Phenylalanine hydroxylase deficiency: diagnosis and management guideline, Genet Med 16 (2014) 188–200. [DOI] [PubMed] [Google Scholar]
- [10].Muntau AC, Adams DJ, Bélanger-Quintana A, Bushueva TV, Cerone R, Chien YH, Chiesa A, Coşkun T, de Las Heras J., Feillet F, Katz R, Lagler F, Piazzon F, Rohr F, van Spronsen FJ, Vargas P, Wilcox G, Bhattacharya K, International best practice for the evaluation of responsiveness to sapropterin dihydrochloride in patients with phenylketonuria, Mol. Genet. Metab 127 (2019) 1–11. [DOI] [PubMed] [Google Scholar]
- [11].Mahan KC, Gandhi MA, Anand S, Pegvaliase: a novel treatment option for adults with phenylketonuria, Curr. Med. Res. Opin 35 (2019) 647–651. [DOI] [PubMed] [Google Scholar]
- [12].de Groot MJ, Hoeksma M, Blau N, Reijngoud DJ, van Spronsen FJ, Pathogenesis of cognitive dysfunction in phenylketonuria: review of hypotheses, Mol. Genet. Metab 99 (Suppl. 1) (2010) S86–S89. [DOI] [PubMed] [Google Scholar]
- [13].McKean CM, The effects of high phenylalanine concentrations on serotonin and catecholamine metabolism in the human brain, Brain Res 47 (1972) 469–476. [DOI] [PubMed] [Google Scholar]
- [14].Butler IJ, O’Flynn ME, Seifert WE, Howell RR, Neurotransmitter defects and treatment of disorders of hyperphenylalaninemia, J. Pediatr 98 (1981) 729–733. [DOI] [PubMed] [Google Scholar]
- [15].van Spronsen FJ, Hoeksma M, Reijngoud DJ, Brain dysfunction in phenylketonuria: is phenylalanine toxicity the only possible cause? J. Inherit. Metab. Dis 32 (2009) 46–51. [DOI] [PubMed] [Google Scholar]
- [16]. https://omim.org/entry/605407.
- [17].Nardecchia F, Manti F, Chiarotti F, Carducci C, Carducci C, Leuzzi V, Neurocognitive and neuroimaging outcome of early treated young adult PKU patients: A longitudinal study, Mol. Genet. Metab 115 (2015) 84–90. [DOI] [PubMed] [Google Scholar]
- [18].Anderson PJ, Leuzzi V, White matter pathology in phenylketonuria, Mol. Genet. Metab 99 (Suppl. 1) (2010) S3–S9. [DOI] [PubMed] [Google Scholar]
- [19].Ikawa M, Okazawa H, Yoneda M, Molecular imaging for mitochondrial metabolism and oxidative stress in mitochondrial diseases and neurodegenerative disorders, Biochim. Biophys. Acta Gen. Subj 1865 (2020), 129832. [DOI] [PubMed] [Google Scholar]
- [20].Dorszewska J, Kowalska M, Prendecki M, Piekut T, Kozłowska J, Kozubski W, Oxidative stress factors in Parkinson’s disease, Neural Regen. Res 16 (2021) 1383–1391. [DOI] [PMC free article] [PubMed] [Google Scholar]
- [21].Dobrowolski SF, Lyons-Weiler J, Spridik K, Vockley J, Skvorak K, Biery A, DNA methylation in the pathophysiology of hyperphenylalaninemia in the PAH(enu2) mouse model of phenylketonuria, Mol. Genet. Metab 119 (2016) 1–7. [DOI] [PMC free article] [PubMed] [Google Scholar]
- [22]. https://www.metabolon.com/.
- [23].Dehaven CD, Evans AM, Dai H, Lawton KA, Organization of GC/MS and LC/MS metabolomics data into chemical libraries, Aust. J. Chem 2 (2010) 9. [DOI] [PMC free article] [PubMed] [Google Scholar]
- [24].DeHaven CD, Evans AM, Dai H, Lawton KA, Software techniques for enabling high-throughput analysis of metabolomic datasets Roessner U (Ed.), Metabolomics, InTech, 2012. 167–192. [Google Scholar]
- [25].Quell JD, Römisch-Margl W, Colombo M, Krumsiek J, Evans AM, Mohney R, Salomaa V, de Faire U, Groop LC, Agakov F, Looker HC, McKeigue P, Colhoun HM, Kastenmüller G, Automated pathway and reaction prediction facilitates in silico identification of unknown metabolites in human cohort studies, J. Chromatogr. B Anal. Technol. Biomed. Life Sci 1071 (2017) 58–67. [DOI] [PubMed] [Google Scholar]
- [26].Dobrowolski SF, Alodaib A, Karunanidhi A, Basu S, Holecko M, Lichter-Konecki U, Pappan KL, Vockley J, Clinical, biochemical, mitochondrial, and metabolomic aspects of methylmalonate semialdehyde dehydrogenase deficiency: Report of a fifth case, Mol. Genet. Metab 129 (2020) 272–277. [DOI] [PubMed] [Google Scholar]
- [27].Zhang Y, Bharathi SS, Rardin MJ, Lu J, Maringer KV, Sims-Lucas S, Prochownik EV, Gibson BW, Goetzman ES, Lysine desuccinylase SIRT5 binds to cardiolipin and regulates the electron transport chain, J. Biol. Chem 292 (2017) 10239–10249. [DOI] [PMC free article] [PubMed] [Google Scholar]
- [28].Dobrowolski SF, Sudano C, Phua YL, Tourkova IL, Spridik K, Goetzman ES, Vockley J, Blair HC, Mesenchymal stem cell energy deficit and oxidative stress contribute to osteopenia in the Pahenu2 classical PKU mouse, Mol. Genet. Metab 132 (2021) 173–179. [DOI] [PMC free article] [PubMed] [Google Scholar]
- [29].Wang X, Roper MG, Measurement of DCF fluorescence as a measure of reactive oxygen species in murine islets of Langerhans, Anal. Methods 6 (2014) 3019–3024. [DOI] [PMC free article] [PubMed] [Google Scholar]
- [30].Matsumura H, Miyachi S, Cycling assay for nicotinamide adenine dinucleotides, Methods Enzymol 69 (1980) 465–470. [Google Scholar]
- [31].Rosa AP, Jacques CED, Moraes TB, Wannmacher CMD, Dutra ADM, Dutra-Filho CS, Phenylpyruvic acid decreases glucose-6-phosphate dehydrogenase activity in rat brain, Cell. Mol. Neurobiol 32 (2012) 1113–1118. [DOI] [PMC free article] [PubMed] [Google Scholar]
- [32].Kirby T, Walters DC, Brown M, Jansen E, Salomons GS, Turgeon C, Rinaldo P, Arning E, Ashcraft P, Bottiglieri T, Roullet JB, Gibson KM, Post-mortem tissue analyses in a patient with succinic semialdehyde dehydrogenase deficiency (SSADHD). I. Metabolomic outcomes, Metab. Brain Dis 35 (2020) 601–614. [DOI] [PMC free article] [PubMed] [Google Scholar]
- [33].Burrage LC, Thistlethwaite L, Stroup BM, Sun Q, Miller MJ, Nagamani SCS, Craigen W, Scaglia F, Sutton VR, Graham B, Kennedy AD, Members of the UCDC. Untargeted metabolomic profiling reveals multiple pathway perturbations and new clinical biomarkers in urea cycle disorders, Genet Med 21 (2019) 1977–1986. [DOI] [PMC free article] [PubMed] [Google Scholar]
- [34].Halestrap AP, The mitochondrial pyruvate carrier. Kinetics and specificity for substrates and inhibitors, Biochem. J 148 (1975) 85–96. [DOI] [PMC free article] [PubMed] [Google Scholar]
- [35].Patel MS, Grover WD, Auerbach VH, Pyruvate metabolism by homogenates of human brain: effects of phenylpyruvate and implications for the etiology of the mental retardation in phenylketonuria, J. Neurochem 20 (1973) 289–296. [DOI] [PubMed] [Google Scholar]
- [36].Weber G, Inhibition of human brain pyruvate kinase and hexokinase by phenylalanine and phenylpyruvate: possible relevance to phenylketonuric brain damage, Proc. Natl. Acad. Sci. U. S. A 63 (1969) 1365–1369. [DOI] [PMC free article] [PubMed] [Google Scholar]
- [37].Patel MS, Arinze IJ, Phenylketonuria: metabolic alterations induced by phenylalanine and phenylpyruvate, Am. J. Clin. Nutr 28 (1975) 183–188. [DOI] [PubMed] [Google Scholar]
- [38].Mezzomo NJ, Becker Borin D, Ianiski F, Dotto Fontana B, Diehl de Franceschi I, Bolzan J, Garcez R, Grings M, Parmeggiani B, da Silva Fernandes L, de Almeida Vaucher R, Leipnitz G, Duval Wannmacher CM, Cielo Rech V, Creatine nanoliposome reverts the HPA-induced damage in complex II-III activity of the rats’ cerebral cortex, Mol. Biol. Rep 46 (2019) 5897–5908. [DOI] [PubMed] [Google Scholar]
- [39].Bortoluzzi VT, Brust L, Preissler T, de Franceschi ID, Wannmacher CMD, Creatine plus pyruvate supplementation prevents oxidative stress and phosphotransfer network disturbances in the brain of rats subjected to chemically-induced phenylketonuria, Metab. Brain Dis 34 (2019) 1649–1660. [DOI] [PubMed] [Google Scholar]
- [40].Dimer NW, Ferreira BK, Agostini JF, Gomes ML, Kist LW, Malgarin F, Carvalho-Silva M, Gomes LM, Rebelo J, Frederico MJS, Silva FRMB, Rico EP, Bogo MR, Streck EL, Ferreira GC, Schuck PF, Brain bioenergetics in rats with acute hyperphenylalaninemia, Neurochem. Int 117 (2018) 188–203. [DOI] [PubMed] [Google Scholar]
- [41].Stepien KM, Heaton R, Rankin S, Murphy A, Bentley J, Sexton D, Hargreaves IP, Evidence of oxidative stress and secondary mitochondrial dysfunction in metabolic and non-metabolic disorders, J. Clin. Med 19 (6) (2017) pii: E71. [DOI] [PMC free article] [PubMed] [Google Scholar]
- [42].Rech VC, Feksa LR, Dutra-Filho CS, Wyse AT, Wajner M, Wannmacher CM, Inhibition of the mitochondrial respiratory chain by phenylalanine in rat cerebral cortex, Neurochem. Res 27 (2002) 353–357. [DOI] [PubMed] [Google Scholar]
- [43].Leslie ND, Valencia CA, Strauss AW, Zhang K, Very long-chain acyl-coenzyme A dehydrogenase deficiency, in: Adam MP, Ardinger HH, Pagon RA, Wallace SE, Bean LJH, Stephens K, Amemiya A (Eds.), GeneReviews, University of Washington, Seattle, Seattle (WA), 2009, 1993–2020. [PubMed] [Google Scholar]
- [44].Sitta A, Barschak AG, Deon M, Terroso T, Pires R, Giugliani R, Dutra-Filho CS, Wajner M, Vargas CR, Investigation of oxidative stress parameters in treated phenylketonuric patients, Metab. Brain Dis 21 (2006) 287–296. [DOI] [PubMed] [Google Scholar]
- [45].Sirtori LR, Dutra-Filho CS, Fitarelli D, Sitta A, Haeser A, Barschak AG, Wajner M, Coelho DM, Llesuy S, Belló-Klein A, Giugliani R, Deon M, Vargas CR, Oxidative stress in patients with phenylketonuria, Biochim. Biophys. Acta 1740 (2005) 68–73. [DOI] [PubMed] [Google Scholar]
- [46].Boldyrev AA, Stvolinsky SL, Tyulina OV, Koshelev VB, Hori N, Carpenter DO, Biochemical and physiological evidence that carnosine is an endogenous neuroprotector against free radicals, Cell. Mol. Neurobiol 17 (1997) 259–271. [DOI] [PMC free article] [PubMed] [Google Scholar]
- [47].Schön M, Mousa A, Berk M, Chia WL, Ukropec J, Majid A, Ukropcová B, de Courten B, The Potential of Carnosine in Brain-Related Disorders: A Comprehensive Review of Current Evidence, Nutrients. 11 (2019) 1196. [DOI] [PMC free article] [PubMed] [Google Scholar]
- [48].Hayasaka K, Metoki K, Satoh T, Narisawa K, Tada K, Kawakami T, Matsuo N, Aoki T, Comparison of cytosolic and mitochondrial enzyme alterations in the livers of propionic or methylmalonic acidemia: a reduction of cytochrome oxidase activity, Tohoku J. Exp. Med 137 (1982) 329–333. [DOI] [PubMed] [Google Scholar]
- [49].Richard E, Alvarez-Barrientos A, Perez B, Desviat LR, Ugarte M, Methylmalonic acidaemia leads to increased production reactive oxygen species and induction of apoptosis through the mitocondrial/caspase pathway, J. Pathol 213 (2007) 453–461. [DOI] [PubMed] [Google Scholar]
- [50].Lindblad B, Lindblad BS, Olin P, Svanberg B, Zetterstrom R, Methylmalonic academia. A disorder associated with acidosis, hyperlycaemia, and hyperlactatemia, Acta Paediatr. Scand 57 (1968) 417–424. [DOI] [PubMed] [Google Scholar]
- [51].Okun JC, Horster F, Farkas L, Feyh P, Hinz A, Sauer S, Hoffman GF, Unisicker K, Mayatepek E, Kolker S, Neurodegeneration in methylmalonic aciduria involves inhibition of complex II and the tricarboxylic acid cycle, and synergistically acting excitotoxicity, J. Biol. Chem 277 (2002) 14674–14680. [DOI] [PubMed] [Google Scholar]
- [52].Marisco PC, Ribeiro MC, Bonini JS, Lima TT, Mann KC, Brenner GM, Dutra-Filho CS, Mello CF, Ammonia potentiates methylmalonic acid-induced convulsions and TBARS production, Exp. Neurol 182 (2003) 455–460. [DOI] [PubMed] [Google Scholar]
- [53].Krahenbuhl S, Chang M, Brass EP, Hoppel CL, Decreased activities of ubiqunol; ferricytochrome c oxidoreductase (complex III) and ferrocytochrome c: Oxygen oxidoreductase (complex IV) in liver mitochondria from rats with hydroxycobalamin [C-lactam]-induced methylmalonic aciduria, J. Biol. Chem 266 (1991) 20998–21003. [PubMed] [Google Scholar]
- [54].Pettenuzzo LF, Ferreira GDC, Schmidt AL, Dutra-Filho CS, Wyse ATS, Wajner M, Differential differential inhibitory effects of methylmalonic acid on respitratory chain complex activities in rat tissues, Int. J. Dev. Neurosci 24 (2006) 45–52. [DOI] [PubMed] [Google Scholar]
- [55].Chandler RJ, Zerfas PM, Shanske S, Sloan J, Hoffman V, DiMauro S, Venditti CP, Mitochondrial dysfunction in mut methylmalonic academia, FASEB J 23 (2009) 1252–1261. [DOI] [PMC free article] [PubMed] [Google Scholar]
- [56].De Keyzer Y, Valayannopoulos V, Benoist JF, Batteux F, Lacaille F, Hubert L, Chretien D, Chadefeaux-Vekemans B, Niaudet P, Touati G, Munnich A, de Lonlay P, Multiple OXPHOS deficiency in the liver, kidney, heart, and skeletal muscle of patients with methylmalonic aciduria and propionic aciduria, Pediatr. Res 66 (2009) 91–95. [DOI] [PubMed] [Google Scholar]
- [57].Treacy E, Arbour L, Chessex P, Graham G, Kasprzak L, Casey K, Bell L, Mamer O, Scriver CR, Glutathione deficiency as a complication of methylmalonic acidemia: Response to high doses of ascorbate, J. Pediatr 129 (1996) 445–448. [DOI] [PubMed] [Google Scholar]
- [58].Atkuri KR, Cowan TM, Kwan T, Ng A, Herzenberg LA, Herzenberg LA, Enns GM, Inherited disorders affecting mitochondrial function are associated with glutathione deficiency and hypocitrullinemia, Proc. Natl. Acad. Sci. U. S. A 106 (2009) 3941–3944. [DOI] [PMC free article] [PubMed] [Google Scholar]
- [59].López-Erauskin J, Galino J, Ruiz M, Cuezva JM, Fabregat I, Cacabelos D, Boada J, Martínez J, Ferrer I, Pamplona R, Villarroya F, Portero-Otín M, Fourcade S, Pujol A, Impaired mitochondrial oxidative phosphorylation in the peroxisomal disease X-linked adrenoleukodystrophy, Hum. Mol. Genet 22 (2013) 3296–3305. [DOI] [PubMed] [Google Scholar]
- [60].Ho JK, Moser H, Kishimoto Y, Hamilton JA, Interactions of a very long chain fatty acid with model. membranes and serum albumin, Implications for the pathogenesis of adrenoleukodystrophy. J. Clin. Investig 96 (1995) 1455–1463. [DOI] [PMC free article] [PubMed] [Google Scholar]
- [61].Sarnat HB, Machin G, Darwish HZ, Rubin SZ, Mitochondrial myopathy of cerebrohepato-renal. (Zellweger) syndrome, Can. J. Neurol. Sci 10 (1983) 170–177. [DOI] [PubMed] [Google Scholar]
- [62].Halestrap AP, Brand MD, Denton RM, Inhibition of mitochondrial pyruvate transport by phenylpyruvate and alpha-ketoisocaproate, Biochim. Biophys. Acta 367 (1974) 102–108. [DOI] [PubMed] [Google Scholar]
- [63].Swierczyński J, Aleksandrowicz Z, Zydowo M, Inhibition of pyruvate oxidation by skeletal muscle mitochondria by phenylpyruvate, Acta Biochim. Pol 23 (1976) 85–92. [PubMed] [Google Scholar]
- [64].Kirby T, Walters DC, Brown M, Jansen E, Salomons GS, Turgeon C, Rinaldo P, Arning E, Ashcraft P, Bottiglieri T, Roullet JB, Gibson KM, Post-mortem tissue analyses in a patient with succinic semialdehyde dehydrogenase deficiency (SSADHD). I. Metabolomic outcomes, Metab. Brain Dis 35 (2020) 601–614. [DOI] [PMC free article] [PubMed] [Google Scholar]
- [65].Dobrowolski SF, Lyons-Weiler J, Spridik K, Biery A, Breck J, Vockley J, Yatsenko S, Sultana T, Altered DNA methylation in PAH deficient phenylketonuria, Mol. Genet. Metab 115 (2015) 72–77. [DOI] [PubMed] [Google Scholar]
- [66].Yara S, Lavoie JC, Levy E, Oxidative stress and DNA methylation regulation in the metabolic syndrome, Epigenomics. 7 (2015) 283–300. [DOI] [PubMed] [Google Scholar]
- [67].Kreuz S, Fischle W, Oxidative stress signaling to chromatin in health and disease, Epigenomics. 8 (2016) 843–862. [DOI] [PMC free article] [PubMed] [Google Scholar]
- [68].Niu Y, DesMarais TL, Tong Z, Yao Y, Costa M, Oxidative stress alters global histone modification and DNA methylation, Free Radic. Biol. Med 82 (2015) 22–28. [DOI] [PMC free article] [PubMed] [Google Scholar]