

Abstract
A diet rich in saturated fat and carbohydrates causes low-grade chronic inflammation in several organs, including the liver, ultimately driving nonalcoholic steatohepatitis. In this setting, environment-driven lipotoxicity and glucotoxicity induce liver damage, which promotes dendritic cell activation and generates a major histocompatibility complex class II (MHC-II) immunopeptidome enriched with peptides derived from proteins involved in cellular metabolism, oxidative phosphorylation, and the stress responses. Here, we demonstrated that lipotoxicity and glucotoxicity, as driven by a high-fat and high-fructose (HFHF) diet, promoted MHC-II presentation of nested T and B cell epitopes from protein disulfide isomerase family A member 3 (PDIA3), which is involved in immunogenic cell death. Increased MHC-II presentation of PDIA3 peptides was associated with antigen-specific prolifera-tion of hepatic CD4+ immune infiltrates and isotype switch of anti-PDIA3 antibodies from IgM to IgG3, indicative of cellular and humoral PDIA3 autoreactivity. Passive transfer of PDIA3-specific T cells or PDIA3-specific antibodies also exacerbated hepatocyte death, as determined by increased hepatic transaminases detected in the sera of mice subjected to an HFHF but not control diet. Increased humoral responses to PDIA3 were also observed in patients with chronic inflammatory liver conditions, including autoimmune hepatitis, primary biliary cholangitis, and type 2 diabetes. Together, our data indicated that metabolic insults caused by an HFHF diet elicited liver damage and promoted pathogenic immune autoreactivity driven by T and B cell PDIA3 epitopes.
INTRODUCTION
A typical western diet comprises 40 to 50% carbohydrates, 35 to 40% lipids, and 10 to 15% proteins. Carbohydrates generally include more monosaccharides (glucose and fructose) and disaccharides (lactose and sucrose) than complex carbohydrates, lipids are mostly saturated, and proteins mostly derive from animal products. Hence, more than 70% of Americans consume an excess of saturated fat and sugars as compared with the Dietary Guidelines outlined by the Office of Disease Prevention and Health Promotion. This dietary pattern is associated with an increased risk for obesity, metabolic alterations including type 2 diabetes (T2D), cardiovascular disease, and some cancers (1).
At the biochemical level, an excess of nutrients causes persistent oxidative and metabolic stress coupled with low-grade chronic inflammation. The connection between obesity and inflammation originally emerged from the discovery that tumor necrosis factor (TNF) is overexpressed in the adipose tissue of obese mice and contributes to insulin resistance (2). Over the years, a mechanistic link between obesity, innate immune responses, and chronic inflammation has been established in both rodent models and humans. Several proinflammatory agents including (but not limited to) the cytokines interleukin-1β (IL-1β), IL-6, IL-8, IL-9, and IL-21, the chemokines C-C motif chemokine ligand 2 (CCL2/MCP-1), CCL3, CCL5 (RANTES), and C-X3-C motif chemokine ligand 1 (CX3CL1), leukotriene B4 (LTB4), C-reactive protein (CRP), and pro-inflammatory nitric oxide synthase 2 (NOS2) are overproduced by activated macrophages, dendritic cells (DCs), neutrophils, and mast cells (3–8) in the visceral fat and liver parenchyma of obese rodents and humans (9–15). The concentration of these inflammatory mediators directly correlates with body mass index (BMI), decreasing as obese individuals experience weight loss (16).
Albeit most research on obesity, T2D, and chronic inflammation has focused on innate immunity, adaptive immune responses also play an etiological role in this setting. Thus, T lymphocytes, B cells, natural killer (NK) cells, and NKT cells have all been documented in the liver and adipose tissue of both humans and rodents with obesity and T2D (17, 18). Such adipose tissue–infiltrating T cells generally express effector molecules including granzyme B (GZMB) and interferon-γ (IFN-γ) and are polarized toward a T helper 1 (TH1) and TH17 effector/memory (CD44hi CD62Llo) phenotype (19–22), suggesting functional activation. Corroborating this notion, mice depleted for B or T cells, as well as mice genetically engineered to lack αβ T cell receptor (TCR) expression, exhibit decreased adipose tissue and muscle inflammation in response to obesity-inducing diets (23–26). Moreover, in all analyzed mice models, obesity and severity of inflammation strongly correlate to the presence of T cells displaying an activated phenotype (22, 24, 27).
Although it is now accepted that adaptive immunity plays a role in high-fat and high-fructose (HFHF)–associated tissue inflammation, whether liver- and adipose tissue–infiltrating inflammatory T cells are activated in an antigen-specific (upon TCR signaling) or bystander (by pro-inflammatory cytokines) manner is unclear. Four lines of evidence support a role for antigen-specific responses: (i) Liver- and adipose tissue–infiltrating T cells exhibit a restricted TCR repertoire as compared with splenic T cells (24); (ii) such a TCR repertoire restriction is mostly observed in the inflamed visceral fat as compared with the subcutaneous fat (28); (iii) activated macrophages and DCs mostly localize to crown-like structures surrounding necrotic adipocytes or hepatocytes, pointing to uptake of potentially antigenic material for presentation (28); and (iv) T cells lacking insulin receptor (INSR) display reduced antigen-specific proliferation and decreased production of pro-inflammatory cytokines (21). Obesity is also associated with an increased abundance of autoantibodies specific for glycolytic enzymes and proteins involved in cellular responses to stress (29, 30). Consistent with a pathogenic role for humoral immunity, therapies reducing the number of B cells improve insulin sensitivity and glucose tolerance in rodent models of obesity (19, 23, 24). Moreover, the notion that autoantibodies may be pathogenic is supported by the facts that (i) B cells secreting pro-inflammatory cytokines and promoting T cell activation in a major histocompatibility complex class I (MHC-I)– and MHC-II–dependent manner have been documented in the visceral fat of obese mice and humans (22–24); (ii) the transfer of immunoglobulin G (IgG) harvested from obese mice accelerates inflammation and insulin resistance in mice subjected to a high-fat diet (31); and (iii) adipose tissue–infiltrating B cells display the phenotype of mature IgG+ B cells (including class switch) (23). Together, these observations suggest that antigen-specific T and B cell responses support the pathogenesis of metabolic disorders including obesity and T2D. However, the identity of the antigen(s) that underlies these responses remains unknown.
Here, we reported a pathogenic T and B cell response against protein disulfide isomerase family A member 3 (PDIA3; a protein involved in immunogenic cell death also known as ERp57) in a mouse model of HFHF-associated T2D. This autoreactive response was driven by both T and B cell PDIA3-derived nested epitopes, and these epitopes were eluted in quantitatively superior femtomolar amounts from DCs of mice on an HFHF as compared with control diet. These epitopes drove a TH1- and TH17-polarized immune response in the liver and favored the generation of pathogenic anti-PDIA3 antibodies that could also be found in humans with liver-associated pathologies. Together, our findings demonstrated that metabolic insults such as an HFHF diet could elicit epitope-dependent immune autoreactivity in support of hepatic damage.
RESULTS
An HFHF diet increases immunostimulation by DCs
In this study, the effects of a diet enriched in saturated lipids and simple carbohydrates on MHC-II–mediated immune responses were analyzed. To this goal, we used two animal models of T2D/metabolic syndrome: (i) Ob/Ob mice, which have a spontaneous mutation in the leptin gene (Lepob) causing hyperphagia, rapid weight gain, and a T2D-like syndrome characterized by hyperglycemia, glucose intolerance, and elevated plasma insulin (32), and (ii) C57BL/6 mice kept on a standard (control) or HFHF diet for 3 months. The serum of both Ob/Ob mice and mice subjected to an HFHF diet manifested all the biochemical parameters associated with T2D—including hyperglycemia, hyperinsulinemia, and hypercholesterolemia—as well as elevated levels of triglycerides and fatty acids (Fig. 1A). As expected, wild-type (WT) mice on an HFHF diet exhibited a rapid increase in body weight that persisted for the duration of the experiment (Fig. 1B). To confirm metabolic alterations in vivo, we injected mice with the reactive oxygen species (ROS)–sensitive fluorescent probe CellROX (33), followed by full-body imaging, euthanasia, and imaging of select organs (Fig. 1, C and D). Both Ob/Ob mice and mice on an HFHF diet exhibited increased oxidative stress, especially in the gastrointestinal system, spleens, kidneys, adipose tissue, and heart, as compared with control mice (Fig. 1, C and D).
Fig. 1. Metabolic stress in Ob/Ob mice and mice on high-fat and high-fructose diet affects the DC proteome.
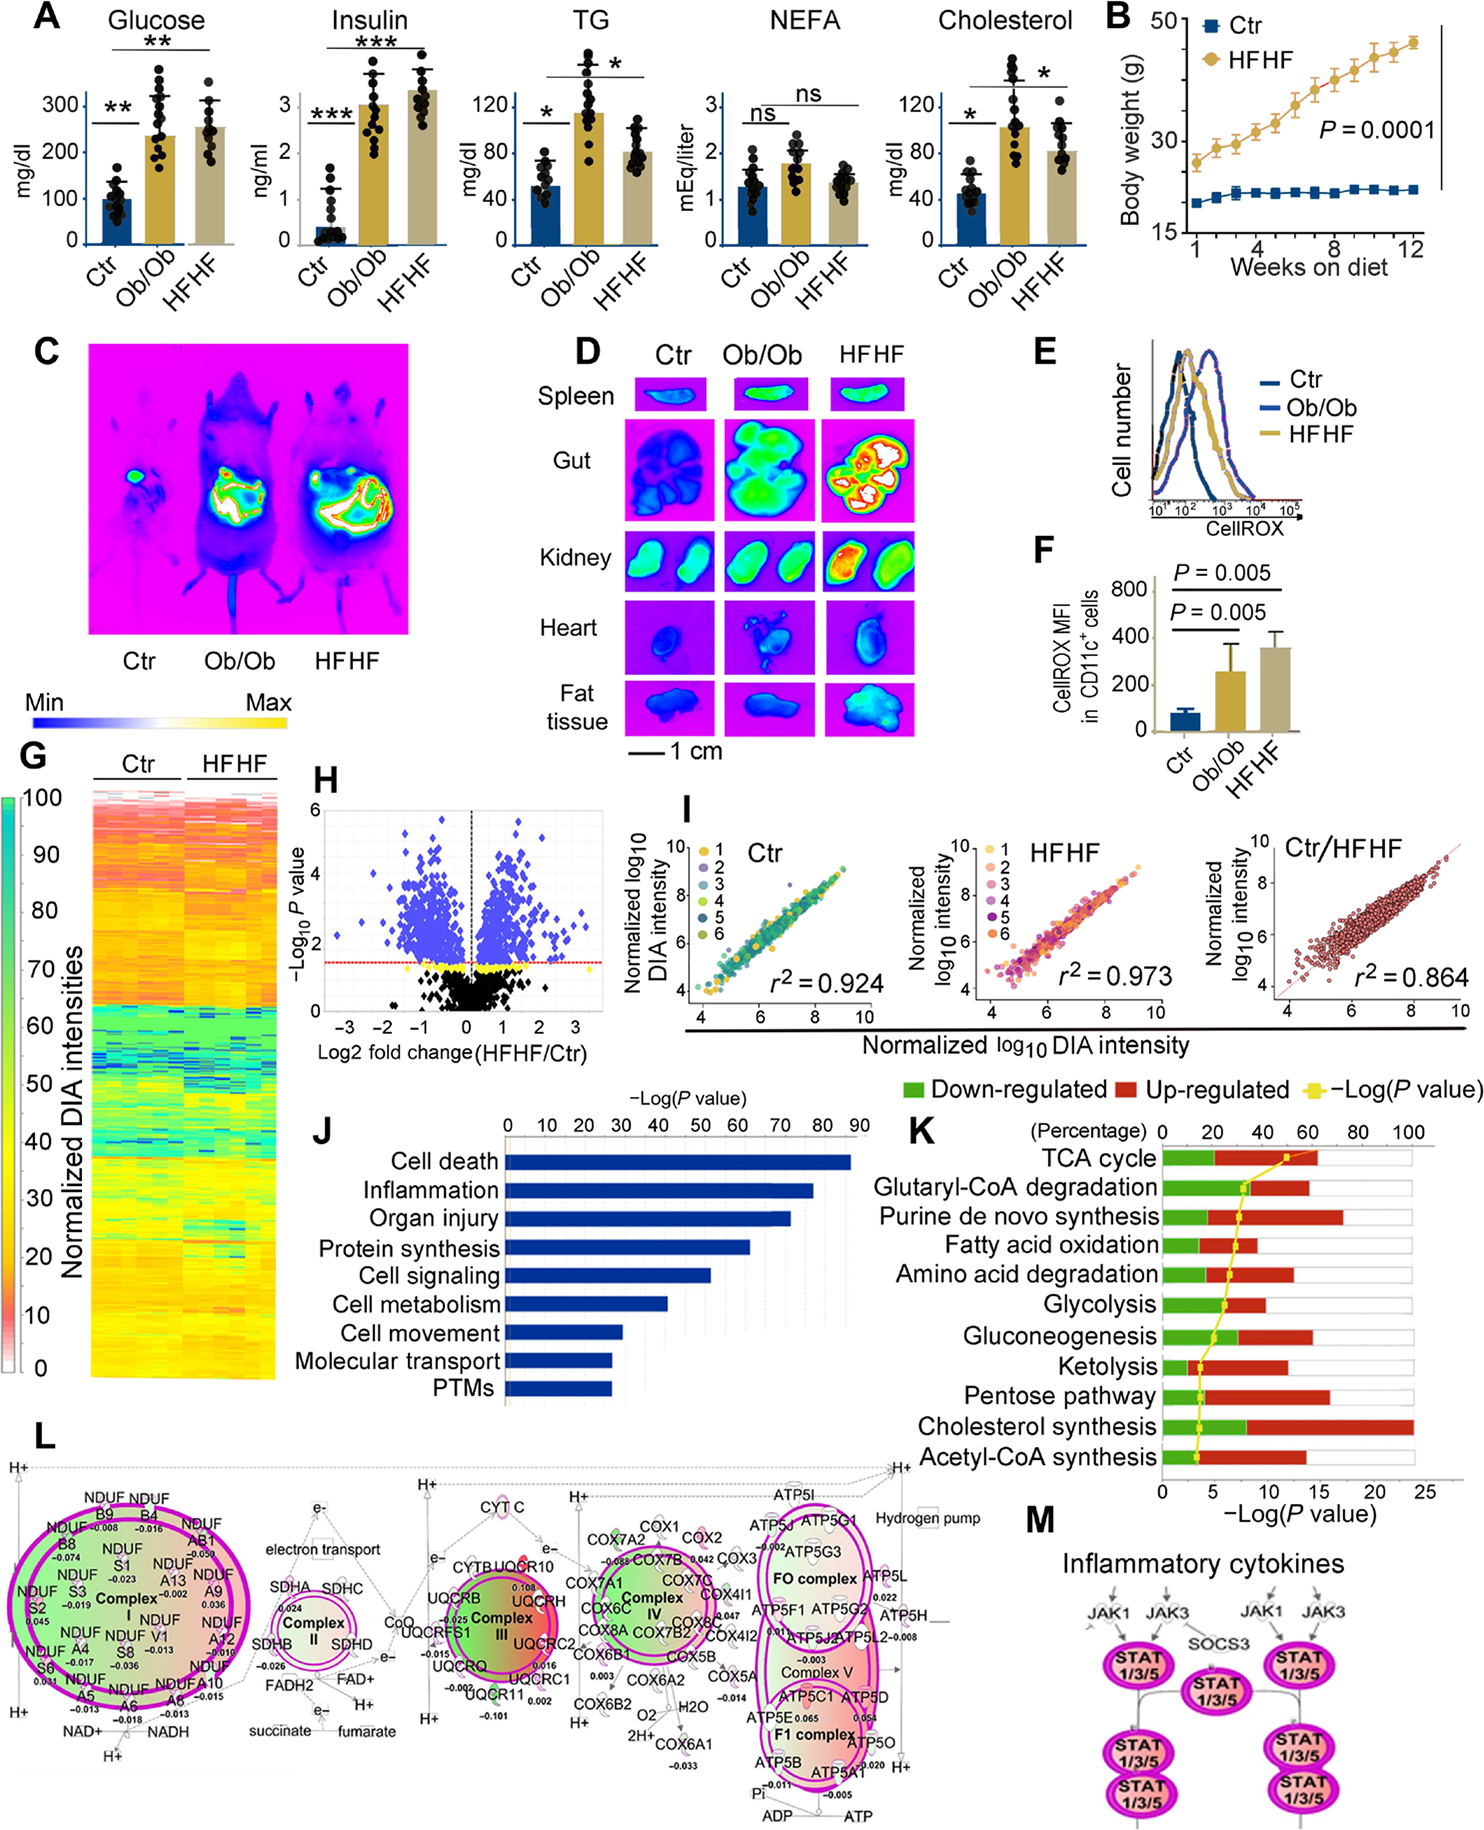
(A) Plasma concentrations of glucose, insulin, triglycerides (TG), nonesterified fatty acids (NEFA), and cholesterol in B6 (control), Ob/Ob mice, and B6 mice kept for 3 months on an HFHF diet. Each dot represents one biological sample. Values, from n = 14 biologically independent replicates, are reported as mean relative expression ± SD and were statistically analyzed using a two-tailed paired Student’s t test. Significance levels are reported as *P < 0.05, **P < 0.01 and ***P < 0.001. ns, nonsignificant. (B) Chart representing weight gain over a 3-month period in mice kept on a regular diet or HFHF diet. Values, from n = 14 biologically independent replicates, are reported as mean relative expression ± SD and were statistically analyzed using a two-tailed paired Student’s t test. (C) In vivo imaging of B6 (control), Ob/Ob, and HFHF mice using the In Vivo F PRO imaging system after intravenous injection with the oxidative stress detection reagent CellROX (excitation, 640 nm; emission, 664 nm). (D) Ex vivo imaging of spleen, gut, kidney, heart, and fat tissue samples collected from CellROX intravenously injected animals, imaged with the In Vivo F PRO imaging system. Samples were imaged for 3 min at excitation 610 nm/emission 700 nm using a built-in cooled charge-coupled device camera. Fluorescence intensity scale ranges from pink (lowest level) to red (highest level). (E) Representative fluorescence-activated cell sorting analysis of CellROX staining on CD11c+ DCs from the spleens of control, Ob/Ob, and HFHF mice, previously injected with CellROX as detailed in (C). (F) Bar graph of the MFI of CellROX as detected in CD11c+ DCs from the spleens of control, HFHF, and Ob/Ob mice; average and SD from four biological replicates (fig. S1). Values, from n = 6 biologically independent replicates, are reported as mean relative expression ± SD and were statistically analyzed using a two-tailed paired Student’s t test. (G) LFQ analysis of changes in the protein expression profiles induced by HFHF diet in primary murine DCs. The proteome was analyzed by nano-LC DIA, and the heatmap was generated in Scaffold DIA using the normalized DIA intensities. The normalized DIA intensities are summed over all identified and validated peptides from each protein group and are proportional to the relative abundance of each protein. A total of 948 target proteins were identified (0.9% FDR) across all 12 biological replicates from proteomic extracts of DCs from B6 on regular or HFHF diet, having at least three unique peptides (0.3% FDR). The complete proteomic dataset (including a total of 1487 proteins identified at a 2% FDR for proteins and 0.5% FDR for peptides) is presented in table S1. (H) Volcano plot generated using the normalized total DIA intensities from the proteomics data derived from n = 6 biological control and HFHF replicates depicts the proteins that are up- or down-regulated in HFHF mice as compared with controls. LFQ DIA analysis identified 902 differently expressed proteins (P < 0.027 for green and 0.05 > P > 0.027 for yellow hits, respectively, by ANOVA/t tests with Benjamini-Hochberg correction). (I) Regression analysis of normalized DIA intensities for the 948 target proteins (identified with FDR < 1% and at least three unique peptides) in the murine DC proteomes from HFHF and controls. The Pearson’s correlation score (0.92 and 0.97, respectively) indicates the high reproducibility among the proteomes extracted from DCs of mice on either HFHF or normal diet. In contrast, the differential proteomic expression profiles among the replicates from HFHF and regular diet murine DCs are reflected by a lower Pearson coefficient (r2 = 0.864). (J) IPA of the top-scoring cellular and physiological pathways, derived from the proteins with differential expression profiles between control and HFHF mice. IPA identified significant cellular and molecular functions (P < 0.05 by Fisher’s exact test with Benjamini-Hochberg correction) associated with the inflammatory reaction, organ injury, and metabolic changes present in the HFHF group as compared with controls. (K) Analysis of the pathways associated with the proteins undergoing significant fold changes, based on LFQ DIA analysis presented in (H) and (I). The IPA-mediated quantitative analysis indicates for each pathway the percentage of proteins that are up-regulated (red) or down-regulated (green) in HFHF mice as compared with controls. Metabolic pathways [tricarboxylic acid (TCA), glycolysis, amino acid degradation, and fatty acid oxidation, among others] are the most affected by the HFHF diet. (L) IPA-generated analysis displaying mitochondrial oxidative phosphorylation and the associated macromolecular complexes affected by the HFHF diet. (M) IPA-generated analysis of the Janus kinase (JAK)/signal transducer and activator of transcription (STAT) pathway(s) up-regulated in the HFHF group as compared with controls. Green colors depict proteins down-regulated, whereas red colors depict proteins up-regulated in the HFHF versus control mice. The color intensity directly correlates with fold changes, expressed as log2 (HFHF/control normalized DIA ratios). The complete proteomic dataset and IPA analysis are presented in tables S1 and S4.
To evaluate the effects of such metabolic alterations on MHC-II–restricted immune responses, we purified CD11c+ DCs from the spleens of CellROX-injected mice and assayed them for oxidative stress by flow cytometry. Splenic DCs from both Ob/Ob mice and mice on an HFHF diet demonstrated increased oxidative stress relative to their control counterparts (Fig. 1, E and F) and increased surface expression of multiple activation markers, including MHC-II and costimulatory ligands CD80 and CD86 (fig. S1). We then performed a label-free analysis of biological sextuplicates of proteome extracts from DCs purified from C57BL/6 mice subjected to a control versus HFHF diet (Fig. 1, G to M). Label-free quantitative (LFQ) DIA proteomic identified 902 differentially expressed proteins, either up-regulated or down-regulated with P < 0.027 for green hits and 0.05 > P > 0.027 for yellow hits (volcano plot; Fig. 1H and table S1). Additional principal components analysis indicated a differential clustering of the proteomes from control as compared with HFHF diet category, thus acknowledging differential protein expression profiles induced by the diet regime (fig. S2). Linear regression analysis (Fig. 1I) documented a high experimental reproducibility in both the control (r2 = 0.924) and HFHF (r2 = 0.973) conditions, but subtly less so when the proteomes obtained in control versus HFHF conditions were compared (r2 = 0.864) (Fig. 1I), indicating some changes in the composition of control versus HFHF proteomes. Differentially abundant proteins (Fig. 1, J and K, and table S1) included proteins associated with lipid and carbohydrate metabolism, oxidative phosphorylation, cell death and inflammation, and related functional pathways (Fig. 1, L and M, and table S1). Together, these findings suggest that metabolic insults promote oxidative stress and induce inflammatory pathways in DCs.
An HFHF diet generates an MHC-II immunopeptidome enriched in peptides derived from metabolism and stress response proteins
To determine whether changes in the DC proteome elicited by metabolic insults would be mirrored in the immunopeptidome eluted from surface MHC-II molecules, we immunoaffinity-purified MHC-II proteins from the DCs of Ob/Ob mice and C57BL/6J mice fed control or HFHF diets followed by peptide elution. Biological triplicates of I-Ab eluates from control and Ob/Ob mice (fig. S3, A to C) from the dataset reported in (34) and biological quadruplicates of I-Ab eluates from control and HFHF diet mice were analyzed by liquid chromatography–tandem mass spectrometry (LC-MS/MS) using data-dependent (DDA) and data-independent acquisition (DIA) approaches (Fig. 2, A to G, and table S2). Biological replicates for isotype controls, used to eluate nonspecific peptides, were also included in the analysis (table S2).
Fig. 2. The MHC-II immunopeptidome mirrors the changes observed in the DC proteome.
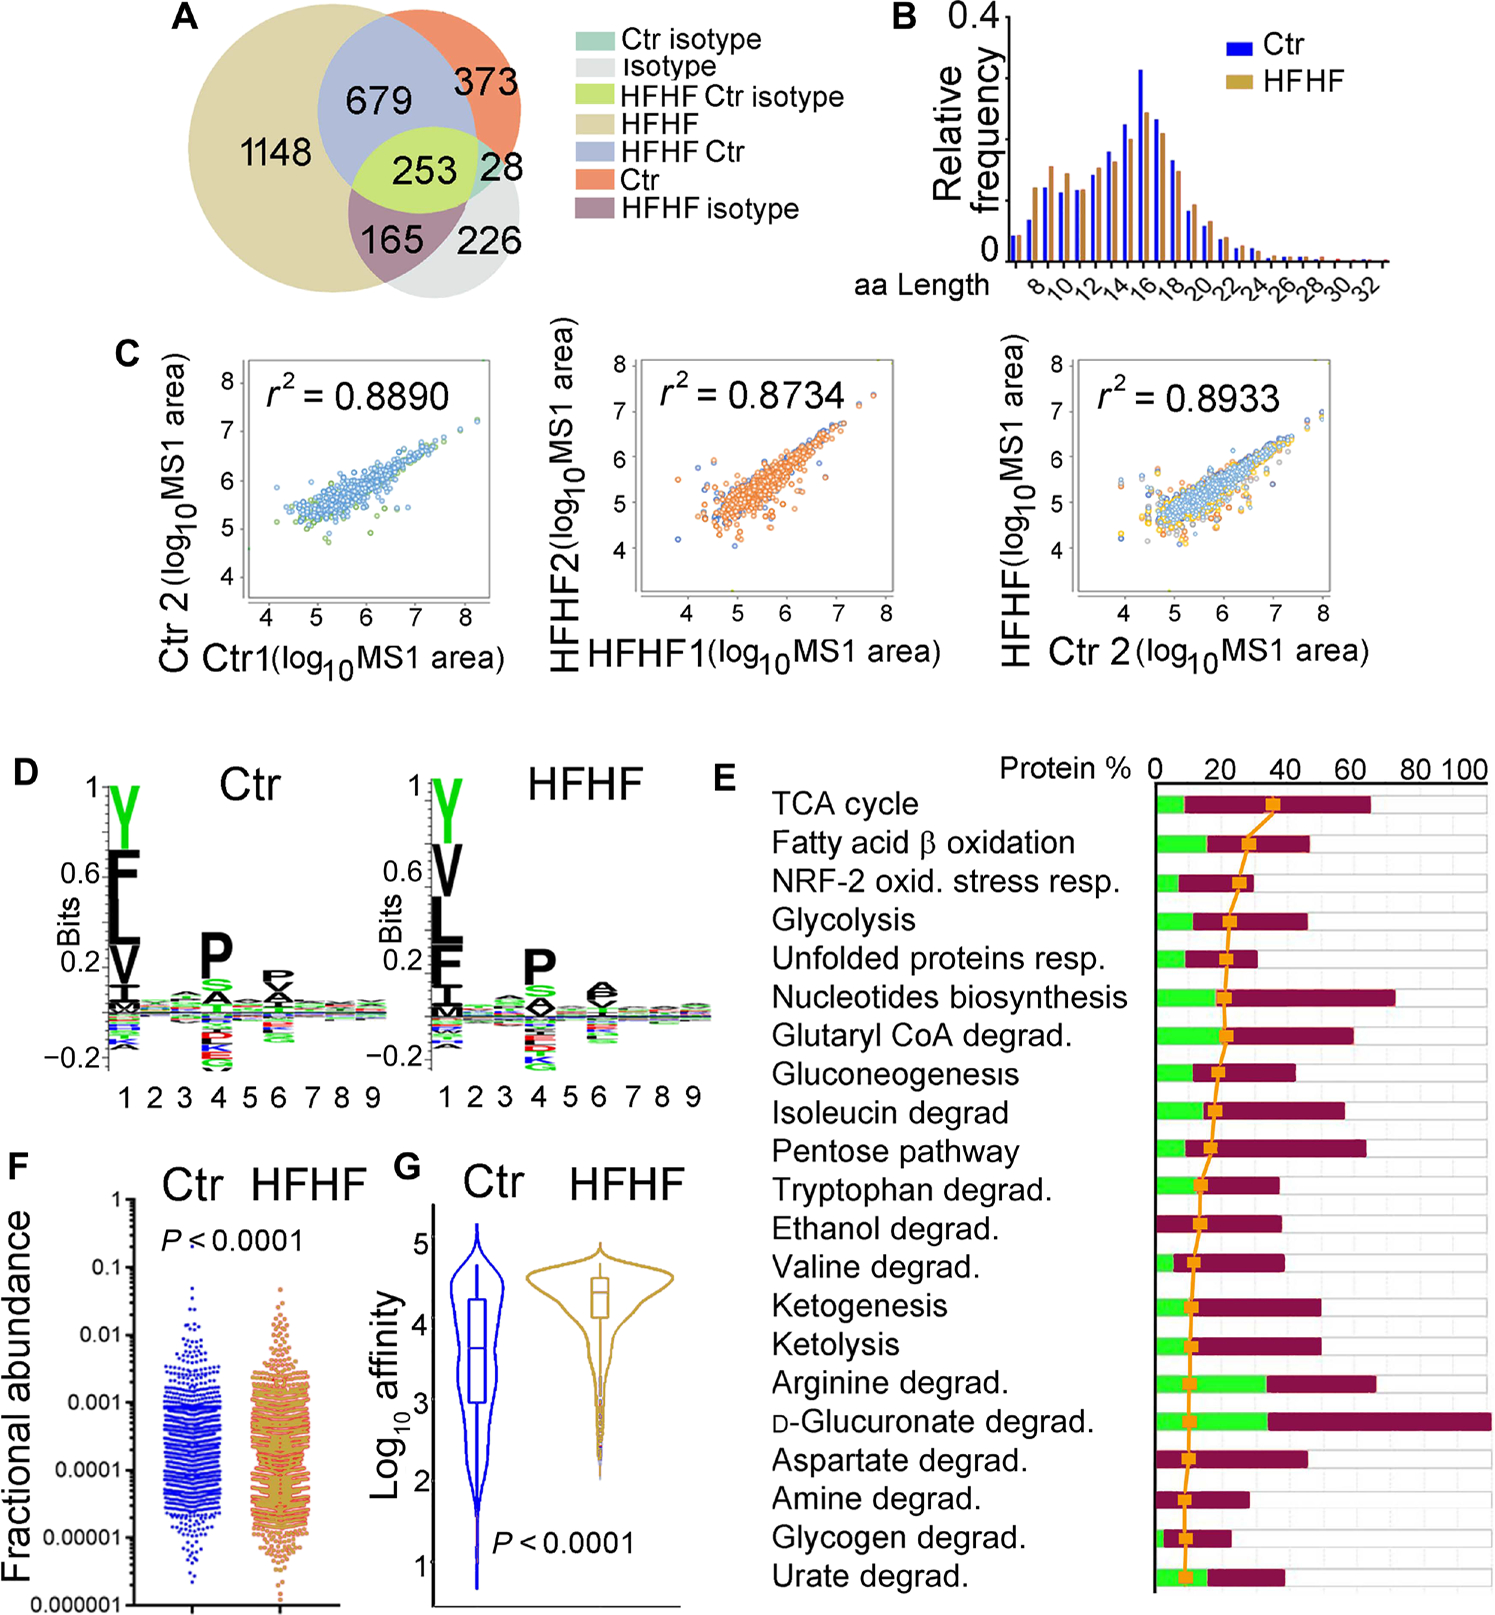
(A) Venn diagram reporting the total number of unique peptides identified by DDA nano-LC-MS/MS in the pooled of biological replicates of the I-Ab–eluted immunopeptidomes (n = 4 for HFHF diet, n = 5 for control diet, n = 2 for isotype control). The complete analysis of I-Ab immunopeptidomes is presented in table S2. (B) Length distribution of I-Ab peptides eluted from control and HFHF was similar, with a median length of ~14 amino acids (aa). (C) Correlation plots of the I-Ab peptides (MS1 area) eluted from HFHF or control mice. Left: Control biological replicates (n = 5). Middle: HFHF biological replicates (n = 4). Right: Combined HFHF versus the control biological replicates. The correlation plots together with the Pearson’s correlation scores are presented in table S2. (D) I-Ab–eluted peptides from control and HFHF DCs were analyzed using GibbsCluster 2.0 Server to identify binding motif and displayed using Seq2Logo. No differences were seen in the binding motives for control versus HFHF mice. (E) Analysis of the pathways associated with the proteins derived from the I-Ab–eluted peptides undergoing significant fold changes in HFHF versus controls. The IPA-mediated quantitative analysis indicates for each pathway the percentage of proteins that are up-regulated (red) or down-regulated (green) in Ob/Ob mice as compared with controls. The yellow symbols indicate the “ratio” corresponding to the number of proteins from the experimental dataset mapped to each pathway divided by the total number of proteins that map to the canonical pathway from the IPA knowledgebase. The ratio is transformed into the significance and scored as −log(P value) from Fisher’s exact test; the significance threshold was set to a value of 1.3 for this dataset. Metabolic and stress pathways are the most affected by the HFHF diet. (F) Fractional abundance for all the unique peptides eluted from control and HFHF mice. (G) Predicted IC50 for the I-Ab–eluted peptides from control and HFHF DCs.
MHC-II–bound peptides eluted from DCs in both control and HFHF conditions (Fig. 2, A to G) revealed the characteristics of an I-Ab ligandome, including peptide length distributions (Fig. 2B), expected anchor motifs (Fig. 2D), and fractional abundance profiles (Fig. 2F), with somewhat higher predicted binding affinity for the immunopeptidome of DCs exposed to metabolic insult (Fig. 2G). Ingenuity Pathway Analysis (IPA) revealed that the major difference between the I-Ab ligandomes eluted in control versus HFHF conditions was an enrichment in epitopes associated with metabolism and stress responses in the latter as compared with the former (Fig. 2E and tables S2 to S4). Specifically, epitopes highly represented in the I-Ab peptidome eluted from mice under an HFHF diet originated from the glycolytic enzymes aldolase, fructose-bisphosphate A (ALDOA), glyceraldehyde-3-phosphate dehydrogenase (GAPDH), pyruvate kinase (PKM), malate dehydrogenase (MDH), and lactate dehydrogenase A (LDHA); components of the mitochondrial respiratory chain such as different cytochrome C subunits; stress response proteins like BCL2-associated X protein (BAX), calreticulin (CALR) and glutathione peroxidase 1 (GPX1); and inflammatory mediators such as cytokine receptors, matrix metalloproteases, stimulator of interferon response cGAMP interactor 1 (STING1), and mitochondrial antiviral signaling protein (MAVS) (table S2).
To quantitatively confirm differential MHC-II presentation between DCs from control mice versus mice under an HFHF diet, we selected four epitopes for further analysis. By using parallel reaction monitoring (PRM) with stable isotope–labeled internal standards, we comparatively quantified the femtomoles of I-Ab–eluted peptides from ALDOA (Fig. 3A), MDHM (Fig. 3B), PKYM (Fig. 3C), and PDIA3 (Fig. 3, D to G) in the total peptidomes of control or HFHF mice (Fig. 3, A to G; fig. S4; and table S3). Elution experiments were conducted on six control and six HFHF biological replicates, and 7392 endogenous peptides were identified [false discovery rate (FDR), 1.1%] deriving from 803 protein substrates (FDR, 5%) (fig. S4 and tables S3 and S4). Skyline-extracted MS2 intensities (Fig. 3D) and y and b ions (Fig. 3F) from MS-based PRM absolute quantitation are shown for the correct identification of the endogenous PDIA3 peptide (DGEEAGAYDGPRTADG) after spiking the I-Ab immunopeptidome samples of control and HFHF eluates with 1 fmol of heavy-labeled PDIA3 DGEEAGAYDGPR[+10]TADG. For all four analyzed peptides, PRM confirmed what previously determined by label-free quantification, i.e., that all epitopes were more represented in the peptidome of DCs from mice fed an HFHF versus a control diet, when the same amount of I-Ab (20 μg) was eluted (Fig. 3, A to G; fig. S4; and table S3).
Fig. 3. Increased MHC-II presentation of peptides derived from metabolic stress–associated proteins including PDIA3.
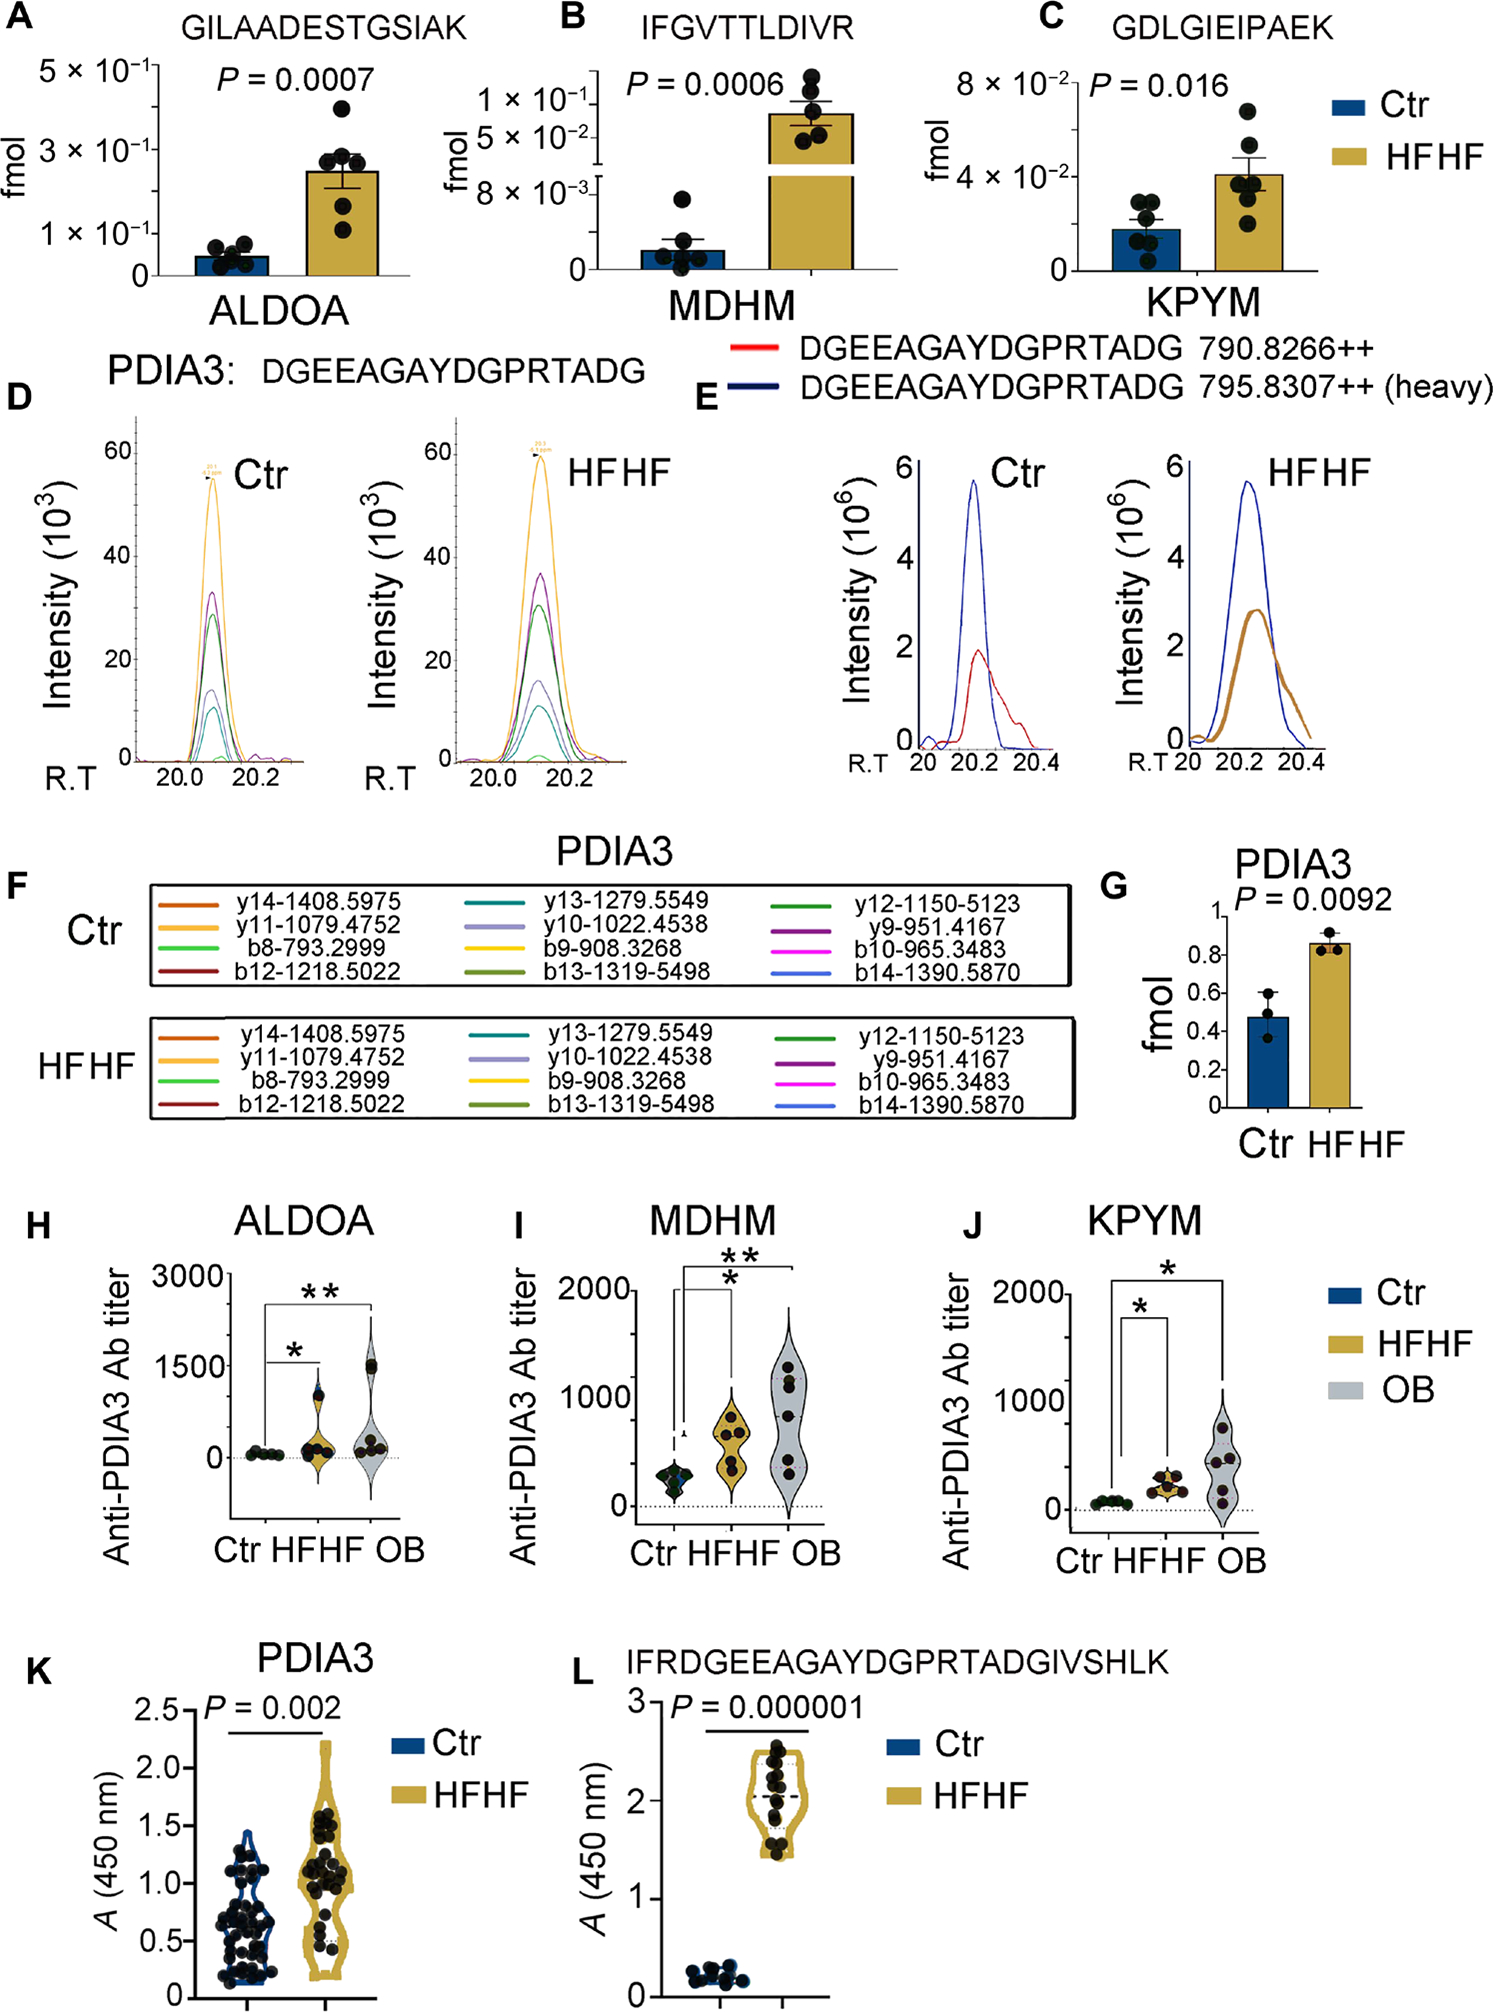
(A to C) MS-based PRM for quantitative analysis of selected endogenous peptide epitopes derived from glycolytic enzymes (ALDOA, MDHM, and KPYM) in the eluted peptidomes of liver immune infiltrates from mice on a control or HFHF diet. Values from n = 6 biologically independent replicates are reported as mean relative expression ± SD. Values were statistically analyzed using two-tailed unpaired Student’s t tests. Significance levels are reported as *P < 0.05 and **P < 0.01. The complete transition list associated with the heavy and light (endogenous) peptides is presented in table S3. (D) Skyline-extracted MS2 (y and b ions) from MS-based PRM for absolute quantitation of the endogenous PDIA3 peptide, DGEEAGAYDGPRTADG, after spiking the I-Ab immunopeptidome samples of control and HFHF eluates with 2 fmol of heavy-labeled PDIA3 DGEEAGAYDGPR[+10]TADG. (E) Representative ion-extracted chromatogram of the MS1 precursors corresponding to the identified MS2 ions shown in the left panel: The spiked heavy peptide PDIA3 DGEEAGAYDGPR[+10]TADG is shown in blue, and the corresponding endogenous light peptide is shown either in red (control diet) or in blue (HFHF diet), coeluting in both cases with the heavy standard. (F) MS2-extracted monoisotopic peaks corresponding to the b and y fragment ions resulted from the fragmentation of the PDIA3 peptide DGEEAGAYDGPRTADG and analyzed by the PRM method. (G) PRM-derived quantitative analysis of endogenous DGEEAGAYDGPRTADG in the I-Ab immunopeptidome eluate samples from control and HFHF mice. Values, from n = 6 biologically independent replicates, are reported as mean relative expression ± SD. Values were statistically analyzed using a two-tailed unpaired Student’s t test. Significance levels are reported as *P < 0.05. The complete transition list associated with the heavy and light (endogenous) peptides is presented in table S3. (H to J) Violin plots depicting antibody (Ab) titers against MDHM, ALDOA, and PYKM using mouse recombinant proteins and ELISA assays performed on serially diluted sera collected from control and HFHF or OB (Ob/Ob) mice. Values, from n = 5 biologically independent replicates, are reported as mean relative abundance ± SD. Values were statistically analyzed using one-way analysis of variance (ANOVA) Kruskal-Wallis test for multiple comparison followed by uncorrected Dunn’s test. Significance levels are reported as *P < 0.05 and **P < 0.01. (K) Violin plot depicting the amount of autoantibodies against full-length PDIA3 protein using mouse recombinant protein and ELISA assays performed on 1:500 diluted sera collected from control and HFHF mice. Values, from n = 41 (control) and 36 (HFHF) biologically independent replicates, are reported as mean relative abundance. Each dot symbol is an average of technical quadruplicates. Values were statistically analyzed using a two-tailed unpaired Student’s t test. Significance levels are reported as **P < 0.01. (L) Violin plot depicting amounts of autoantibodies against a linear B cell PDIA3 epitope (IFRDGEEAGAYDGPRTADGIVSHLK). ELISA assays were performed on 1:100 diluted sera collected from control and HFHF mice. Values, from n = 10 (control) and 14 (HFHF) biologically independent replicates, are reported as mean relative abundance. Each dot symbol is an average of technical quadruplicates. Values were statistically analyzed using a two-tailed unpaired Student’s t test. Significance levels are reported as P < 0.0001.
Increased MHC-II–restricted presentation of MDH, ALDOA, PKM, and PDIA3 peptides is associated with elevations in circulating autoantibodies against the same proteins
To determine whether increased MHC-II presentation of MDHM, ALDOA, KPYM, and PDIA3 peptides would be associated with increased antibody production, we performed an enzyme-linked immunosorbent assay (ELISA) on sera collected from mice fed an HFHF versus a control diet (Fig. 3, H to J). In all cases, an increased presence of autoantibodies toward MDHM, ALDOA, KPYM, and PDIA3 proteins was observed in the former over the latter experimental conditions (Fig. 3, H to J). In the case of PDIA3, increased autoantibody levels could be detected for both the full-length protein (Fig. 3K) and a linear B cell epitope that has previously been suggested to participate in autoimmune hepatitis (AIH) (Fig. 3L) (35). The increase in the epitope-specific antibody was exquisitely HFHF diet related because mice on a regular diet for 3 months exhibited the same levels as those at baseline.
To dissect whether an increased MHC-II peptide presentation and consequent increased antibody production may have a pathogenic role in this context, we focused on PDIA3-directed immune responses because (i) this protein has previously been associated with immunogenic cell death (36, 37); (ii) during cellular stress, PDIA3 is translocated at the cell surface and hence becomes available for antibody binding (38); and (iii) we identified a linear peptide of the PDIA3 protein [IFRDGEEAGAYDGPRTADGIVSHLK], which is uniquely recognized by the anti-PDIA3 antibody from mice on an HFHF diet (Fig. 3L). The identification of the PDIA3 peptide presented by I-Ab [DGEEAGAYDGPRTADG] and the PDIA3 peptide recognized by circulating antibodies enabled us to monitor both arms of the adaptive immune response in mice subjected to an HFHF diet.
PDIA3-specific antibodies contribute to hepatotoxicity
To evaluate a possible pathogenic role for PDIA3-targeting immune responses elicited by metabolic insults, we focused on the liver. In line with previous findings, the lipotoxicity and glucotoxicity associated with an HFHF diet generated nonalcoholic steatohepatitis (NASH) (Fig. 4). In addition, as previously reported (38), the immunogenic demise of metabolically stressed hepatocytes was associated with increased PDIA3 levels at the cell surface (Fig. 4, A to C) (36, 37). After performing surface PDIA3 staining on primary cells from different organs known to be a target of HFHF-mediated lipotoxicity and glucotoxicity, we determined that the highest PDIA3 levels were seen on the HFHF hepatocytes (Fig. 4, A to C).
Fig. 4. High-fat and high-fructose diet induces liver inflammatory response.
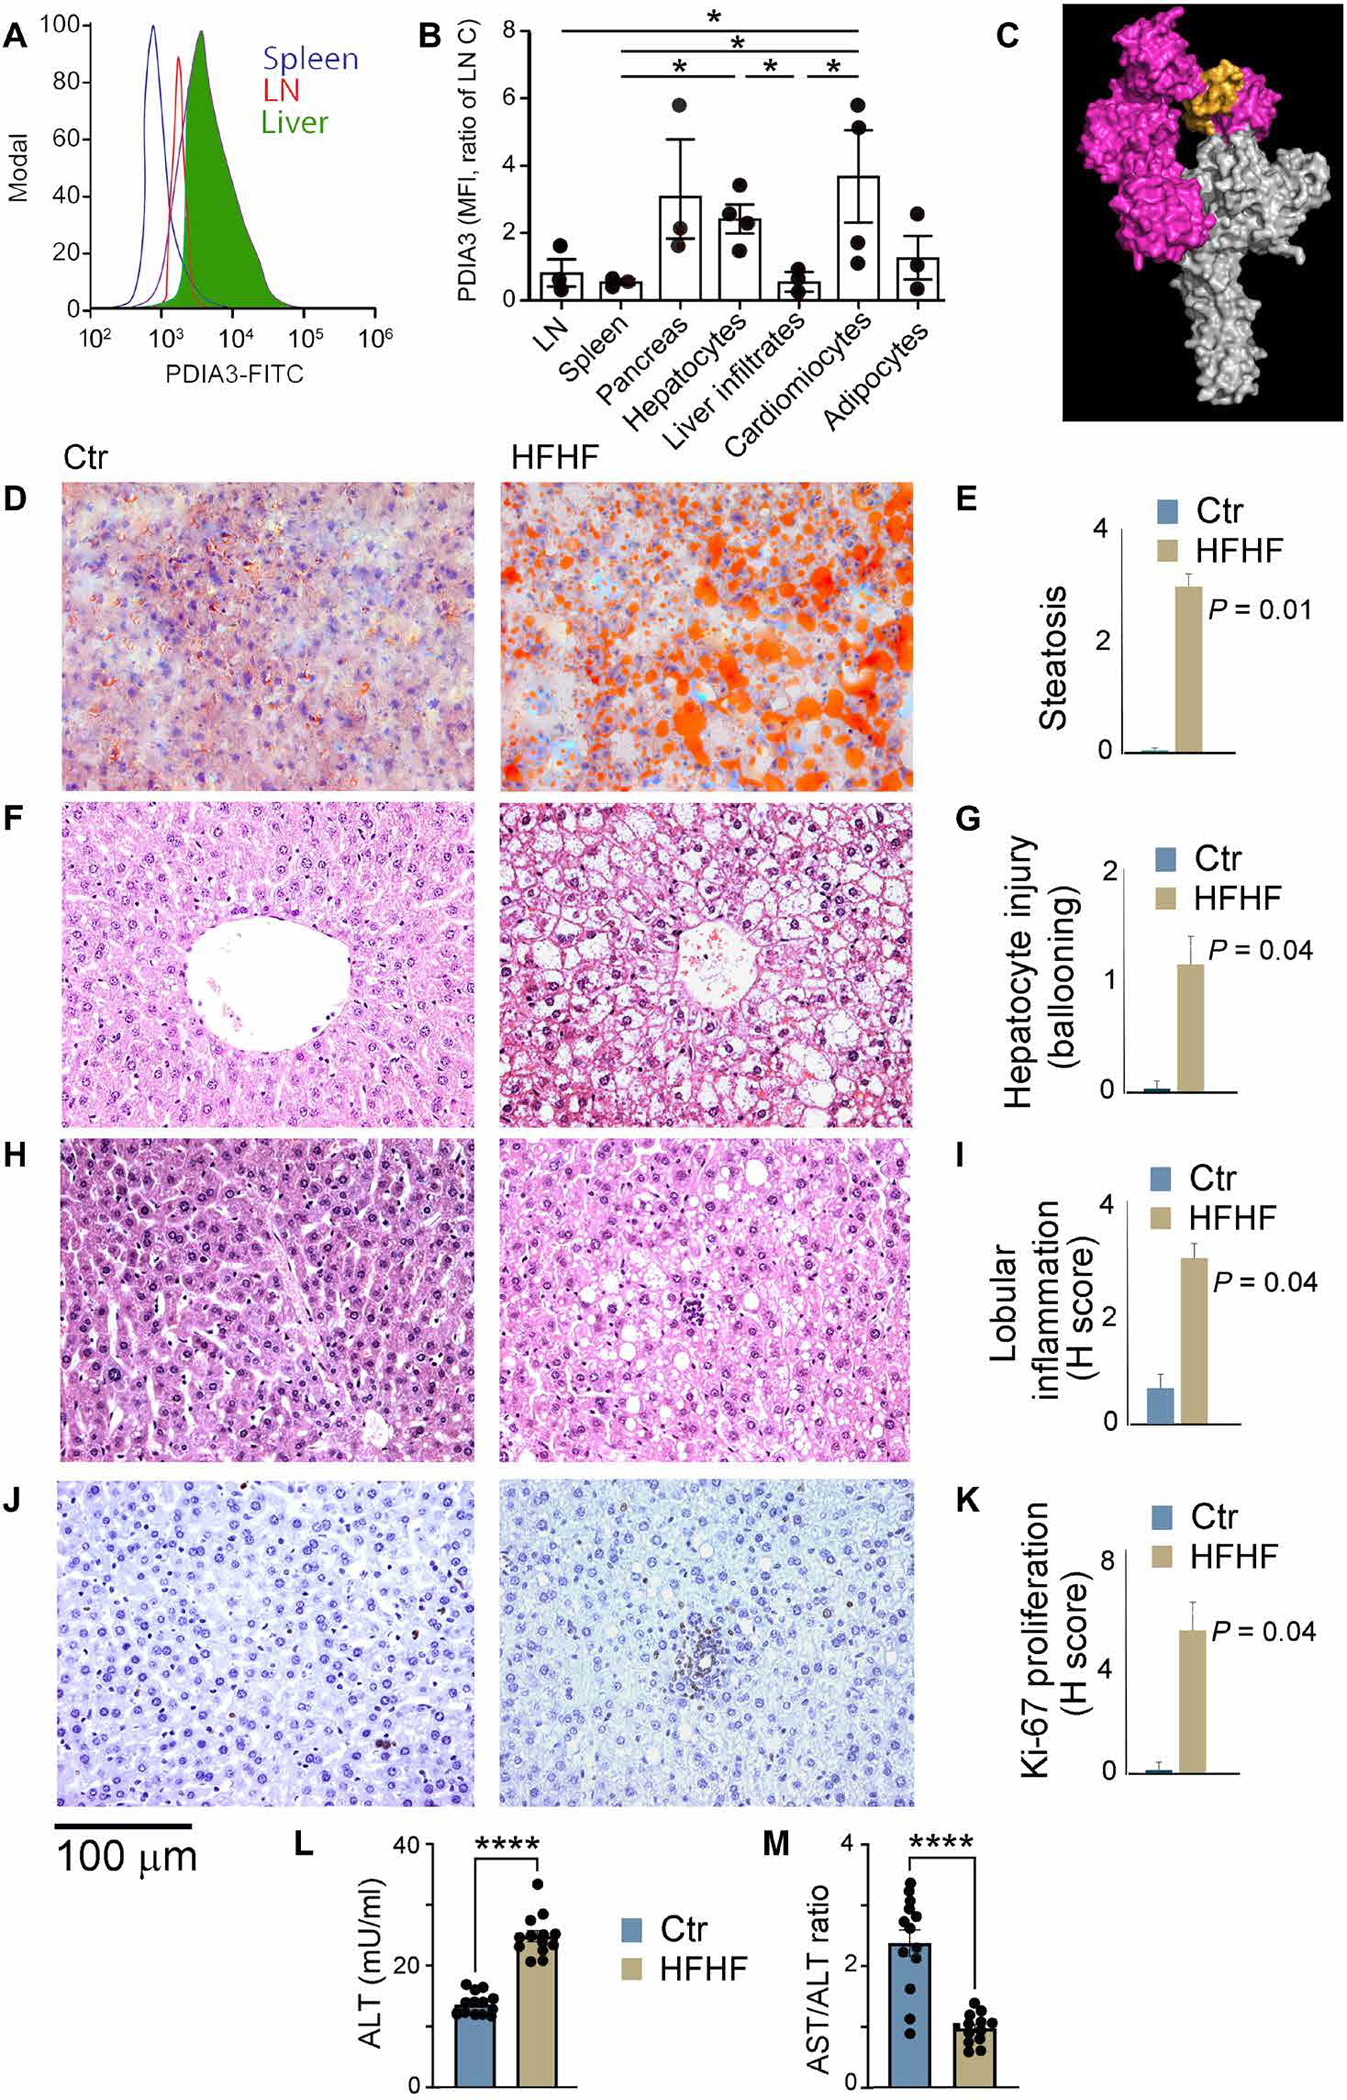
(A) Surface staining of splenocytes, nodal immune cells, and hepatocytes for PDIA3 protein. (B) Normalized MFI of surface PDIA3 expressed on nodal immune cells, splenocytes, pancreatic cells, hepatocytes, liver immune infiltrates, cardiomyocytes, and adipocytes harvested from control and HFHF mice. A statistically significant difference in the PDIA3 HFHF/control ratio was observed. Values, from n = 4 biologically independent replicates, are reported as mean relative expression ± SD. Data were statistically analyzed using a two-tailed paired Student’s t test. Significance levels are reported as *P < 0.05. (C) Sequence of the linear autoantibody epitope (PDIA3 residues 104 to 128) shown in yellow mapped onto a surface representation of the PDIA3-tapasin complex crystal structure PDB.3F8U, with PDIA3 shown in magenta and tapasin shown in gray. (D to K) Livers were harvested from C57BL/6 mice on a regular diet or an HFHF diet for 3 months. Livers were fixed in formalin and stained to detect (D and E) steatosis (oil red staining), (F to I) hepatocyte injury and immune cell infiltration, and (J and K) proliferation. Steatosis, cellular infiltration and proliferation, lobular inflammation, and hepatocyte injury (ballooning) were all significantly up-regulated in HFHF mice as compared with controls. Values, from n = 6 biologically independent replicates, are reported as mean relative expression ± SD and were statistically analyzed using a two-tailed unpaired Student’s t test. (L and M) Increased ALT levels were seen in mice on a 3-month HFHF diet concomitantly with a decreased AST/ALT ratio (<1), which is indicative of NASH. Values from n = 13 biologically independent replicates are shown here, and data were statistically analyzed using a two-tailed unpaired Student’s t test.
Histologically, we observed steatosis in hematoxylin and eosin–stained liver sections, confirmed by oil red staining of frozen liver sections from WT mice fed an HFHF (but not control) diet (Fig. 4, D and E), as well as foci of intralobular inflammatory cell inflammation (Fig. 4, F to I) positive for Ki-67 staining (Fig. 4, J and K). Last, an increase in circulating levels of alanine aminotransferase (ALT), an indicator of hepatocytes damage (Fig. 4L), and a decrease in the ratio between ALT and aspartate transaminase (AST), which is considered an indicator of NASH, were observed (Fig. 4M) (39).
To determine the pathogenic potential of anti-PDIA3 T and B cells, we first quantified PDIA3-specific antibodies from the sera of mice subjected to an HFHF versus control diet and baseline controls (Fig. 5A and table S5). A statistically significant increase in anti-PDIA3 antibodies was elicited by the HFHF diet (Fig. 5A), a result that was confirmed by antibody titration (Fig. 5, B and C). Next, anti-PDIA3 antibodies were purified from the sera of mice on an HFHF versus control diet using a peptide affinity column (Fig. 5D), and their specificity was confirmed by immunoblotting on recombinant His-tagged PDIA3 (Fig. 5E), as well as ELISA based on recombinant PDIA3 (Fig. 5F). In all specificity testing, commercially available polyclonal anti-PDIA3 antibodies were used as positive control (Fig. 5F).
Fig. 5. High-fat and high-fructose diet induces PDIA3 antibody–mediated liver damage.
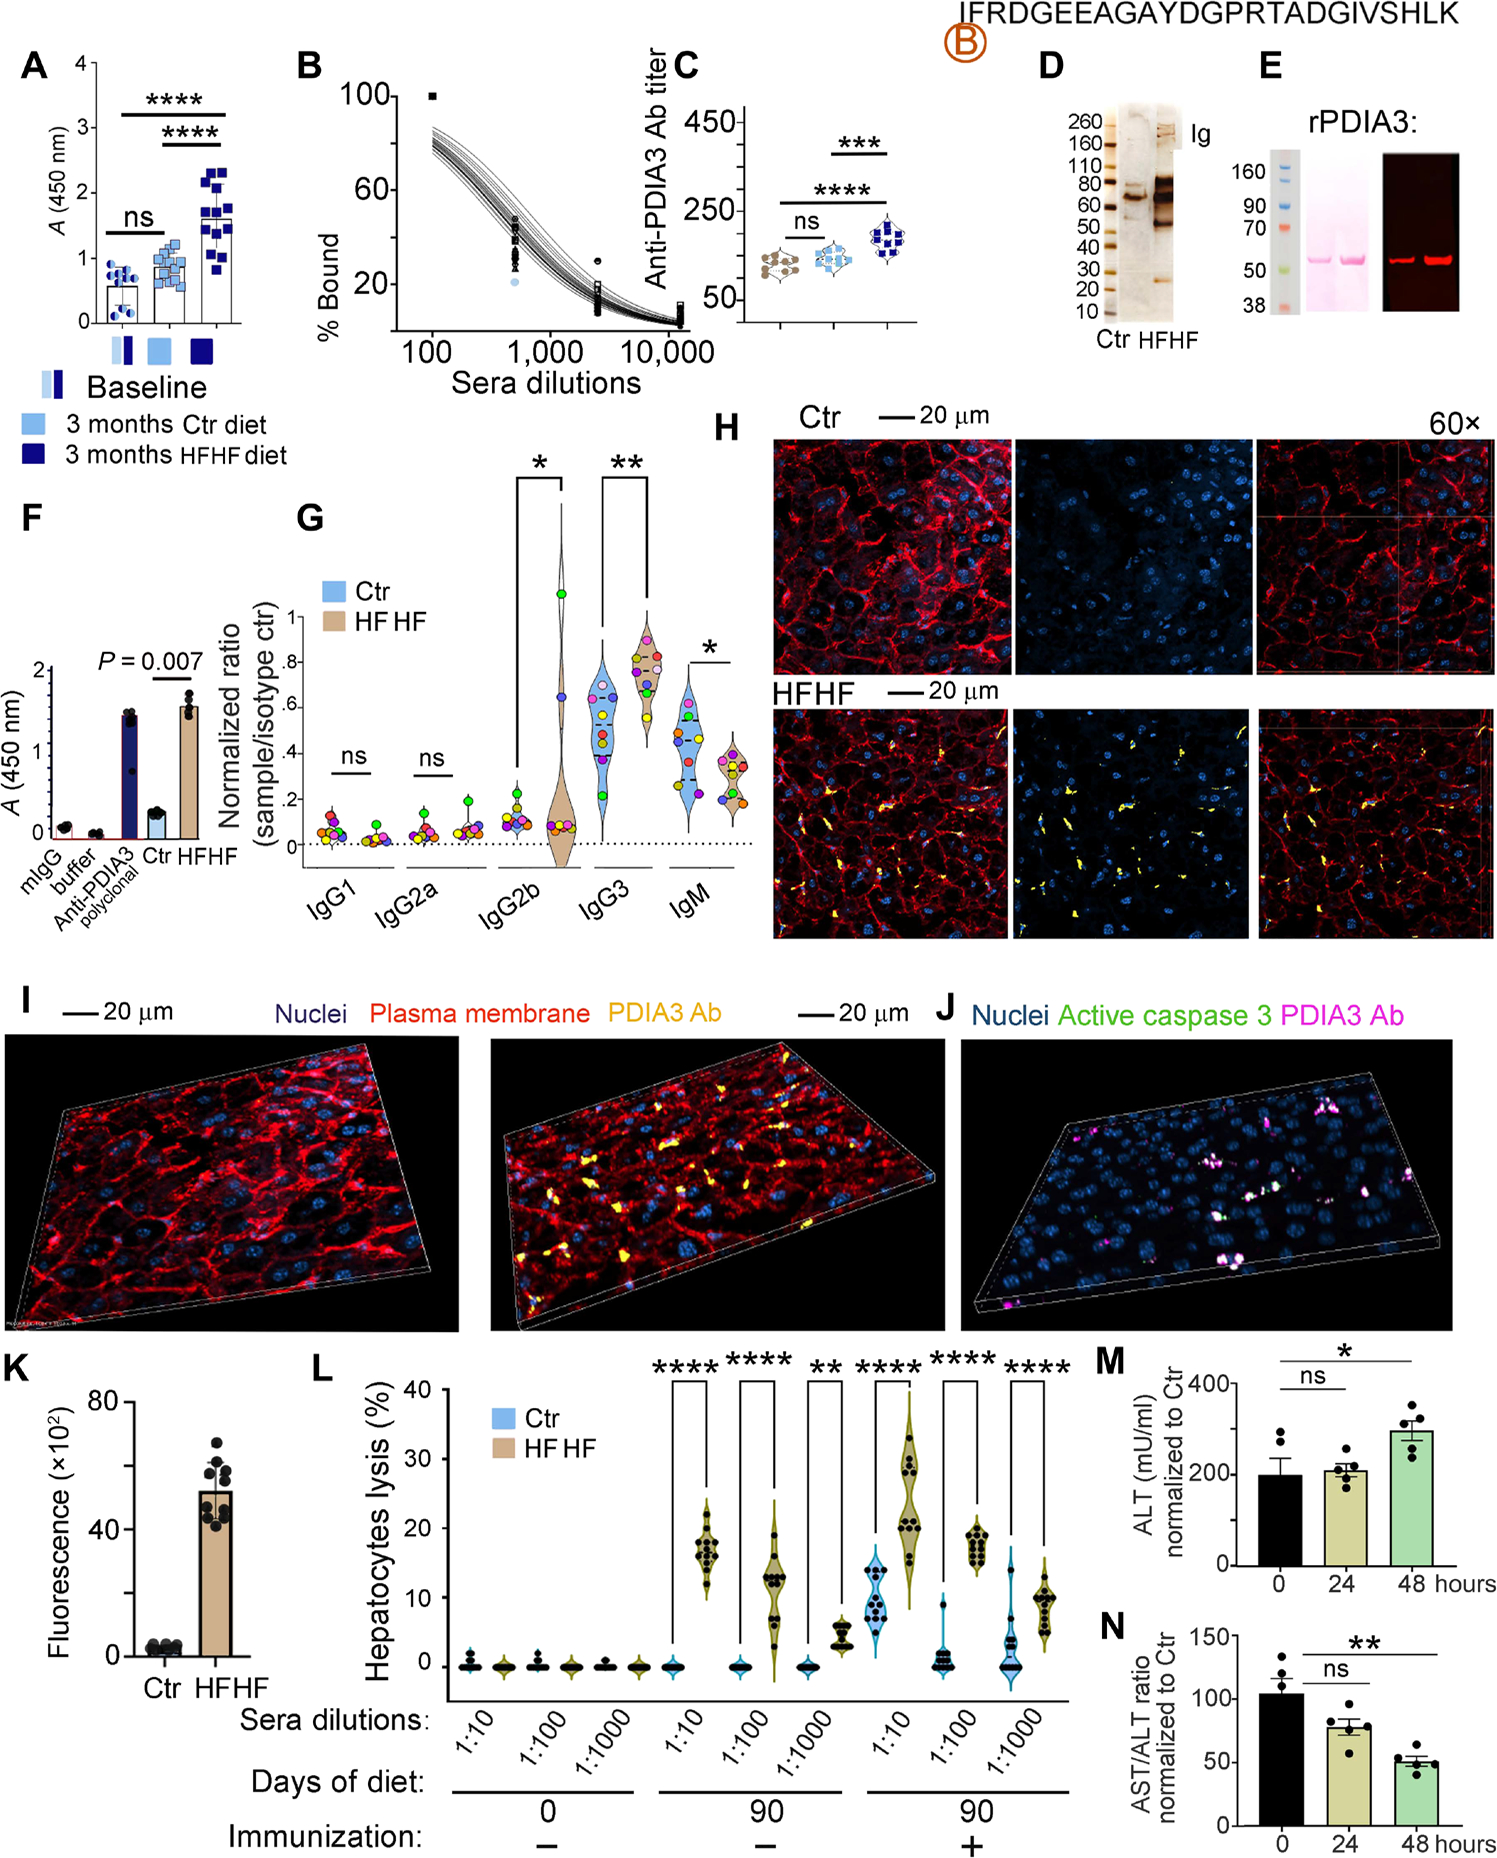
(A) ELISA quantification of antibody response to the PDIA3 peptide in mice at baseline or after 3 months following control or HFHF diet. Values, from n = 10 to n = 13 biologically independent replicates, are reported as mean relative expression ± SD and were statistically analyzed using a one-way ANOVA (α = 0.05) followed by Tukey’s multiple comparison test. Significance levels are reported as ****P < 0.0001. (B) Example of sera titration from one of the samples in (A), diluted 100-, 1000-, and 10,000-fold. (C) PDIA3 titer is reported for n = 9 biologically independent replicates. Data are reported as mean relative expression ± SD and were statistically analyzed using one-way ANOVA (α = 0.05) followed by Tukey’s multiple comparison test. Significance levels are reported as ****P < 0.0001 and ***P < 0.001. Significance levels are reported as **P < 0.01 and ***P < 0.001. (D) Sera from control and HFHF mice were purified on biotin-labeled PDIA3 peptide affinity columns, and the eluate was run on SDS-PAGE gel followed by silver staining. (E) Eluted antibodies were validated by immunoblotting using human recombinant His-tag PDIA3; representative immunoblotting (right) probed with HFHF-eluted antibodies shows the expected 58.5 to 60.0 kDa corresponding to the His-tag PDIA3 loaded at 2 and 5 μg, respectively, on an SDS-PAGE gel; left, Ponceau S staining after transfer. (F) Eluted antibodies were also validated by ELISA against the full-length PDIA3 protein. Values, from n = 4 biologically independent replicates, are reported as mean relative expression ± SD and were statistically analyzed using one-way ANOVA (α = 0.05) followed by Tukey’s multiple comparison test. Significance levels are reported as ****P < 0.0001 for the antibodies purified from sera of control and HFHF mice. (G) Isotype testing was performed on the PDIA3-purified antibody from sera of mice at baseline and after HFHF diet. Data are reported as normalization to the A450 nm reading for each specific isotype control. Mice are color-coded to visualize isotype amount in each mouse. Each dot represents the average of technical quadruplicates, and data are reported for n = 8 biological replicates with significance levels *P < 0.05 and **P < 0.01 (two-way ANOVA and multiple comparisons using Fisher’s LSD test). Applying the unpaired t test retrieved significant difference between the relative abundance of IgM fraction in the sera from control versus HFHF mice (P < 0.05). (H) Representative confocal images of infiltrating PDIA3-specific antibody (Cy5-tagged; yellow) in the liver of control and HFHF mice. Plasma membrane is stained with wheat germ agglutinin–Alexa Fluor 594 (red) and nuclei with DAPI (blue). Confocal images were collected in Z-stack of 5-mm thickness. (I) Representative three-dimensional (3D) view of confocal images of control and HFHF mouse liver collected as in (H). (J) Representative 3D confocal images of infiltrating PDIA3-specific antibody (Cy5-tagged; magenta) in the liver of control and HFHF mice binding to hepatocytes positive for active caspase 3 (green). Confocal images were collected in Z-stack of 5-mm thickness. (K) Fluorescence quantification for the PDIA3-specific antibody (Cy5-tagged; magenta) in the liver of control and HFHF mice after intravenous injection 24 hours before (n = 10 biological replicates). (L) Twenty thousand calcein-labeled liver cells (prepared from control or HFHF mice) were incubated with titrated amounts of the PDIA3 peptide–purified antibodies [as prepared in (C)] and incubated with 1 × 10⁵ nodal cells, also harvested from control and HFHF mice. After 6 hours, cultured cells were washed to eliminate dead cells and the remaining calcein-labeled cells were quantified by fluorescence (490-nm excitation and 520-nm emission filters). Data are reported as percentage of lysed cells. SDS-lysed cells were used as positive control (100% lysis), and untreated cells were used as negative control (no lysis). Values, from n = 10 to n = 14 biologically independent replicates, are reported as mean relative expression ± SD and were statistically analyzed using a two-tailed paired Student’s t test. Each dot symbol is an average of technical quadruplicates, and the data were statistically analyzed using one-way ANOVA and Tukey’s multiple comparisons test. Significance levels are reported as **P < 0.01 and ****P < 0.0001. (M) ALT quantification in control and HFHF sera before and after 24 and 48 hours from the injection of control and HFHF antibody (100 μg per mouse). Data are reported as mean concentration ± SD (normalized to control diet) and were statistically analyzed using a one-way ANOVA test followed by Dunnett’s multiple comparison test. Significance levels are reported as *P < 0.05. (N) Ratio between AST/ALT quantified in control and HFHF sera before and after 24 and 48 hours from the injection of control and HFHF purified antibody (100 μg per mouse). Data are reported as a ratio between the two enzymes, and values were normalized to control diet. Values of n = 5 biologically independent replicate is reported. Significance levels are reported as *P < 0.05.
Isotype analysis of anti-PDIA3 antibodies purified from the sera of mice on an HFHF diet identified an isotype switch after 3 months of HFHF diet initiation (Fig. 5G). This manifested with a statistically significant decrease in the amount of IgM coupled to a statistically significant increase in IgG3 for most of the mice, with one mouse having similar IgG2b and IgG3 levels and another having higher IgG2b after 3 months on an HFHF diet (Fig. 5G), together indicating that PDIA3-specific antibodies underwent a class switch toward higher PDIA3 affinity in the setting of an HFHF diet (Fig. 5G).
To determine the pathogenicity of antibodies targeting PDIA3 on the hepatocyte surface (Fig. 4, A to C), we labeled anti-PDIA3 purified from the sera of mice fed an HFHF versus control diet with Cy5 and injected them into mice on a control or HFHF diet (Fig. 5, H and I). A positive antibody staining on the hepatocyte surface could only be observed in HFHF mice as compared with controls (Fig. 5, H, I, and K). In addition, the staining was also associated with cleaved caspase 3–positive cells, further confirming the role of anti-PDIA3 immune responses in immunogenic cell death (Fig. 5J and fig. S5).
To further determine the cytotoxic potential of purified PDIA3-targeting antibodies, we performed a hepatocyte cytotoxicity assay by incubating lymph nodal cells and calcein-loaded hepatocytes (harvested from mice fed an HFHF versus control diet) plus titrated amounts of sera from control versus HFHF conditions (Fig. 5L). Although no lysis occurred upon incubation with control sera, 10 to 12% hepatocytes were killed when exposed to nodal cells and PDIA3-targeting antibodies from HFHF conditions (Fig. 5L). Lysis increased up to 20 to 25% upon mouse immunization with recombinant PDIA3 (Fig. 5L). Last, injection of anti-PDIA3 antibodies purified from the sera of mice fed an HFHF diet caused a statistically significant increase in ALT (Fig. 5M) coupled with a statistically significant decrease in the AST/ALT ratio (Fig. 5N) when injected in mice on an HFHF (but not control) diet. The combined data indicated that PDIA3-specific antibodies, emerging as a consequence of metabolic insults coupled to chronic inflammation, actively contributed to liver damage.
PDIA3-specific T cells infiltrate the liver parenchyma and contribute to liver damage in the presence of metabolic insults
To determine the role of anti-PDIA3 T cell in hepatotoxicity associated with T2D, we processed perfused livers from C57BL/6J mice subjected to an HFHF versus control diet to isolate immune infiltrates (Fig. 6). As a first step, we quantified the amount of PDIA3 peptides presented by the immune infiltrates by performing acid elution followed by PRM using stable isotope–labeled internal standards (Fig. 6, A to C; fig. S6; and table S6). At odds with peripheral DCs, which presented 0.4 and 0.8 fmol of PDIA3 peptides in control and HFHF conditions, respectively, liver-infiltrating cells presented 10 and 400 fmol of PDIA3 peptides in control versus HFHF mice, respectively. These data indicated a 20-fold increase in the MHC-II presentation of the PDIA3 peptide in the livers of mice fed HFHF versus control diet, as compared with a twofold increase in the periphery. Next, liver infiltrates were tested for reactivity against the PDIA3 peptide in the absence of prior immunization. Although negligible PDIA3-driven proliferation was observed in hepatic infiltrates from mice on a control diet, a statistically significant increase in 5-bromo-2′-deoxyuridine (BrdU) incorporation could be documented upon stimulating hepatic infiltrates from mice on an HFHF diet with the PDIA3 peptide (Fig. 6C). These results demonstrated that PDIA3-specific T cells infiltrated the liver in HFHF conditions. Last, liver-infiltrating anti-PDIA3 T cells were sorted on the basis of PDIA3-driven CD4+ T cell proliferation, as monitored by carboxyfluorescein diacetate succinimidyl ester (CFSE) labeling (Fig. 6, D and E), and ELISA was used to monitor cytokine secretion upon antigenic challenge. As compared with mice fed a control diet, PDIA3-reactive cells from mice fed an HFHF diet secreted increased amounts of GZMB and multiple inflammatory cytokines including IL-17, IL-23, TNF, and IFN-γ (Fig. 6, F and G). Together, these data indicate that PDIA3-specific T cells are present in the livers of mice subjected to an HFHF diet; proliferate in response to their cognate PDIA3 peptide, even in the absence of immunization, are polarized toward a functional TH1 and TH17 profile; and release pro-inflammatory cytokines and cytotoxic molecules.
Fig. 6. High-fat and high-fructose diet induces T cell–mediated liver damage.
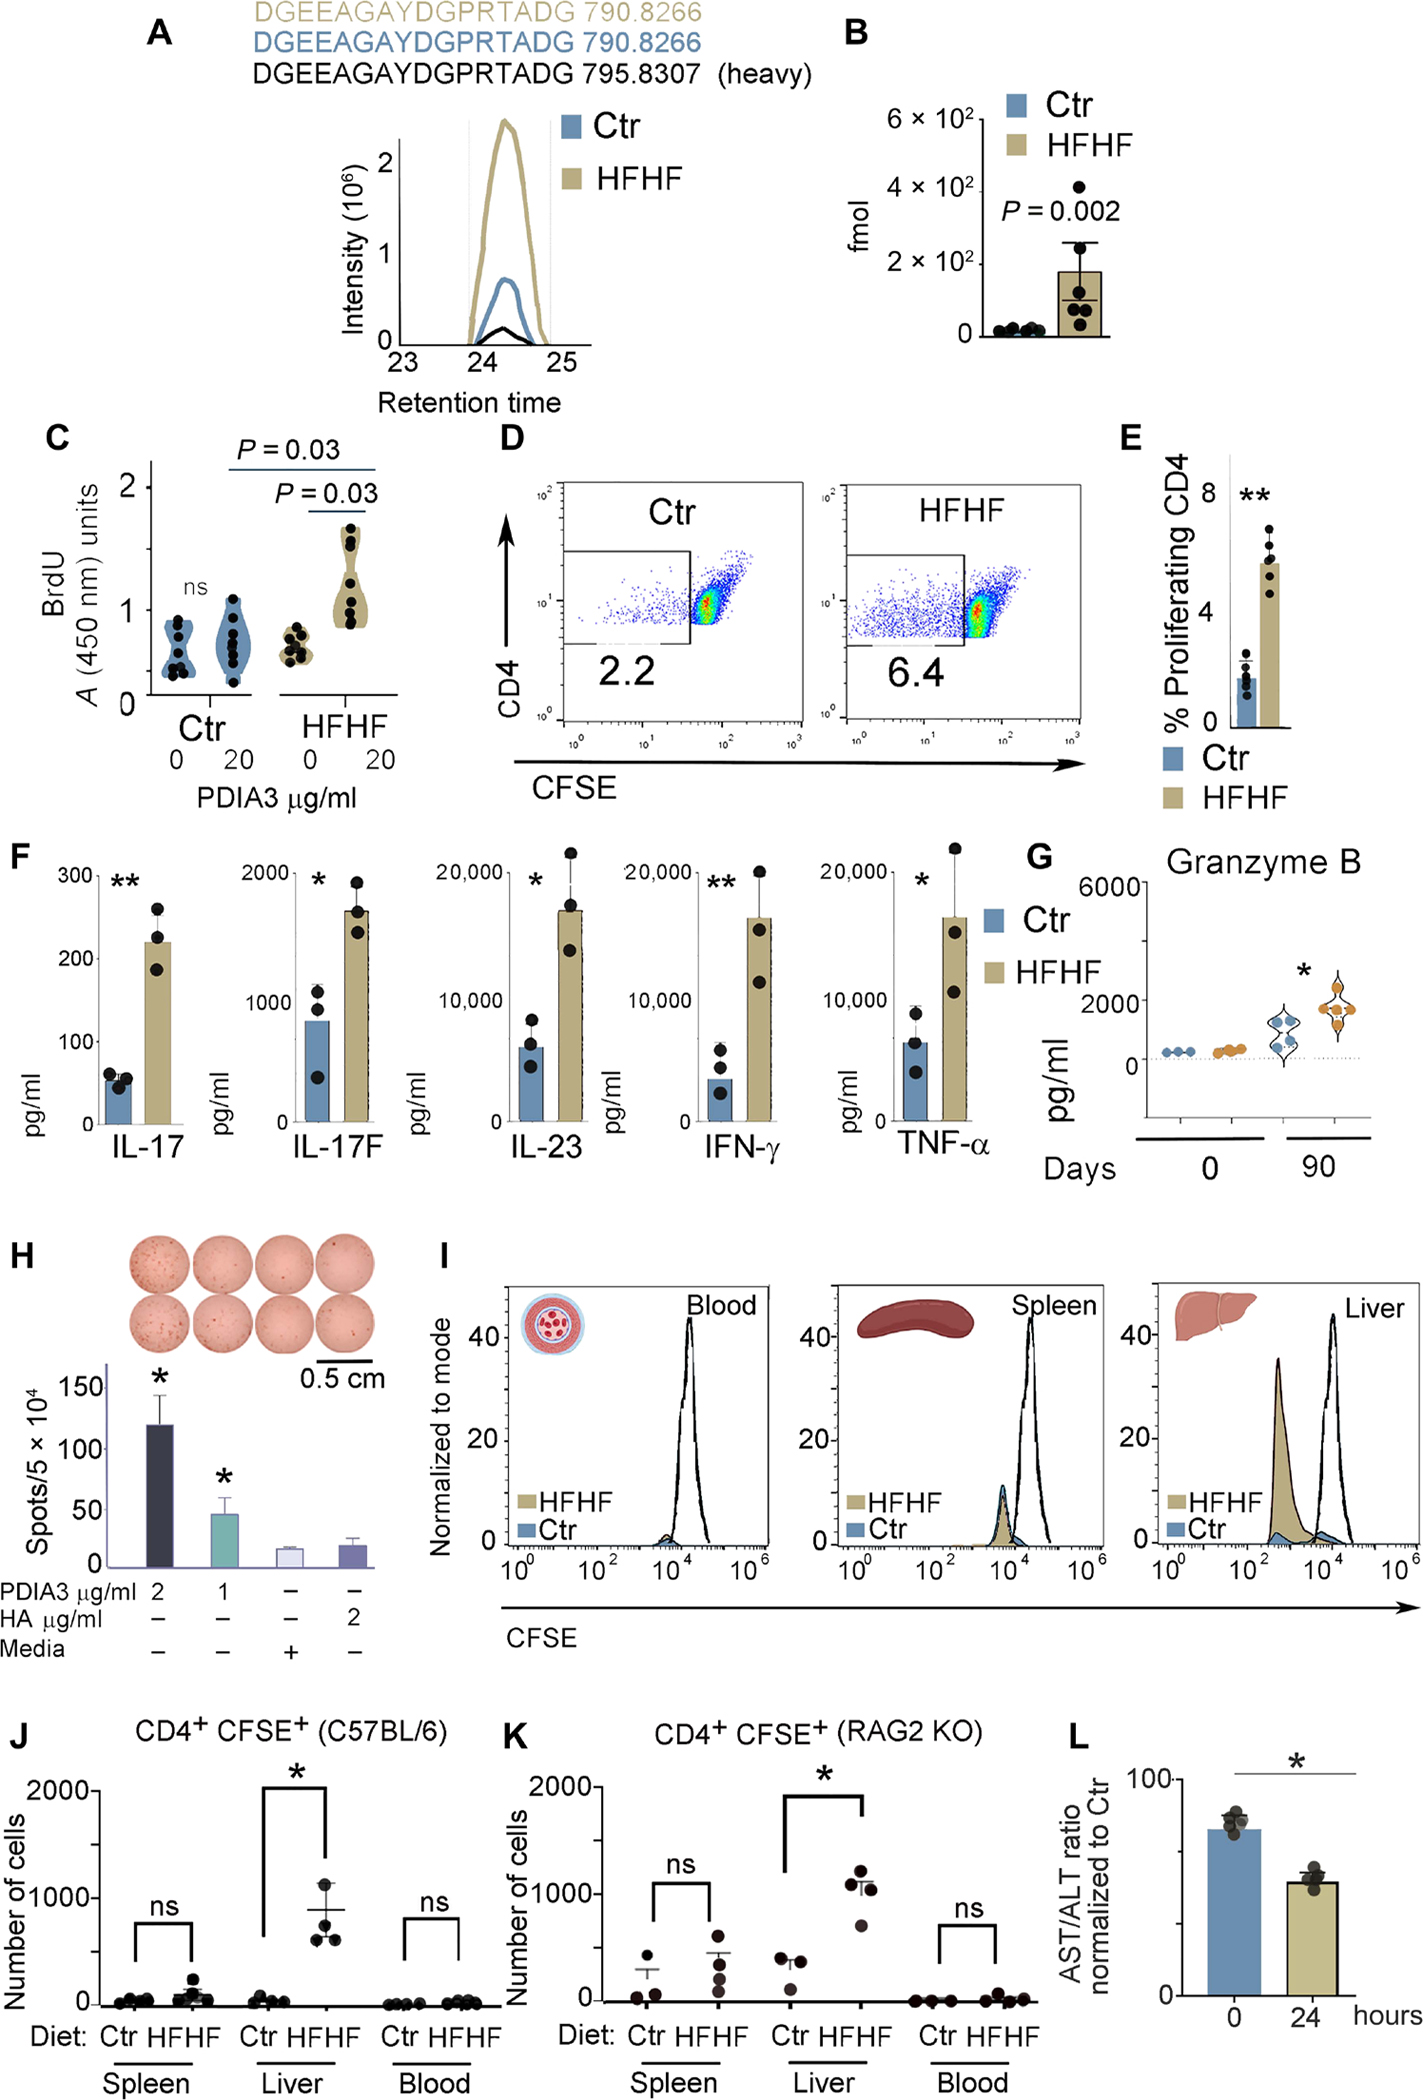
(A) MS-based PRM for absolute peptide quantitation and representative ion-extracted chromatogram of the MS1 precursors matching the 2 fmol of spiked heavy peptide DGEEAGAYDGPR[+10]TADG from PDIA3 (in black). The corresponding endogenous light peptides, found in the total peptidomes eluted from the liver immune infiltrates of control and HFHF mice, were coeluted with the spiked heavy standard. The complete transition list associated with the heavy and light (endogenous) peptide is presented in table S3. (B) PRM-derived quantitative analysis of endogenous DGEEAGAYDGPRTADG in the total peptidomes from the liver immune infiltrates of control and HFHF mice. Values, from n = 6 biologically independent replicates, are reported as mean relative expression ± SD and were statistically analyzed using an unpaired Mann-Whitney t test. Significance levels are reported as **P < 0.01. (C) Liver-infiltrating immune cells were cultured in the absence or presence of the PDIA3 peptide (20 μg/ml), and proliferating cells were quantified by 5-bromo-2′-deoxyuridine (BrdU) incorporation. Values, from n = 8 biologically independent replicates, are reported as mean relative expression ± SD and were statistically analyzed using multiple paired Student’s t test and Holm-Šídák method. Applying the unpaired t test retrieved a significant difference (P < 0.05) between the index proliferation of cells from control versus HFHF mice treated with PDIA3 peptide (20 μg/ml). (D and E) Immune infiltrates, separated as in (A), were labeled with CFSE and cultured with the PDIA3 peptide (20 μg/ml) for 3 days. Cells were then stained with CD4, and CFSElowCD4+ cells were quantified. Values, from n = 6 biologically independent replicates, are reported as mean relative expression ± SD and were statistically analyzed using a two-tailed unpaired Student’s t test. Significance levels are reported as **P < 0.01. (F) Total liver cell lysates harvested from control and HFHF mice were analyzed for inflammatory cytokines using the TH17 arrays as described in Materials and Methods. Values, from n = 3 biologically independent replicates, are reported as mean relative expression ± SD and were statistically analyzed using a two-tailed unpaired Student’s t test. Significance levels are reported as *P < 0.05 and **P < 0.01. (G) GZMB quantification by ELISA in liver immune infiltrates of control and HFHF mice prepared as in (E). Values, from n = 3 to n = 4 biologically independent replicates, are reported as mean relative expression ± SD and were statistically analyzed using ANOVA and Tukey’s multiple comparison test. Significance levels are reported as *P < 0.05 and **P < 0.01. (H) ELISPOT assay was performed on a PDIA3-specific T cell line prepared from lymph nodes isolated from HFHF-immunized mice. A statistically significant difference was observed for PDIA3 peptide (1 and 2 μg/ml) as compared with nonspecific hemagglutinin (HA) peptide and media alone. (I) Control and HFHF mice were injected with a CFSE-labeled PDIA3 T cell line; blood, spleen, and liver were harvested 24 hours after injection, and CD4+-CFSE+ cells were quantified. Representative histograms for control and HFHF mice. (J and K) Number of CD4+ CFSE+ cells harvested in each indicated organ from control and HFHF-injected mice. Experiments were performed in both C57BL/6 (K) and RAG2KO (L) mice kept for 3 months on a control or HFHF diet. Values from n = 3 or 4 biologically independent replicates are reported. Data were statistically analyzed by using two-tailed unpaired student’s t test. (L) AST/ALT ratio calculated from the sera of HFHF mice after injection of the PDIA3 T cell line. Data are normalized to control mice also injected with the PDIA3 T cell line. Values of n = 4 biologically independent replicates are reported. Data were statistically analyzed using one-way ANOVA followed by Dunnett’s multiple comparison test. Significance levels are reported as *P < 0.05.
As a next step, to dissect the relevance of anti-PDIA3 cellular immune responses for liver damage elicited by metabolic insults, we injected C57BL/6J and Rag2−/− mice (which lack T and B cells) maintained on a control or HFHF diet for 3 months with a PDIA3-specific T cell line preincubated with the fluorescent dye CFSE (for tracking and monitoring proliferation), which was confirmed to secrete IFN-γ after stimulation with the PDIA3 (2 μg/ml) (but not a nonspecific) peptide by enzyme-linked immunospot (ELISPOT) (Fig. 6H). Although injected cells could be detected in equal amounts in the blood and spleens of C57BL/6 and Rag2−/− mice on a control diet, only HFHF-exposed livers were infiltrated by a significant number of proliferating CD4+ cells as compared with control livers (Fig. 6, I to K). In addition, PDIA3-specific T cell inoculation was also associated with a statistically significant lower AST/ALT ratio in the recipients on an HFHF versus control diet (Fig. 6L), indicating that passive transfer of PDIA3-specific T cells contributed to hepatocyte death. Together, these data indicated that PDIA3-specific T cells contributed to liver damage during NASH (40).
PDIA3-specific antibodies are elevated in patients with chronic inflammatory conditions associated with liver damage
Because the mouse HFHF diet aims at recapitulating obesity and T2D, we were interested in testing the presence of anti-PDIA3 antibodies in patients with these conditions, as well as AIH and primary biliary cholangitis (PBC), two autoimmune conditions involving liver damage, the former of which has previously been associated with anti-PDIA3 antibodies (35). To this aim, we first developed an ELISA with recombinant human PDIA3 and tested sera from 48 patients with T2D. As a negative control, we used sera from 25 sex- and age-matched healthy individuals, whereas we harnessed sera from 28 patients with AIH and 18 with PBC as positive controls. In all these pathological conditions, a statistically significant increase of anti-PDIA3 antibodies was documented as compared with healthy individuals (Fig. 7, fig. S7, and table S7). Our data open the possibility that an anti-PDIA3 immune response may be contributing to liver damage not only in patients with T2D but also in patients with overt AIH.
Fig. 7. Elevated anti-PDIA3 autoantibodies in the sera of patients diagnosed with T2D, autoimmune hepatitis, and autoimmune cholangitis.
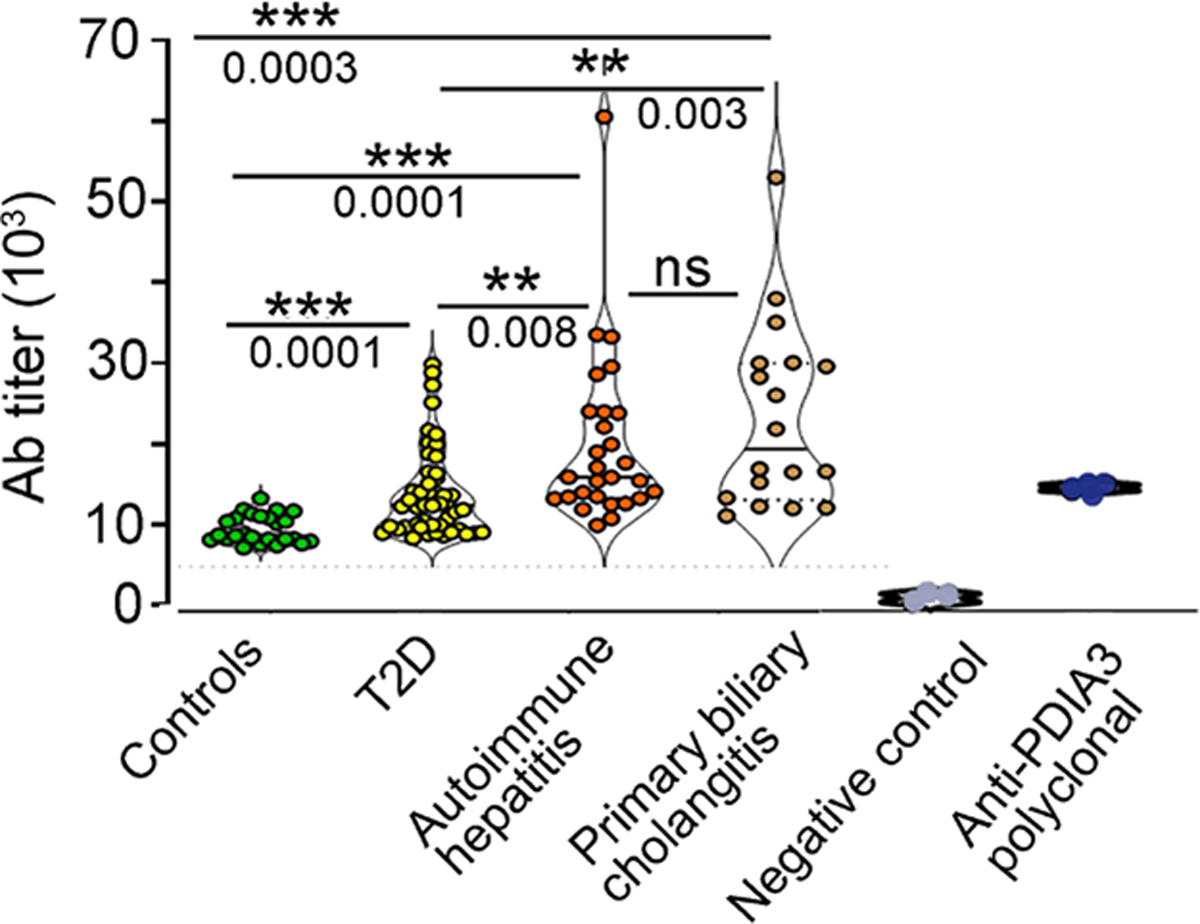
Sera, collected from 25 healthy age- and sex-matched controls, 48 patients with a diagnosis of T2D, 28 subjects with a diagnosis of AIH, and 18 subjects with PBC, were tested in ELISA against the full-length human PDIA3 protein. Antibody titers were quantified in each subject, and each dot symbol represents the average of three technical replicates. Statistical analysis for each serum and the representative binding curves are presented in fig. S7 and table S7. The statistical significance was determined with one-way ANOVA including mixed-effects model restricted maximum likelihood (REML) followed by multiple comparisons performed with uncorrected Fisher’s LSD test (***P < 0.0001, **P < 0.001, and *P < 0.01). For specificity testing, commercially available polyclonal anti-PDIA3 antibody was used as positive control, whereas PBS buffer served as negative control.
DISCUSSION
T and B cell autoreactivity spans from low/physiological levels, which are pivotal to maintain a tonic signal for cell survival and immune system homeostasis, to bona fide autoimmunity with pathogenic, immune-mediated organ injury. More than 80 autoimmune diseases have been characterized, encompassing tissue-specific conditions, such as type 1 diabetes and multiple sclerosis, and whole-body disorders, such as systemic lupus erythematosus. Common to all these pathologies is a strong genetic component and exaggerated T and/or B cell pathogenic responses leading to tissue damage. Between physiological autoreactivity and autoimmunity lies a hitherto poorly characterized degree of autoreactivity that is found in many chronic inflammatory conditions. This is characterized by circulating autoantibodies and organ immune infiltrates whose pathological consequences and antigenic specificities are yet to be determined.
Chronic inflammation has progressively been recognized to involve a strong adaptive immune component (24, 41). For instance, multiple cardiovascular disorders have been associated with elevated circulating levels of antiantibodies specific for cardiac or vascular proteins—such as troponin I3, cardiac type (TNNI3) (42), and oxidized apolipoproteins (43)—and ubiquitous proteins such as heat shock proteins (HSPs) (44). Similarly, antibodies recognizing several cytosolic proteins—such as glutamate decarboxylase 1 (GAD1), islet cell autoantigen 1 (ICA1), INSM transcriptional repressor 1 (INSM1), and solute carrier family 30 member 8 (SLC30A8)—are documented in the serum of patients with metabolic syndrome and T2D (29). However, despite an abundant literature correlating autoantibody titers, T cell activation, and disease severity, the actual pathogenic role that cellular and humoral responses play in the pathogenesis of cardiovascular diseases and T2D remains unclear.
Another important open question is whether immune autoreactivity is only sustained by the inflammatory environment or whether it also involves antigen-driven signaling. The former scenario would imply that pro-inflammatory stimuli—including cytokines, chemokines, and damage-associated molecular patterns (DAMPs) (45)—sustain bystander polyclonal B and T cell activation culminating with tissue damage. Conversely, the latter possibility would imply that chronic inflammation also skews the TCR and B cell receptor (BCR) repertoire toward selected specificities that aggravate damage.
Our study of DCs harvested from mice exposed to an HFHF diet supports the hypothesis that chronic inflammation skews the TCR and BCR repertoire by selecting specificities that aggravate hepatic damage. Our DC proteomic analysis mapped quantitative changes driven by HFHF to metabolism- and stress-related proteins (including a T2D-associated signature of insulin resistance), which were largely mirrored in the MHC-II immunopeptidome. Such altered presentation of MHC-II epitopes by DCs not only contributed to autoreactivity, as confirmed by increased T and B cell responsiveness to a PDIA3-derived peptide, but also aggravated hepatic inflammation and tissue damage, as confirmed by cytokine profiling of liver-infiltrating cells, passive transfer experiments, and cytotoxicity assay with hepatocytes, nodal cells, and PDIA3-specific antibodies. The fact that metabolic insults promoted a PDIA3-specific immune response that worsened liver damage, as observed by increased sera ALT and decreased AST/ALT ratio upon passive transfer of PDIA3-specific T cells and antibodies, highlighted the important difference between overt pathogenic immunity as observed in bona fide autoimmune disorders versus autoreactivity as found in chronic inflammatory conditions.
Albeit autoimmune diseases present with a wide spectrum of symptoms and pathological findings, they are all associated with a conducive poly-genetic component resulting from the additive effects of several risk variants (including specific human leukocyte antigen haplotypes), which ultimately develops into a destructive autoimmune response toward a specific tissue (9, 10). Moreover, bona fide autoimmunity invariably involves antigen-specific T or B cells that are sufficient in experimental disease models to transfer disease to healthy subjects (46). In line with this notion, patients with autoimmune disorders experience clinical benefits upon elimination of antigen-specific autoimmune cells (46). The adaptive immune response associated with T2D, metabolic syndrome, and obesity affects multiple organs—such as the liver, adipose tissue, muscle, pancreas, cardiovascular tissue, and brain—but it lacks a defined genetic component and an immunodominant antigenic signature, rather manifesting with a broad antigen specificity (24). Last, although the depletion or genetic inactivation of T and B cells confers protection against tissue damage in rodent models of T2D, clonally expanded B or T cells do not transfer the disease to healthy animals but only to animals with existing tissue damage, as also observed in our system (46).
The initial pathogenesis of T2D is metabolic in nature, emerging from a long-term excess in bioenergetic substrates that drive oxidative and reticular stress, culminating with lipo- and glucotoxicity coupled to the establishment of inflammation. These processes generate a microenvironment rich in cytokines and DAMPs, which sustains the immunostimulatory activity of DCs through activation of Toll-like receptors (TLRs) and inflammasome. Concomitantly, metabolic insults alter transcription and translation to induce qualitative and quantitative shifts in the cellular proteome, which are generally mirrored into the MHC-II immunopeptidome. Specifically, DCs experiencing oxidative and metabolic challenges appear to present an increased number of self-epitopes, including the PDIA3-derived peptide that we followed here. Ultimately, liver inflammation coupled to increased local presentation of PDIA3 peptides, as well as anti-PDIA3 antibodies binding to metabolically stressed hepatocytes, increased the likelihood for the priming of PDIA3-specific cellular and humoral responses that aggravate tissue damage.
Our data revealed increased presentation of PDIA3 peptides on MHC-II in the liver, as compared with the periphery, and increased titers of IgG2b and IgG3 anti-PDIA3 antibodies with cytotoxic activity in the context of metabolic stress. The pathogenic connotation of anti-PDIA3 immune responses was evident after passive transfer of cognate CD4+ T cells and antibodies that induced hepatocyte cytotoxicity with concomitant spillage of hepatic enzymes in the circulation. In conclusion, our data highlight the pathogenic role of smoldering, epitope-dependent immune autoreactivity in the progression of metabolic disorders originating from the establishment of local inflammation downstream of cellular damage.
MATERIALS AND METHODS
Study design
The main goal of the project was to determine the contribution of antigen-specific autoreactive T and B cells to the etiology of chronic inflammatory conditions. We harnessed a mouse model of diet-driven hepatotoxicity and quantitative MS to identify potential pathogenic epitopes that were validated for autoreactivity with proliferation assays of liver-infiltrating T cells. Both antibodies and T cells reactive against these epitopes were tested for pathogenic potential upon adoptive transfer, and the presence of antibodies against these epitopes was assessed in patients with various inflammatory conditions.
Chemicals
Acetic acid [ultra low content (ULC)/MS grade], acetonitrile, formic acid, methanol, trifluoroacetic acid (TFA), and ULC/MS-grade water (for nano-LC analysis, 99% purity) were purchased from Fisher Scientific. Dithiothreitol, tris(2-carboxyethyl)phosphine (TCEP)–HCl, iodoacetamide, ammonium bicarbonate, glycine, urea, thiourea, KCl, KH2PO4, H3PO4, and Na2CO3 were of the highest grade available from Sigma-Aldrich Millipore. Porcine trypsin (20 mg, specific activity >5000 U/mg sequencing grade modified), Lys-C (sequencing grade, 10 mg), and Glu-C sequencing grade (10 mg) were purchased from Promega (Madison, WI). All solutions were prepared using Milli-Q water purified by the Elix 3 UV Water Purification System (Millipore, Billerica, USA) and filtered through 0.2-mm pore membrane sterile filter units (Steritop, Millipore). All methods were performed in accordance with the relevant guidelines and regulations.
Human plasma experiments
T2D plasma/sera were purchased from ProMedDx, Medical Laboratories (Norton, MA). Plasma from patients with AIH or PBC enrolled in the Swiss AIH and PBC cohort studies was used. The studies are approved by the local ethics committees, and all patients have signed the relevant informed consent form. AIH and PBC diagnosis was made according to international guidelines (34, 47–49). All experiments were performed under the Weill Cornell Medical Center (WCMC) Institutional Review Board Protocol #19–05020126.
Mice and diet
C57BL/6J (stock no. 000664) and Ob/Ob C57BL/6.Cg-Lepob/J (stock no. 000632) were purchased from the Jackson Laboratory. All experiments were performed using 7- to 8-week-old mice with a 50% combination of male and female mice. All experiments were performed under the WCMC Institutional Animal Care and Use Committee Protocol #2019–0024. Animal diet is described in Supplementary Materials and Methods.
Glucose, insulin, triglycerides, and cholesterol determinations
Plasma was collected from control and HFHF mice at the end of the 3-month diet and stored at −20°C for downstream assays using commercially available kits. Concentrations of plasma glucose, triglycerides, cholesterol (all from Stanbio Laboratory), and nonesterified fatty acids (Wako Life Sciences) were measured using commercial colorimetric assays. Plasma insulin levels were quantified by ELISA (Crystal Chem).
In vivo and ex vivo measurement of reactive oxygen species
To investigate the levels of oxidative stress in different mouse groups and specific organs, we performed both in vivo and ex vivo imaging. Briefly, mice were tail vein–injected with 50 μl (2.5 mM) of the fluorescent probe CellROX (oxidative stress reagent, excitation: 640 nm, emission: 664 nm; Molecular Probes, CA, USA). After injection, mice were placed in an isoflurane chamber, and the whole body was imaged. Next, the animals’ organs—namely, spleen, small intestines, kidney, heart, and abdominal fat tissue—were dissected and placed onto a tray for ex vivo imaging using the In Vivo Imaging System (Kodak Image Station 400MM PRO, Carestream Health, New Haven, CT, USA). The whole bodies were imaged for 5 min, and specific organs were imaged for 3 min at excitation 610 nm/emission 700 nm using a built-in cooled charge-coupled device camera automated with a high-precision 10× zoom lens in a closed optical path imaging chamber. Images were thresholded with respect to background intensity, and different levels of fluorescence intensity were displayed using pseudo rainbow color scheme analyzed using built-in Carestream Molecular Imaging Software. Fluorescence intensity scale ranges from pink (lowest level) to red (highest level).
Mouse DC preparation
Mice on control and HFHF diet were injected subcutaneously with 40 × 106 B16-FLt3-L–producing melanoma cells to in vivo expand the number of DCs in secondary lymphatic organs (50). A complete description of DC purification is reported in Supplementary Materials and Methods.
Immunization
Mice were immunized with 100 μg of the PDIA3 peptides (DGEEAGAYDGPRTADG) or (IFRDGEEAGAYDGPRTADGIVSHLK) (Thermo Fisher Scientific) in complete Freund’s adjuvant (CFA) by injection at two sites, i.e., nape of the neck and base of the tail.
Perfusion
Two weeks after immunization, mice were anesthetized using isoflurane and perfused with 20 ml of cold 1× phosphate-buffered saline (PBS) by inserting an 18-gauge needle into the left ventricle of the heart upon cutting the right atrium. After perfusion, the liver, spleen, and lymph nodes were harvested for further analysis.
T and B cell proliferation
Inguinal and axillary lymph nodes from control or HFHF mice were collected in sterile PBS solution, and a single-cell suspension was prepared through a 100-μm cell strainer (Falcon, 352360). Cells were washed once in complete Dulbecco’s modified Eagle’s medium (DMEM) (Corning, 15-017-CV) containing glucose (4.5 g/liter), l-glutamine, sodium pyruvate, Hepes buffer, 10% fetal bovine serum, and antibiotic (streptomycin and penicillin) and then washed in PBS before CFSE labeling (BioLegend, 423801). CFSE-labeled cells were stimulated with PDIA3 peptide (0–2-20 μg/ml) in complete DMEM for 5 days and stained with 4′,6-diamidino-2-phenylindole (DAPI) (10 ng/ml; Sigma-Aldrich, D9542) alone or with DAPI plus CD4–allophycocyanin (APC)–Cy7 (BioLegend, 100526) and B220–Alexa Fluor 647 (BioLegend, 103226). Samples were acquired using Becton Dickinson Aria II (or Becton Dickinson Influx) and sorted as DAPI-negative (live) or CFSE-low (proliferated) CD4+ T cells or B220+ B cells.
Purification and proliferation of liver immune infiltrates
Livers were harvested from control and HFHF mice after perfusion with 1× PBS (Corning, #21-040-CV). Cell purification was performed as detailed in Supplementary Materials and Methods.
Cytokine measurements
Supernatants from proliferating nodal cells [PDIA3 peptide (0–2-20 μg/ml)] were harvested, and the concentrations of 26 cytokines were measured using ProcartaPlex multiplex immunoassays (Thermo Fisher Scientific) according to the manufacturer’s instructions. The concentration of each cytokine was calculated according to the standard curve of the assay obtained with the standards provided with the assay. Each condition of stimulation was assessed in triplicates. The concentrations of the cytokines were statistically analyzed using the Mann-Whitney test.
Cytokine quantification
Cytokines in liver infiltrates were analyzed with the mouse cytokine array kit (Quantibody Mouse Th17 Array 1, QAM-TH17-1 from RayBiotech Inc., Norcross, GA), as detailed in Supplementary Materials and Methods.
GZMB quantification
GZMB was quantified using a sandwich ELISA assay (Duo-Set-ELISA; R&D Systems, catalog no. DY1865-05) as detailed in Supplementary Materials and Methods.
Detection of mouse and human anti-PDIA3 autoantibodies
To detect antibodies to the full-length protein, we incubated Pierce 96-Well Nickel-Coated Plates (Thermo Fisher Scientific, catalog no.15442) with 2 μg per well of His-tag human PDIA3 for 2 hours at 37°C, followed by a brief washing with 1× PBS–Tween 20 (PBST) and blocking with 2% bovine serum albumin (BSA) in 1× PBST for 2 hours. The plate was then washed with 1× PBST and loaded with 100 μl per well of serial dilutions of mouse or human sera harvested from healthy subjects or subjects diagnosed with T2D, AIH, and idiopathic cholangitis (1:500 dilution). Sera were incubated for 18 hours at 4°C with gentle shaking. The next day, the plate was washed with 1× PBST and incubated with polyclonal rabbit anti-mouse secondary antibodies coupled with horseradish peroxidase (HRP) (1:3000 in PBS) (Southern Biotech, catalog no. 1036–05) or polyclonal goat anti-human secondary antibody coupled with HRP (Novus Biologicals, catalog no. NB7487) for 2 hours at room temperature (RT). The plate was developed with 90 μl per well of TMB substrate solution [1:1 mixture of color reagent A (H2O2) and color reagent B (tetramethylbenzidine) for 10 min at RT in the dark]. The reaction was stopped with 50 μl of stop solution (2 N H2SO4) for each well. Plate reading was performed at 450 nm using a microplate reader (FlexStation 3, from Molecular Devices).
To detect antibodies to the PDIA3 peptide, we adsorbed the biotin-labeled PDIA3 peptide (2 μg/ml) (IFRDGEEAGAYDGPRTADGIVSHLK) onto Pierce Streptavidin Coated 96-Well High-Capacity Plates (Thermo Fisher Scientific, catalog no. 15500). The adsorption was performed for 2 hours at 37°C in PBS buffer followed by two washings with PBS + 0.05% Tween 20 (1× PBST) and blocking with 2% BSA in 1× PBST for 1 hour at RT. One hundred microliters of serial dilutions of mouse or human sera harvested from healthy subjects or subjects diagnosed with T2DM, AIH, and idiopathic cholangitis was added to the plate and incubated at 4°C overnight. The next day, the plate was washed three times in 1× PBST and developed with 1:3000 rabbit anti-mouse secondary antibody coupled with HRP or polyclonal goat anti-human secondary antibody coupled with HRP (Novus Biologicals, catalog no. NB7487) for 2 hours at RT. The plate was developed with 90 ml per well of TMB substrate solution [1:1 mixture of color reagent A (H2O2) and color reagent B (tetramethylbenzidine) for 10 min at RT in the dark]. The reaction was stopped with 50 ml of stop solution (2 N H2SO4) in each well. The optical density was determined at 450 nm using a microplate reader (FlexStation 3, Molecular Devices). The median inhibitory concentration (IC50) (antibody titers) was calculated after fitting the experimental data using the equation “[Inhibitor] versus normalized response” provided by GraphPad Prism (version 9.0 for curve fitting).
Detection and titration of mouse autoantibodies against selected metabolic enzymes
To determine the presence of autoantibody against the MDH, ALDOA (Sigma-Aldrich), and PKM (RayBiotech) proteins, we used a similar ELISA assay used for the detection and quantitation of anti-PDIA3 autoantibodies. Briefly, 96-well ELISA plates were incubated with 5 μg/ml of each of the recombinant protein. Serial dilution of sera collected from control and HFHF mice was used for antibody titer, and incubations, washes, and detection were as described above for PDIA3 autoantibody.
Purification of mouse anti-PDIA3 autoantibodies
Forty microliters of mouse sera was incubated with 15-μl slurry of protein L magnetic beads (Thermo Fisher Scientific, catalog no. 88850) in Ag/antibody binding buffer (Thermo Fisher Scientific, catalog no. 21030) for 18 hours at 4°C. Beads were then washed six times in 20 mM Hepes and 0.05% Tween 20 buffer. Protein L–bound antibodies were eluted in 50 μl of high-salt Ag/antibody gentle elution buffer (Thermo Fisher Scientific, catalog no.1856282). The eluted antibodies were then diluted 1:5 in the Ag/antibody binding buffer (Thermo Fisher Scientific, catalog no. 21030) and incubated with 15 μl of a slurry containing streptavidin beads (Thermo Fisher Scientific, catalog no. 88817) preadsorbed with biotinylated PDIA3 peptide (biotin-IFRDGEEAGAYDGPRTADG) [synthesized by Pierce Custom Peptides (Thermo Fisher Scientific, Rockford, IL, USA)]. The mixture was incubated for 18 hours at 4°C with gentle shaking. The next day, after six washings in 20 mM Hepes and 0.05% Tween 20 buffer, antibodies were eluted with 50 μl of high-salt Ag/antibody gentle elution buffer (Thermo Fisher Scientific, catalog no. 1856282). Eluted antibodies were tested for their purity by SDS–polyacrylamide gel electrophoresis (PAGE) and validated for their specificity against the PDIA3 peptide by immunoblotting and ELISA.
SDS-PAGE and immunoblotting of PDIA3-purified antibodies
Eluted antibodies (10 μl from each purified sample) were mixed with sample buffer, heated at 95°C for 5 min, and run on 4 to 12% NuPAGE SDS-PAGE (Thermo Fisher Scientific, catalog no. NP335BOX). Gels were stained with silver staining according to the manufacturer’s suggestions (Pierce, catalog no. PI24600). Human His-tag PDIA3 protein (Creative BioMart, catalog no. PDIA3-20H) was loaded 2 μg per well on 4 to 12% NuPAGE SDS-PAGE followed by transfer onto nitrocellulose membrane (0.45 μm). Immunoblotting was performed by incubating the membrane with 1:500 dilution of purified mouse anti-PDIA3 antibody in PBS after blocking in 5% nonfat dried milk in PBST (0.05%). The monoclonal rabbit anti-his tag antibody (Novus Biologicals, catalog no. NBP2-61482) (1:1000 dilution in PBS) was used as a positive control to detect the His-tag human PDIA3 protein. After three washes in PBS and 0.05% Tween 20, the membrane was developed using the anti-rabbit (IRDye 800CW) and anti-mouse (IRDye 680RD) secondary antibodies (1:5000 dilution in PBS) from LI-COR Biosciences Inc. The fluorescence signal was acquired on a C600 Azure Biosystems imaging device.
Ig mouse isotype profiling
Anti-PDIA3–eluted antibodies were tested for isotype specificity by ELISA (Thermo Fisher Scientific, catalog no. 88–50660) following the manufacturer’s instructions. Briefly, 10 μl of the eluted antibodies was loaded to an ELISA plate coated with anti-IgG1, IgG2a, IgG2b, IgG3, IgA, IgM, and anti-κ and anti-λ isotype capture antibodies. Plates were developed with 90 μl per well of TMB substrate solution [1:1 mixture of color reagent A (H2O2) and color reagent B (tetramethylbenzidine) for 10 min at 22°C in the dark]. The reaction was stopped with 50 μl of stop solution (2 N H2SO4) in each well. The optical density was quantified at 450 nm using a microplate reader (Flex Station 3, Molecular Devices).
Quantification of PDIA3 surface expression
Lymph nodes, spleen, pancreas, liver, heart, and fat tissue were harvested from control and HFHF-fed mice after perfusion with 1× PBS. Single-cell suspension of lymph nodes and spleen was also prepared as described above. In all preparations, red blood cells were removed using the ammonium-chloride-potassium lysis buffer (Thermo Fisher Scientific, #A1049201). Heart and abdominal fat were minced and placed into a gentleMACS C tube (#130-093-237) containing collagenase D (1 mg/ml) (Roche, #11088882001) in Hepes buffer, whereas the pancreas was mixed with collagenase P (0.4 mg/ml) (Roche, #11215809103) and deoxyribonuclease I (2000 U/ml) (Thermo Fisher Scientific, #18047019) and incubated at 37°C for 30 min with continuous shaking. Livers were dissociated using the liver dissociation kit (Miltenyi Biotec, #130105807). After digestion, single-cell suspensions were passed through a 40- to 100-μm cell strainer followed by three washes with 10 ml of Hanks’ balanced salt solution buffer. Liver infiltrates were isolated by density gradient separation using Ficoll (Cytia, #17144003). Cells were then counted using trypan blue staining and Cellometer Auto T4 (Nexcelom Bioscience) and plated in 96-well V-bottom plates for staining. Cells were stained using ERp57/ERp60 polyclonal antibody (Thermo Fisher Scientific, #15967-1-AP) followed by anti-rabbit IgG–fluorescein isothiocyanate (Santa Cruz Biotechnology, #sc-2359). Samples were run on the Symphony A5 Cell Analyzer (BD Biosciences) at the WCMC Flow Cytometry Core Facility, and data were analyzed using FlowJo software (BD Biosciences). Mean fluorescence index (MFI) on each cell population was normalized to the MFI of lymph node control.
Quantification of AST and ALT enzymes
Blood was collected retro-orbitally, and sera were isolated by keeping the blood at RT for 30 min, followed by centrifugation at 2000g for 10 min at 4°C. AST and ALT were measured using the following kits: AST (Sigma-Aldrich, #MAK055) and ALT (Sigma-Aldrich, #MAK052).
Antibody adoptive transfer
Total Ig was purified from immunized control and HFHF mice by using magnetic L beads as described above. Anti-PDIA3–specific antibodies were purified using Pierce Protein A/G Plus Agarose (Thermo Fisher Scientific, #20423). The purified antibodies were labeled with CY5 by using Lynx Rapid plus CY5 antibody conjugation kit (Bio-Rad, LNK211CY5), as per the manufacturer’s instructions. Labeled antibodies were buffer-exchanged in 1× PBS, quantified, and sterile-filtered using 0.2-μm filter before intraperitoneal injection. Fifty micrograms of labeled antibody was injected intraperitoneally in either control or HFHF-fed mice. Twenty-four hours after injection, mice were perfused with cold 1× PBS for 24 hours. Livers were harvested and fixed in 4% paraformaldehyde for 24 hours followed by 30% sucrose infiltration for 12 hours and optimal cutting temperature (OCT) embedding. To induce antibody cytotoxicity, we injected mice intraperitoneally with 100 μg of antibody prepared as described above without CY5 labeling. Twenty-four and 48 hours after injection, blood was collected retro-orbitally for AST and ALT measurements.
Cytotoxicity assays
Single-cell suspension of mouse hepatocytes, obtained with the liver dissociation kit (Miltenyi Biotec, #130105807), was prepared in calcein buffer (R&D Systems, catalog no. 4892–010) at 2.0 × 10⁶ viable cells per milliliter and labeled with calcein (R&D Systems, catalog no. 4892–010). Calcein-labeled hepatocytes were seeded in a clear bottom black-walled 96-well plate (Corning, catalog no. 4520) at 50,000 per well and allowed to adhere for 2 hours in a tissue incubator at 37°C, 5% CO2. Single-cell suspension from lymph nodes, collected from each mouse group (control and HFHF before and after diet and before and after PDIA3 peptide immunization), was incubated with the hepatocytes (200,000 cell per well). Titrated amount (1:10; 1:100; 1:1000) of sera collected from the same mice (control and HFHF before and after diet and before and after PDIA3 peptide immunization) was added to each well. The mixture was incubated for 6 hours in a tissue incubator at 37°C, 5% CO2. Wells were washed six times in calcein buffer, and fluorescence was recorded at 490-nm excitation and 520-nm emission filter. Fluorescence reading in wells with seeded hepatocytes without lymph node suspensions and without sera was considered 100% and was used to calculate fluorescence percentage in each experimental well.
T cell adoptive transfer
Mice were immunized subcutaneously with 100 μg of the PDIA3 peptide in CFA at the nape of the neck and the base of tail. After 4 weeks, mice were boosted with the same PDIA3 peptide in incomplete Freund’s adjuvant. After 10 days, mice were euthanized, and draining lymph nodes and spleens were harvested and prepared in a single-cell suspension. Cells were stimulated ex vivo with PDIA3 peptide (20 μg/ml), and expansion of anti-PDIA3 T cells was monitored by proliferation assay. Before passive transfer, cells were labeled with CFSE (BioLegend, #423801) and 20 million cells, resuspended in 100 μl of PBS, and injected through the tail vein in control and HFHF mice. Twenty-four hours after injection, blood was collected retro-orbitally for fluorescence-activated cell sorting (FACS) and AST/ALT enzymatic assay.
Flow cytometry
Single-cell suspensions were stained with Zombie Aqua (BioLegend, #423102) and CD4-APC-Cy7 (BioLegend, #100526). Stained cells were run on Attune Next Flow Cytometer (Thermo Fisher Scientific). Acquired data were analyzed by the FlowJo_v10.8.1 software (BD Biosciences). Splenocytes collected from CellROX injected mice were stained with CD11c [BD Biosciences, catalog no. 553801 (hamster anti-mouse CD11c) or BD Biosciences, catalog no. 553801 (hamster anti-mouse CD11c)], MHC-II [BioLegend, catalog no. 107625 (rat anti-mouse I-A/I-E antibody)], CD86 [BD Biosciences, catalog no. 553691 (rat anti-mouse CD86)], and CD80 [BioLegend, catalog no. 104708 (hamster anti-mouse CD80 antibodies)].
Confocal analysis
Livers harvested from control or HFHF mice, injected with anti–PDIA3 antibody–Cy5 conjugated 24 hours before, were OCT-embedded and sectioned at 5- to 7-μm thickness. A detailed histological analysis is reported in Supplementary Materials and Methods.
Histology
After perfusion, the liver tissue was placed in tissue cassette and fixed in 10% formalin for 24 hours. A detailed histological analysis is reported in Supplementary Materials and Methods.
DC proteomics analysis
A detailed proteomic analysis of DC lysates is reported in Supplementary Materials and Methods.
Peptidome extraction from the immune infiltrates in the livers of control and HFHF mice
A detailed peptidome analysis of MHC-II eluate is reported in Supplementary Materials and Methods.
Absolute peptide quantification using stable isotope–labeled peptides and PRM
A peptide spanning regions 105 to 129 of the PDIA3 protein (DGEEAGAYDGPRTADG) was selected for synthesis and absolute quantification in the total I-Ab–eluted immunopeptidomes from mice kept on different diet regime. The detailed methodology is reported in Supplementary Materials and Methods.
I-Ab ELISA
The monoclonal antibody 17/227 (200 ng per well), diluted in bicarbonate/carbonate buffer pH 9.0, was used to coat the wells of high-binding 96-well plates (Immulon 4 HBXND541225). The plates were incubated at 4°C overnight or at 37°C for 2 hours. The wells were blocked using 3% BSA in 1× PBS for 1 hour at 37°C. The monoclonal anti–MHC-II antibody (M5/114) was used as the primary antibody for the detection. HRP-conjugated goat anti-rat IgG (KPL:14-16-12) was used as the secondary antibody followed by the 2,2′-azino-di-(3-ethylbenzthiazoline sulfonic acid) (ABTS) substrate solution (Roche-11 684 302 001) for the colorimetric detection. Incubations were done at 1 hour at 37°C, and the washes between every incubation were performed using 1× PBST buffer (1× PBS, 0.05% Triton X-100 three times). The dilutions of protein and antibody were done in dilution buffer 0.3% BSA, 0.1% Triton X-100 in 1× PBS. Recombinant I-Ab–peptide complex was used as standard protein (1 ng to 2 μg) to calculate the amounts of I-Ab in each preparation.
Isolation and analysis of I-Ab–bound peptides from mouse DCs
I-Ab peptide complexes from DCs of control mice, Ob/Ob mice, and HFHF mice were isolated using immunoaffinity chromatography. Three independent samples of C57Bl6 controls, HFHF, and Ob/Ob were isolated in parallel. The detailed methodology is reported in Supplementary Materials and Methods.
Gene ontology annotations and functional analysis of networks and cellular pathways
The detailed methodology is reported in Supplementary Materials and Methods.
Generation of anti-PDIA3 T cell line
The detailed methodology is reported in Supplementary Materials and Methods.
Statistics
Statistical analysis was performed using Windows GraphPad Prism 8.0 and 9.0 (GraphPad Software, La Jolla, CA, USA). Numerical results are reported as means ± SE or ± SD as indicated. Data are derived from a minimum of three independent experiments, and each data collection was performed using at least two technical replicates unless otherwise stated. The statistical significance of the difference between two groups was assessed with a two-tailed paired or unpaired Student’s t test, including Mann-Whitney or Wilcoxon tests. Significance levels were reported as *P < 0.05, **P < 0.01, ***P < 0.001, and ****P < 0.0001. Statistical significance of the difference between multiple (n > 2) experimental groups, such as for some ELISA assays, was determined using one-way and two-way analysis of variance (ANOVA) followed by multiple comparisons using uncorrected Fisher’s least significant difference (LSD), Kruskal-Wallis, uncorrected Dunn’s test, Holm-Šídák, Dunnett, and/or Tukey tests. Additional multiple paired t tests, paired Student’s t test, and Holm-Šídák tests were used to determine the significance among the proliferation indexes of liver’s immune infiltrates treated with PDIA3 peptide DGEEAGAYDGPRTADG. P < 0.05 was considered significant. LFQ analysis of changes in the protein expression profiles was performed in Scaffold DIA (Proteome Software, OR, USA) using the normalized DIA intensities. The normalized DIA intensities were summed over all identified and validated peptides from each protein group and are proportional to the relative abundance of each protein. One-way ANOVA/t tests with Benjamini-Hochberg correction were further applied to assess the significant changes in the protein expression across two groups, i.e., control normal diet (B6) and HFHF samples. LFQ analysis in Peaks X/X+/XPro software (Bioinformatics Solutions, Waterloo, Canada) was performed using one-way ANOVA for assessing the significance of the changes associated with the quantitative protein expression profiles. P < 0.05 was considered significant. The Pearson’s correlation score was used to assess the reproducibility among the proteomics data of primary DCs purified from mice on either HFHF or normal diet. A Pearson score of >0.5 (P < 0.05) was considered significant. Quantitative analysis of changes in the protein expression profiles and their associated cellular pathways was performed in IPA, which identified significant (P < 0.05) cellular and molecular functions by applying a Fisher’s exact test with Benjamini-Hochberg correction.
Supplementary Material
Funding:
This work was supported by the following grants: NIHAI146180 and NIH AI137198 (to L.S. and L.J.S.).
Footnotes
Competing interests: L.G. has been holding research contracts with Lytix Biopharma and Promontory; has received consulting/advisory honoraria from Boehringer Ingelheim, AstraZeneca, OmniSEQ, Onxeo, The Longevity Labs, Inzen, Sotio, Promontory, Noxopharm, EduCom, and the Luke Heller TECPR2 Foundation; and holds Promontory stock options. The other authors declare no competing interests.
SUPPLEMENTARY MATERIALS
www.science.org/doi/10.1126/sciimmunol.abl3795
Supplementary Materials and Methods
Data files S1 to S6
Data and materials availability:
Proteomic and eluted peptidome data that support the findings of this study have been deposited in the PRIDE database. Project name: Characterization of I-Ab MHC-II immunopeptidome eluted from control, obese (Ob/Ob), and HFHF mice (51). Project accession: PXD023581, PXD018783, and PXD024239. Additional DIA data for the total proteomes from DCs of B6 and HFHF mice were deposited at the PRIDE database with the Proteome Xchange accession number PXD026190. The I-Ab–eluted immunopeptidome from the same sample set was deposited with the accession number PXD026068.
REFERENCES AND NOTES
- 1.Ahechu P, Zozaya G, Marti P, Hernandez-Lizoain JL, Baixauli J, Unamuno X, Fruhbeck G, Catalan V, NLRP3 inflammasome: A possible link between obesity-associated low-grade chronic inflammation and colorectal cancer development. Front. Immunol. 9, 2918 (2018). [DOI] [PMC free article] [PubMed] [Google Scholar]
- 2.Hotamisligil GS, Shargill NS, Spiegelman BM, Adipose expression of tumor necrosis factor-alpha: Direct role in obesity-linked insulin resistance. Science 259, 87–91 (1993). [DOI] [PubMed] [Google Scholar]
- 3.Weisberg SP, McCann D, Desai M, Rosenbaum M, Leibel RL, Ferrante AW Jr., Obesity is associated with macrophage accumulation in adipose tissue. J. Clin. Invest. 112, 1796–1808 (2003). [DOI] [PMC free article] [PubMed] [Google Scholar]
- 4.Wu D, Molofsky AB, Liang HE, Ricardo-Gonzalez RR, Jouihan HA, Bando JK, Chawla A, Locksley RM, Eosinophils sustain adipose alternatively activated macrophages associated with glucose homeostasis. Science 332, 243–247 (2011). [DOI] [PMC free article] [PubMed] [Google Scholar]
- 5.Oh DY, Morinaga H, Talukdar S, Bae EJ, Olefsky JM, Increased macrophage migration into adipose tissue in obese mice. Diabetes 61, 346–354 (2012). [DOI] [PMC free article] [PubMed] [Google Scholar]
- 6.Stefanovic-Racic M, Yang X, Turner MS, Mantell BS, Stolz DB, Sumpter TL, Sipula IJ, Dedousis N, Scott DK, Morel PA, Thomson AW, O’Doherty RM, Dendritic cells promote macrophage infiltration and comprise a substantial proportion of obesity-associated increases in CD11c+ cells in adipose tissue and liver. Diabetes 61, 2330–2339 (2012). [DOI] [PMC free article] [PubMed] [Google Scholar]
- 7.Harmon DB, Wu C, Dedousis N, Sipula IJ, Stefanovic-Racic M, Schoiswohl G, O’Donnell CP, Alonso LC, Kershaw EE, Kelley EE, O’Doherty RM, Adipose tissue-derived free fatty acids initiate myeloid cell accumulation in mouse liver in states of lipid oversupply. Am. J. Physiol. Endocrinol. Metab. 315, E758–E770 (2018). [DOI] [PMC free article] [PubMed] [Google Scholar]
- 8.Tam CS, Garnett SP, Cowell CT, Heilbronn LK, Lee JW, Wong M, Baur LA, IL-6, IL-8 and IL-10 levels in healthy weight and overweight children. Horm. Res. Paediatr. 73, 128–134 (2010). [DOI] [PubMed] [Google Scholar]
- 9.Zatterale F, Longo M, Naderi J, Raciti GA, Desiderio A, Miele C, Beguinot F, Chronic adipose tissue inflammation linking obesity to insulin resistance and type 2 diabetes. Front. Physiol. 10, 1607 (2020). [DOI] [PMC free article] [PubMed] [Google Scholar]
- 10.Xu H, Barnes GT, Yang Q, Tan G, Yang D, Chou CJ, Sole J, Nichols A, Ross JS, Tartaglia LA, Chen H, Chronic inflammation in fat plays a crucial role in the development of obesity-related insulin resistance. J. Clin. Invest. 112, 1821–1830 (2003). [DOI] [PMC free article] [PubMed] [Google Scholar]
- 11.Liu R, Nikolajczyk BS, Tissue immune cells fuel obesity-associated inflammation in adipose tissue and beyond. Front. Immunol. 10, 1587 (2019). [DOI] [PMC free article] [PubMed] [Google Scholar]
- 12.Tilg H, Moschen AR, Adipocytokines: Mediators linking adipose tissue, inflammation and immunity. Nat. Rev. Immunol. 6, 772–783 (2006). [DOI] [PubMed] [Google Scholar]
- 13.Pereira-Dutra FS, Teixeira L, de Souza Costa MF, Bozza PT, Fat, fight, and beyond: The multiple roles of lipid droplets in infections and inflammation. J. Leukoc. Biol. 106, 563–580 (2019). [DOI] [PubMed] [Google Scholar]
- 14.Kanda H, Tateya S, Tamori Y, Kotani K, Hiasa K, Kitazawa R, Kitazawa S, Miyachi H, Maeda S, Egashira K, Kasuga M, MCP-1 contributes to macrophage infiltration into adipose tissue, insulin resistance, and hepatic steatosis in obesity. J. Clin. Invest. 116, 1494–1505 (2006). [DOI] [PMC free article] [PubMed] [Google Scholar]
- 15.Ghazarian M, Revelo XS, Nohr MK, Luck H, Zeng K, Lei H, Tsai S, Schroer SA, Park YJ, Chng MHY, Shen L, D’Angelo JA, Horton P, Chapman WC, Brockmeier D, Woo M, Engleman EG, Adeyi O, Hirano N, Jin T, Gehring AJ, Winer S, Winer DA, Type I interferon responses drive intrahepatic t cells to promote metabolic syndrome. Sci. Immunol. 2, eaai7616 (2017). [DOI] [PMC free article] [PubMed] [Google Scholar]
- 16.Ellulu MS, Patimah I, Khaza’ai H, Rahmat A, Abed Y, Obesity and inflammation: The linking mechanism and the complications. Arch. Med. Sci. 13, 851–863 (2017). [DOI] [PMC free article] [PubMed] [Google Scholar]
- 17.Acosta JR, Douagi I, Andersson DP, Backdahl J, Ryden M, Arner P, Laurencikiene J, Increased fat cell size: A major phenotype of subcutaneous white adipose tissue in non-obese individuals with type 2 diabetes. Diabetologia 59, 560–570 (2016). [DOI] [PubMed] [Google Scholar]
- 18.Travers RL, Motta AC, Betts JA, Bouloumie A, Thompson D, The impact of adiposity on adipose tissue-resident lymphocyte activation in humans. Int. J. Obes. 39, 762–769 (2015). [DOI] [PMC free article] [PubMed] [Google Scholar]
- 19.Winer S, Chan Y, Paltser G, Truong D, Tsui H, Bahrami J, Dorfman R, Wang Y, Zielenski J, Mastronardi F, Maezawa Y, Drucker DJ, Engleman E, Winer D, Dosch HM, Normalization of obesity-associated insulin resistance through immunotherapy. Nat. Med. 15, 921–929 (2009). [DOI] [PMC free article] [PubMed] [Google Scholar]
- 20.Winer S, Paltser G, Chan Y, Tsui H, Engleman E, Winer D, Dosch HM, Obesity predisposes to Th17 bias. Eur. J. Immunol. 39, 2629–2635 (2009). [DOI] [PubMed] [Google Scholar]
- 21.Tsai S, Clemente-Casares X, Zhou AC, Lei H, Ahn JJ, Chan YT, Choi O, Luck H, Woo M, Dunn SE, Engleman EG, Watts TH, Winer S, Winer DA, Insulin receptor-mediated stimulation boosts T cell immunity during inflammation and infection. Cell Metab. 28, 922–934.e4 (2018). [DOI] [PubMed] [Google Scholar]
- 22.Nishimura S, Manabe I, Nagai R, Adipose tissue inflammation in obesity and metabolic syndrome. Discov. Med. 8, 55–60 (2009). [PubMed] [Google Scholar]
- 23.Winer DA, Winer S, Shen L, Wadia PP, Yantha J, Paltser G, Tsui H, Wu P, Davidson MG, Alonso MN, Leong HX, Glassford A, Caimol M, Kenkel JA, Tedder TF, McLaughlin T, Miklos DB, Dosch HM, Engleman EG, B cells promote insulin resistance through modulation of T cells and production of pathogenic IgG antibodies. Nat. Med. 17, 610–617 (2011). [DOI] [PMC free article] [PubMed] [Google Scholar]
- 24.Winer S, Winer DA, The adaptive immune system as a fundamental regulator of adipose tissue inflammation and insulin resistance. Immunol. Cell Biol. 90, 755–762 (2012). [DOI] [PubMed] [Google Scholar]
- 25.Khan IM, Dai Perrard XY, Perrard JL, Mansoori A, Wayne Smith C, Wu H, Ballantyne CM, Attenuated adipose tissue and skeletal muscle inflammation in obese mice with combined CD4+ and CD8+ T cell deficiency. Atherosclerosis 233, 419–428 (2014). [DOI] [PMC free article] [PubMed] [Google Scholar]
- 26.Jiang E, Perrard XD, Yang D, Khan IM, Perrard JL, Smith CW, Ballantyne CM, Wu H, Essential role of CD11a in CD8+ T-cell accumulation and activation in adipose tissue. Arterioscler. Thromb. Vasc. Biol. 34, 34–43 (2014). [DOI] [PMC free article] [PubMed] [Google Scholar]
- 27.McLaughlin T, Liu LF, Lamendola C, Shen L, Morton J, Rivas H, Winer D, Tolentino L, Choi O, Zhang H, Chng MHY, Engleman E, T-cell profile in adipose tissue is associated with insulin resistance and systemic inflammation in humans. Arterioscler. Thromb. Vasc. Biol. 34, 2637–2643 (2014). [DOI] [PMC free article] [PubMed] [Google Scholar]
- 28.Yang H, Youm YH, Vandanmagsar B, Ravussin A, Gimble JM, Greenway F, Stephens JM, Mynatt RL, Dixit VD, Obesity increases the production of proinflammatory mediators from adipose tissue T cells and compromises TCR repertoire diversity: Implications for systemic inflammation and insulin resistance. J. Immunol. 185, 1836–1845 (2010). [DOI] [PMC free article] [PubMed] [Google Scholar]
- 29.de Candia P, Prattichizzo F, Garavelli S, De Rosa V, Galgani M, Di Rella F, Spagnuolo MI, Colamatteo A, Fusco C, Micillo T, Bruzzaniti S, Ceriello A, Puca AA, Matarese G, Type 2 diabetes: How much of an autoimmune disease? Front. Endocrinol. 10, 451 (2019). [DOI] [PMC free article] [PubMed] [Google Scholar]
- 30.Galluzzi L, Yamazaki T, Kroemer G, Linking cellular stress responses to systemic homeostasis. Nat. Rev. Mol. Cell Biol. 19, 731–745 (2018). [DOI] [PubMed] [Google Scholar]
- 31.Tam CS, Viardot A, Clement K, Tordjman J, Tonks K, Greenfield JR, Campbell LV, Samocha-Bonet D, Heilbronn LK, Short-term overfeeding may induce peripheral insulin resistance without altering subcutaneous adipose tissue macrophages in humans. Diabetes 59, 2164–2170 (2010). [DOI] [PMC free article] [PubMed] [Google Scholar]
- 32.Ingalls AM, Dickie MM, Snell GD, Obese, a new mutation in the house mouse. J. Hered. 41, 317–318 (1950). [DOI] [PubMed] [Google Scholar]
- 33.Tanase M, Zolla V, Clement CC, Borghi F, Urbanska AM, Rodriguez-Navarro JA, Roda B, Zattoni A, Reschiglian P, Cuervo AM, Santambrogio L, Hydrodynamic size-based separation and characterization of protein aggregates from total cell lysates. Nat. Protoc. 10, 134–148 (2015). [DOI] [PMC free article] [PubMed] [Google Scholar]
- 34.European Association for the Study of the Liver, EASL Clinical Practice Guidelines: The diagnosis and management of patients with primary biliary cholangitis. J. Hepatol. 67, 145–172 (2017). [DOI] [PubMed] [Google Scholar]
- 35.Komurasaki R, Imaoka S, Tada N, Okada K, Nishiguchi S, Funae Y, LKM-1 sera from autoimmune hepatitis patients that recognize ERp57, carboxylesterase 1 and CYP2D6. Drug Metab. Pharmacokinet. 25, 84–92 (2010). [DOI] [PubMed] [Google Scholar]
- 36.Galluzzi L, Vitale I, Warren S, Adjemian S, Agostinis P, Martinez AB, Chan TA, Coukos G, Demaria S, Deutsch E, Draganov D, Edelson RL, Formenti SC, Fucikova J, Gabriele L, Gaipl US, Gameiro SR, Garg AD, Golden E, Han J, Harrington KJ, Hemminki A, Hodge JW, Hossain DMS, Illidge T, Karin M, Kaufman HL, Kepp O, Kroemer G, Lasarte JJ, Loi S, Lotze MT, Manic G, Merghoub T, Melcher AA, Mossman KL, Prosper F, Rekdal O, Rescigno M, Riganti C, Sistigu A, Smyth MJ, Spisek R, Stagg J, Strauss BE, Tang D, Tatsuno K, van Gool SW, Vandenabeele P, Yamazaki T, Zamarin D, Zitvogel L, Cesano A, Marincola FM, Consensus guidelines for the definition, detection and interpretation of immunogenic cell death. J. Immunother. Cancer 8, e000337 (2020). [DOI] [PMC free article] [PubMed] [Google Scholar]
- 37.Panaretakis T, Joza N, Modjtahedi N, Tesniere A, Vitale I, Durchschlag M, Fimia GM, Kepp O, Piacentini M, Froehlich KU, van Endert P, Zitvogel L, Madeo F, Kroemer G, The co-translocation of ERp57 and calreticulin determines the immunogenicity of cell death. Cell Death Differ. 15, 1499–1509 (2008). [DOI] [PubMed] [Google Scholar]
- 38.Panaretakis T, Kepp O, Brockmeier U, Tesniere A, Bjorklund AC, Chapman DC, Durchschlag M, Joza N, Pierron G, van Endert P, Yuan J, Zitvogel L, Madeo F, Williams DB, Kroemer G, Mechanisms of pre-apoptotic calreticulin exposure in immunogenic cell death. EMBO J. 28, 578–590 (2009). [DOI] [PMC free article] [PubMed] [Google Scholar]
- 39.Tacke F, Weiskirchen R, Non-alcoholic fatty liver disease (NAFLD)/non-alcoholic steatohepatitis (NASH)-related liver fibrosis: Mechanisms, treatment and prevention. Ann. Transl. Med. 9, 729 (2021). [DOI] [PMC free article] [PubMed] [Google Scholar]
- 40.Huby T, Gautier EL, Immune cell-mediated features of non-alcoholic steatohepatitis. Nat. Rev. Immunol. 22, 429–443 (2021). [DOI] [PMC free article] [PubMed] [Google Scholar]
- 41.Osborn O, Sears DD, Olefsky JM, Fat-induced inflammation unchecked. Cell Metab. 12, 553–554 (2010). [DOI] [PubMed] [Google Scholar]
- 42.Leuschner F, Li J, Goser S, Reinhardt L, Ottl R, Bride P, Zehelein J, Pfitzer G, Remppis A, Giannitsis E, Katus HA, Kaya Z, Absence of auto-antibodies against cardiac troponin I predicts improvement of left ventricular function after acute myocardial infarction. Eur. Heart J. 29, 1949–1955 (2008). [DOI] [PubMed] [Google Scholar]
- 43.Karthikeyan G, Teo KK, Islam S, McQueen MJ, Pais P, Wang X, Sato H, Lang CC, Sitthi-Amorn C, Pandey MR, Kazmi K, Sanderson JE, Yusuf S, Lipid profile, plasma apolipoproteins, and risk of a first myocardial infarction among Asians: An analysis from the INTERHEART Study. J. Am. Coll. Cardiol. 53, 244–253 (2009). [DOI] [PubMed] [Google Scholar]
- 44.Heltai K, Kis Z, Burian K, Endresz V, Veres A, Ludwig E, Gonczol E, Valyi-Nagy I, Elevated antibody levels against Chlamydia pneumoniae, human HSP60 and mycobacterial HSP65 are independent risk factors in myocardial infarction and ischaemic heart disease. Atherosclerosis 173, 339–346 (2004). [DOI] [PubMed] [Google Scholar]
- 45.Galluzzi L, Buque A, Kepp O, Zitvogel L, Kroemer G, Immunogenic cell death in cancer and infectious disease. Nat. Rev. Immunol. 17, 97–111 (2017). [DOI] [PubMed] [Google Scholar]
- 46.Chng MH, Alonso MN, Barnes SE, Nguyen KD, Engleman EG, Adaptive immunity and antigen-specific activation in obesity-associated insulin resistance. Mediators Inflamm. 2015, 593075 (2015). [DOI] [PMC free article] [PubMed] [Google Scholar]
- 47.Lindor KD, Bowlus CL, Boyer J, Levy C, Mayo M, Primary biliary cholangitis: 2018 practice guidance from the American association for the study of liver diseases. Hepatology 69, 394–419 (2019). [DOI] [PubMed] [Google Scholar]
- 48.Mack CL, Adams D, Assis DN, Kerkar N, Manns MP, Mayo MJ, Vierling JM, Alsawas M, Murad MH, Czaja AJ, Diagnosis and management of autoimmune hepatitis in adults and children: 2019 practice guidance and guidelines from the american association for the study of liver diseases. Hepatology 72, 671–722 (2020). [DOI] [PubMed] [Google Scholar]
- 49.European Association for the Study of the Liver, EASL clinical practice guidelines: Autoimmune hepatitis. J. Hepatol. 63, 971–1004 (2015). [DOI] [PubMed] [Google Scholar]
- 50.Clement CC, Becerra A, Yin L, Zolla V, Huang L, Merlin S, Follenzi A, Shaffer SA, Stern LJ, Santambrogio L, The dendritic cell major histocompatibility complex II (MHC II) peptidome derives from a variety of processing pathways and includes peptides with a broad spectrum of HLA-DM sensitivity. J. Biol. Chem. 291, 5576–5595 (2016). [DOI] [PMC free article] [PubMed] [Google Scholar]
- 51.Clement CC, Nanaware PP, Yamazaki T, Negroni MP, Ramesh K, Morozova K, Thangaswamy S, Graves A, Kim HJ, Li TW, Vigano M, Soni RK, Gadina M, Tse HY, Galluzzi L, Roche PA, Denzin LK, Stern LJ, Santambrogio L, Pleiotropic consequences of metabolic stress for the major histocompatibility complex class II molecule antigen processing and presentation machinery. Immunity 54, 721–736.e10 (2021). [DOI] [PMC free article] [PubMed] [Google Scholar]
Associated Data
This section collects any data citations, data availability statements, or supplementary materials included in this article.
Supplementary Materials
Data Availability Statement
Proteomic and eluted peptidome data that support the findings of this study have been deposited in the PRIDE database. Project name: Characterization of I-Ab MHC-II immunopeptidome eluted from control, obese (Ob/Ob), and HFHF mice (51). Project accession: PXD023581, PXD018783, and PXD024239. Additional DIA data for the total proteomes from DCs of B6 and HFHF mice were deposited at the PRIDE database with the Proteome Xchange accession number PXD026190. The I-Ab–eluted immunopeptidome from the same sample set was deposited with the accession number PXD026068.