

Summary
Background:
Retrospective studies report that visualisation of the liver may be severely limited using ultrasound (US), potentially contributing to diminished sensitivity for detection of hepatocellular carcinoma (HCC) among patients with nonalcoholic fatty liver disease (NAFLD) and cirrhosis, but there are limited prospective data.
Aims:
To compare liver visualisation scores prospectively for US and abbreviated hepatobiliary phase (HBP) magnetic resonance imaging (AMRI) in a cohort of participants with NAFLD cirrhosis and a clinical indication for HCC surveillance.
Methods:
This prospective multicenter study included 54 consecutive participants (67% women) with NAFLD cirrhosis who underwent contemporaneous US as well as HBP-AMRI with gadoxetic acid. Primary outcome was the proportion of imaging examinations with severe limitations in liver visualisation (visualisation score C) compared head-to-head between US and AMRI.
Results:
The mean (± standard deviation) age was 63.3 years (±8.4) and body mass index was 32.0 kg/m2 (±6.0). Nineteen participants (35%) had severe visualisation limitations on US, compared with 10 (19%) with AMRI, p < 0.0001. Nine (17%) participants had <90% of the liver visualised on US, compared with only 1 (2%) participant with AMRI, p < 0.0001. Obesity was a strong and independent predictor for severe visualisation limitation on US (OR 5.1, CI 1.1–23.1, p = 0.03), after adjustment for age, sex and ethnicity.
Conclusion:
More than one-third of participants with NAFLD cirrhosis had severe visualisation limitations on US for HCC screening, compared with one-sixth on AMRI. US adequacy should be reported in all clinical studies and when suboptimal then AMRI may be considered for HCC screening.
1 |. INTRODUCTION
One-quarter of the global population has nonalcoholic fatty liver disease (NAFLD).1 NAFLD encompasses nonalcoholic fatty liver and nonalcoholic steatohepatitis (NASH), which is the inflammatory form of NAFLD that can progress to cirrhosis and hepatocellular carcinoma (HCC).2,3 Within the U.S., NAFLD-related HCC is the fastest-growing cause of HCC, and its incidence is projected to increase by more than 120% in the next decade, compounded by the lack of effective therapies for NASH.4–7 Worryingly, NAFLD-related HCC tends to be diagnosed at a later stage and may be associated with worse survival compared with viral-associated HCC.8
To reduce mortality associated with HCC, major society guidelines recommend that patients with cirrhosis should undergo surveillance using ultrasound (US) every 6 months with the aim of detecting HCC at an early stage to facilitate curative therapy.9–12 This recommendation is based in part on a prospective randomised clinical trial performed in an at-risk population in Shanghai, China, which found that surveillance with US and alpha-fetoprotein every 6 months reduced HCC mortality by 37%.13 However, most participants in this Shanghai study did not have cirrhosis or obesity, hence it is unclear if these findings can be applied to patients with NAFLD cirrhosis, in whom body habitus and heterogeneous hepatic echotexture might limit liver visualisation.14 A meta-analysis of 32 studies determined that the sensitivity of US for early stage (defined as within the Milan criteria) HCC among patients with cirrhosis was only 47%.15 Multiple retrospective studies have highlighted that patients with NAFLD cirrhosis, and those with obesity are at higher risk for inadequate visualisation on US surveillance compared those with cirrhosis from other etiologies of liver disease.16–18
A promising alternative method for HCC surveillance in NAFLD cirrhosis is hepatobiliary phase (HBP)-abbreviated gadoxetate-enhanced magnetic resonance imaging (referred to hereafter as AMRI). Utilising only a small set of images (T1-weighted images, T2-weighted images, plus/minus diffusion-weighted imaging) acquired during the HBP, this method comprises about a third of the sequences typically performed in a full diagnostic liver MRI.19 Several simulated retrospective studies have suggested that AMRI provides adequate liver visualisation more frequently than US, but a prospective, head-to-head comparative study is lacking.17,20–24 The purpose of this multicenter prospective study was to compare visualisation quality between US versus AMRI performed head-to-head for HCC screening among well-characterized participants with NAFLD cirrhosis. Metrics of visualisation quality included visualisation score and Liver entirety index.
2 |. METHODS
2.1 |. Study design
This is a longitudinal multicenter prospective study derived from a well-characterized cohort with NAFLD cirrhosis. This study included 54 consecutive well-phenotyped patients recruited from the Naval Medical Center San Diego and the University of California, San Diego (UCSD) who underwent detailed standardised research visits that included history, physical examination, biochemical validation, transient elastography, US and advanced imaging at the NAFLD Research Center, UCSD and Naval Medical Center San Diego from February 2019 through July 2021. NAFLD was assessed and quantified by MRI-estimated proton density fat fraction (PDFF), while fibrosis was quantified by vibration controlled transient elastography (VCTE) plus/minus MR-elastography (MRE). All patients completed written informed consent prior to enrollment.
2.2 |. Inclusion and exclusion criteria
Patients ≥18 years of age with NAFLD cirrhosis, a clinical indication for HCC screening/surveillance, and written informed consent were included. NAFLD was defined by a known history of NAFLD based on either histology or imaging, after exclusion of other etiologies of liver diseases and secondary causes for steatosis based upon AASLD Practice Guidance.25 The current study is part of a larger ongoing study (NCT04288323) which aims to evaluate the diagnostic performance of AMRI versus US among participants with a clinical indication for HCC surveillance including hepatitis B and cirrhosis due to all etiologies. Cirrhosis was defined based on histology or imaging evidence of cirrhosis via ultrasound, computed tomography (CT) or MRI, including: left and caudate lobe enlargement with right lobe shrinkage, gallbladder fossa expansion, blunt liver edge, irregular or nodular liver surface; presence of portal hypertension, along with associated features including reversal of portal flow, splenomegaly, splenic vein dilation and ascites.26,27
Participants meeting any of the following criteria were excluded from the study: significant alcohol consumption (≥14 drinks/week for men or ≥7 drinks/week for women) within the previous 2-year period; known hepatocellular carcinoma prior to enrollment; clinical or laboratory evidence of secondary causes associated with hepatic steatosis including nutritional disorders, HIV infection and use of steatogenic drugs such as amiodarone, glucocorticoids, methotrexate, l-asparaginase and valproic acid; active substance use; underlying liver disease other than NAFLD such as viral hepatitis (assessed with serum hepatitis B surface antigen and hepatitis C RNA assays), hemochromatosis, Wilson’s disease, alpha-1 antitrypsin deficiency, glycogen storage disease, autoimmune hepatitis and cholestatic or vascular liver disease; any contraindications to MRI including metallic implants, claustrophobia and body circumference exceeding the imaging chamber capacity; known allergy to any gadolinium agent; bilirubin >3 mg/dl; known or suspected nephrogenic systemic sclerosis; serum creatinine >1.5 gm/dl if diabetic, or >2 gm/dl if not diabetic within 6 weeks prior to AMRI; eGFR measurement <30 within 6 weeks prior to AMRI; pregnancy.
2.3 |. Clinical research evaluation visit
All participants underwent a standardised clinical evaluation at baseline, including a detailed history, anthropometric exam and laboratory investigations at the UCSD NAFLD Research Center. A trained clinical investigator documented information including age, sex, height, weight, BMI and ethnicity. Alcohol intake history was verified with the Alcohol Use Disorders Identification Test and the Skinner questionnaire. Other causes of liver diseases and hepatic steatosis were ruled out based on history and laboratory tests. Participants were instructed to fast for a minimum of 8 h prior to laboratory tests and VCTE. Clinical investigators were blinded to imaging results.
2.4 |. Imaging assessment
As shown in Figure S1, enrolled participants underwent an outpatient imaging visit within 8 weeks of the clinical research visit. US and AMRI were performed either at the NAFLD Research Center, UCSD or Balboa Naval Medical Center, San Diego, respectively.
2.4.1 |. AMRI protocol
MR imaging was performed at 3T (GE Signa EXCITE HDxt, GE Healthcare, Waukesha, WI) or at 3T (Philips Ingenia 3.0T, Philips Healthcare, Best, Netherlands) (Table S1). A weight-based dose of gadoxetic acid (0.025 mmol/kg) was administered outside the scan room. About 20 min later, participants underwent an MRI exam comprising a T1-weighted (T1w) fat-suppressed 3D gradient-echo sequence in the HBP, a T2-weighted (T2w) single-shot fast spin-echo (SSFSE) sequence, and at UCSD only a diffusion-weighted imaging (DWI) sequence. Additionally, at UCSD only 2D spin-echo magnetic resonance elastography (MRE) was performed to measure liver stiffness. MRE stiffness measurements were made offline by trained analysts in the UC San Diego Liver Imaging Group.
2.4.2 |. US protocol
Two trained sonographers at each study site followed the study procedure manual and performed US exams as specified in the Liver Imaging Reporting and Data System (LI-RADS) protocol for US acquisition.28 Accordingly, sonographers attempted to visualise and capture complete cinematic sweeps of the left and right hepatic lobes in their entirety in both the sagittal and transverse planes. Representative static images of both lobes in both planes were also collected.
2.5 |. Quality of imaging exam assessment criteria
A single abdominal fellowship-trained radiologist with 5 years of post-training experience reviewed all AMRI and US examinations, blinded to all information except that the participants had chronic liver disease and that imaging was performed for HCC screening. The AMRI and US were reviewed in separate imaging sessions without cross-reference. The radiologist assigned two separate scores, defined below, for each examination.
2.5.1 |. Visualisation score
We utilised the LI-RADS visualisation scoring system for US and a similar, previously described, visualisation score for AMRI.16,19,28 Visualisation score A refers to minimal or no limitations to visualisation that are unlikely to obscure masses smaller than 1 cm, B refers to moderate limitations that may reduce detection of lesions that are smaller than 1 cm and C refers to severe limitations that may reduce detection of lesions of any size(Table S2).
2.5.2 |. Liver entirety index
To capture the proportion of the liver volume seen on the exam, we created a Liver entirety index, defined as the percentage of the liver seen on a particular imaging examination. For this sub-analysis, the score was dichotomized to ≥90% of the liver seen versus <90% of the liver seen.
2.6 |. Outcome measures
The primary outcome of this study was the proportion of exams with severe visualisation limitations (i.e., Liver Visualisation Score of C), compared head-to-head between US and AMRI.
The secondary outcome was the proportion of exams with <90% of the liver seen (i.e., Liver entirety index <90%), compared head-to-head between US and AMRI.
Descriptive statistics of participant demographic, laboratory, histological and imaging characteristics were presented at baseline and dichotomized by the presence of US visualisation score C versus A or B. Baseline categorical variables were compared with chi-square or Fisher’s exact test, and continuous variables were compared using t-test or Wilcoxon two-sample test where appropriate. Visualisation scores and dichotomized Liver entirety indices between US and AMRI were compared using the symmetry test and McNemar’s test respectively. Logistic regression analyses, unadjusted as well as adjusted for age, sex and ethnicity, were conducted to assess for the odds of severe limitations to visualisation on US in obese participants, as we hypothesised that obesity (defined as BMI ≥30 kg/m2) would be an independent predictor for inadequate visualisation on US.
Sample-size estimation was performed a priori. We hypothesised that 35% and 10% respectively of the US and AMRI scans would have severe limitations in liver visualisation, and the correlation between paired observation would be 20%. Power analysis revealed that the study would require a sample size of 43 pairs to achieve a power of 80% and a two-sided significance of 5% for detecting a difference of −0.25 between marginal proportions. Therefore, we had adequate power to detect a difference in the proportion of severely limited exams between US and AMRI.
Statistical significance was defined as a two-tailed P-value of ≤0.05. All statistical analyses were performed on SAS, version 9.4 (SAS Institute, Cary, North Carolina).
3 |. RESULTS
3.1 |. Characteristics of the study population
A total of 54 consecutive participants with NAFLD cirrhosis who underwent contemporaneous US and AMRI were included (Figure S1). Mean age (±SD) was 63.3 years (±8.4) and the mean body mass index (BMI) (±SD) was 32.0 kg/m2 (±5.9). 67% were female, 47% were Hispanic, 59% were diabetic (Table 1). The mean platelet count (SD) was 148.8 (±76.5) and the mean MELD score was 6.5 (±4.1). The baseline mean (±SD) MRE value was 5.4 kPA (±2.1) and mean (±SD) vibration controlled transient elastography (VCTE) value was 18.7 (±12.2).
TABLE 1.
Baseline characteristics of participants with NAFLD cirrhosis, stratified by Ultrasound visualisation score
| Overall (N = 54) | US Visualisation Score A/B ≤ Moderate Limitations (N = 35) | US Visualisation Score C Severe Limitations (N = 19) | p-value* | |
|---|---|---|---|---|
| Demographic profile | ||||
| Age (yr) | 63.3 (8.4) | 63.3 (8.3) | 63.3 (8.3) | 0.9832 |
| Female, n (%) | 36 (66.7%) | 23 (65.7%) | 13 (68.4%) | 0.8403 |
| Diabetes Mellitus, n (%) | 32 (59.3%) | 20 (57.1%) | 12 (63.2%) | 0.6675 |
| BMI (kg/m2) | 32.0 (6.0) | 30.9 (5.5) | 34.1 (6.5) | 0.0595 |
| Obese†, n (%) | 31 (57.4%) | 17 (48.6%) | 14 (73.7%) | 0.0747 |
| Race, n (%) | 0.4724 | |||
| White | 21 (39.6%) | 16 (45.7%) | 5 (27.8%) | |
| Hispanic | 25 (47.2%) | 15 (42.9%) | 10 (55.6%) | |
| African American | 1 (1.9%) | 1 (2.9%) | 0 | |
| Asian | 5 (9.4%) | 2 (5.7%) | 3 (16.7%) | |
| Hawaiian or Pac Islander | 1 (1.9%) | 1 (2.9%) | 0 | |
| Biochemical data | ||||
| AST (u/L) | 46.0 (24.9) | 43.5 (19.7) | 50.5 (32.6) | 0.5228 |
| ALT (u/L) | 40.8 (25.2) | 42.2 (27.4) | 38.1 (21) | 0.6983 |
| Platelet count (1000/mm3) | 148.8 (76.5) | 170.0 (84.0) | 112.1 (42.2) | 0.0087 |
| Hgb A1c (%) | 8.2 (12.5) | 6.5 (1.4) | 11.1 (21.1) | 0.8076 |
| Total Bilirubin (mg/dl) | 1.1 (1.2) | 0.9 (0.7) | 1.3 (1.9) | 0.2819 |
| Direct Bilirubin (mg/dl) | 0.4 (0.7) | 0.3 (0.4) | 0.5 (1.1) | 0.2219 |
| INR | 1.2 (0.2) | 1.2 (0.1) | 1.3 (0.3) | 0.0382 |
| Albumin (g/dl) | 4.2 (0.5) | 4.4 (0.4) | 3.9 (0.6) | 0.0046 |
| MELD | 6.5 (4.1) | 5.8 (3.4) | 8.1 (6.1) | 0.1453 |
| FIB-4 | 4.0 (2.6) | 3.2 (2.0) | 5.2 (3.0) | 0.0032 |
| Imaging results | ||||
| MRI-PDFF (%)‡ n = 50 | 8.9 (8.1) | 10.9 (9.0) | 4.8 (3.0) | 0.0018 |
| MRE (kPa)§ n = 42 | 5.4 (2.1) | 5.2 (2.3) | 5.9 (1.6) | 0.1046 |
| VCTE (kPa) n = 50 | 18.7 (12.2) | 17.1 (13.5) | 22.1 (8.1) | 0.0258 |
| CAP (dB/m) n = 50 | 269.6 (70.0) | 270.2 (75.9) | 268.2 (57.9) | 0.5560 |
| Tumour markers | ||||
| AFP (ng/ml) n = 34 | 4.6 (4.3) | 4.1 (1.9) | 5.2 (6.2) | 0.9725 |
| AFP-L3 (%) n = 48 | 3.9 (4.5) | 3.9 (4.8) | 3.9 (4.2) | 0.8510 |
| DCP (mAu/ml) n = 53 | 0.9 (1.5) | 0.8 (1.6) | 0.9 (1.4) | 0.5659 |
Note: Mean values are provided with SD in parenthesis unless otherwise noted as n (%).
Abbreviations: AFP, alpha-fetoprotein; ALT, alanine transaminase; AST, aspartate transaminase; CAP, controlled attenuation parameter; DCP, Des-gamma-carboxy prothrombin; FIB-4, fibrosis-4 score; MELD, Model For End-Stage Liver Disease; MRE, magnetic resonance elastography; MRI-PDFF, magnetic resonance imaging – proton density fat fraction; plt, platelet count; SD, standard deviation; US, ultrasound; VCTE, vibration controlled transient elastography; yr, year.
Categorical variables tested with chi square or Fisher's exact test as appropriate.
Continuous variables were compared using t-test or Wilcoxon two-sample test as appropriate.
p-value <0.05 is deemed significant, boldface indicates significant p values.
Obese was defined as BMI ≥30 kg/m2.
MRI-PDFF was measured as per following manuscript: Loomba R et al. Hepatology. 2015;61(4):1239–1250.
MRE was measured as per following manuscript: Loomba R et al. Hepatology. 2014;60(6):1920–1928.
3.2 |. Primary outcome: Severe visualisation limitations of US versus AMRI
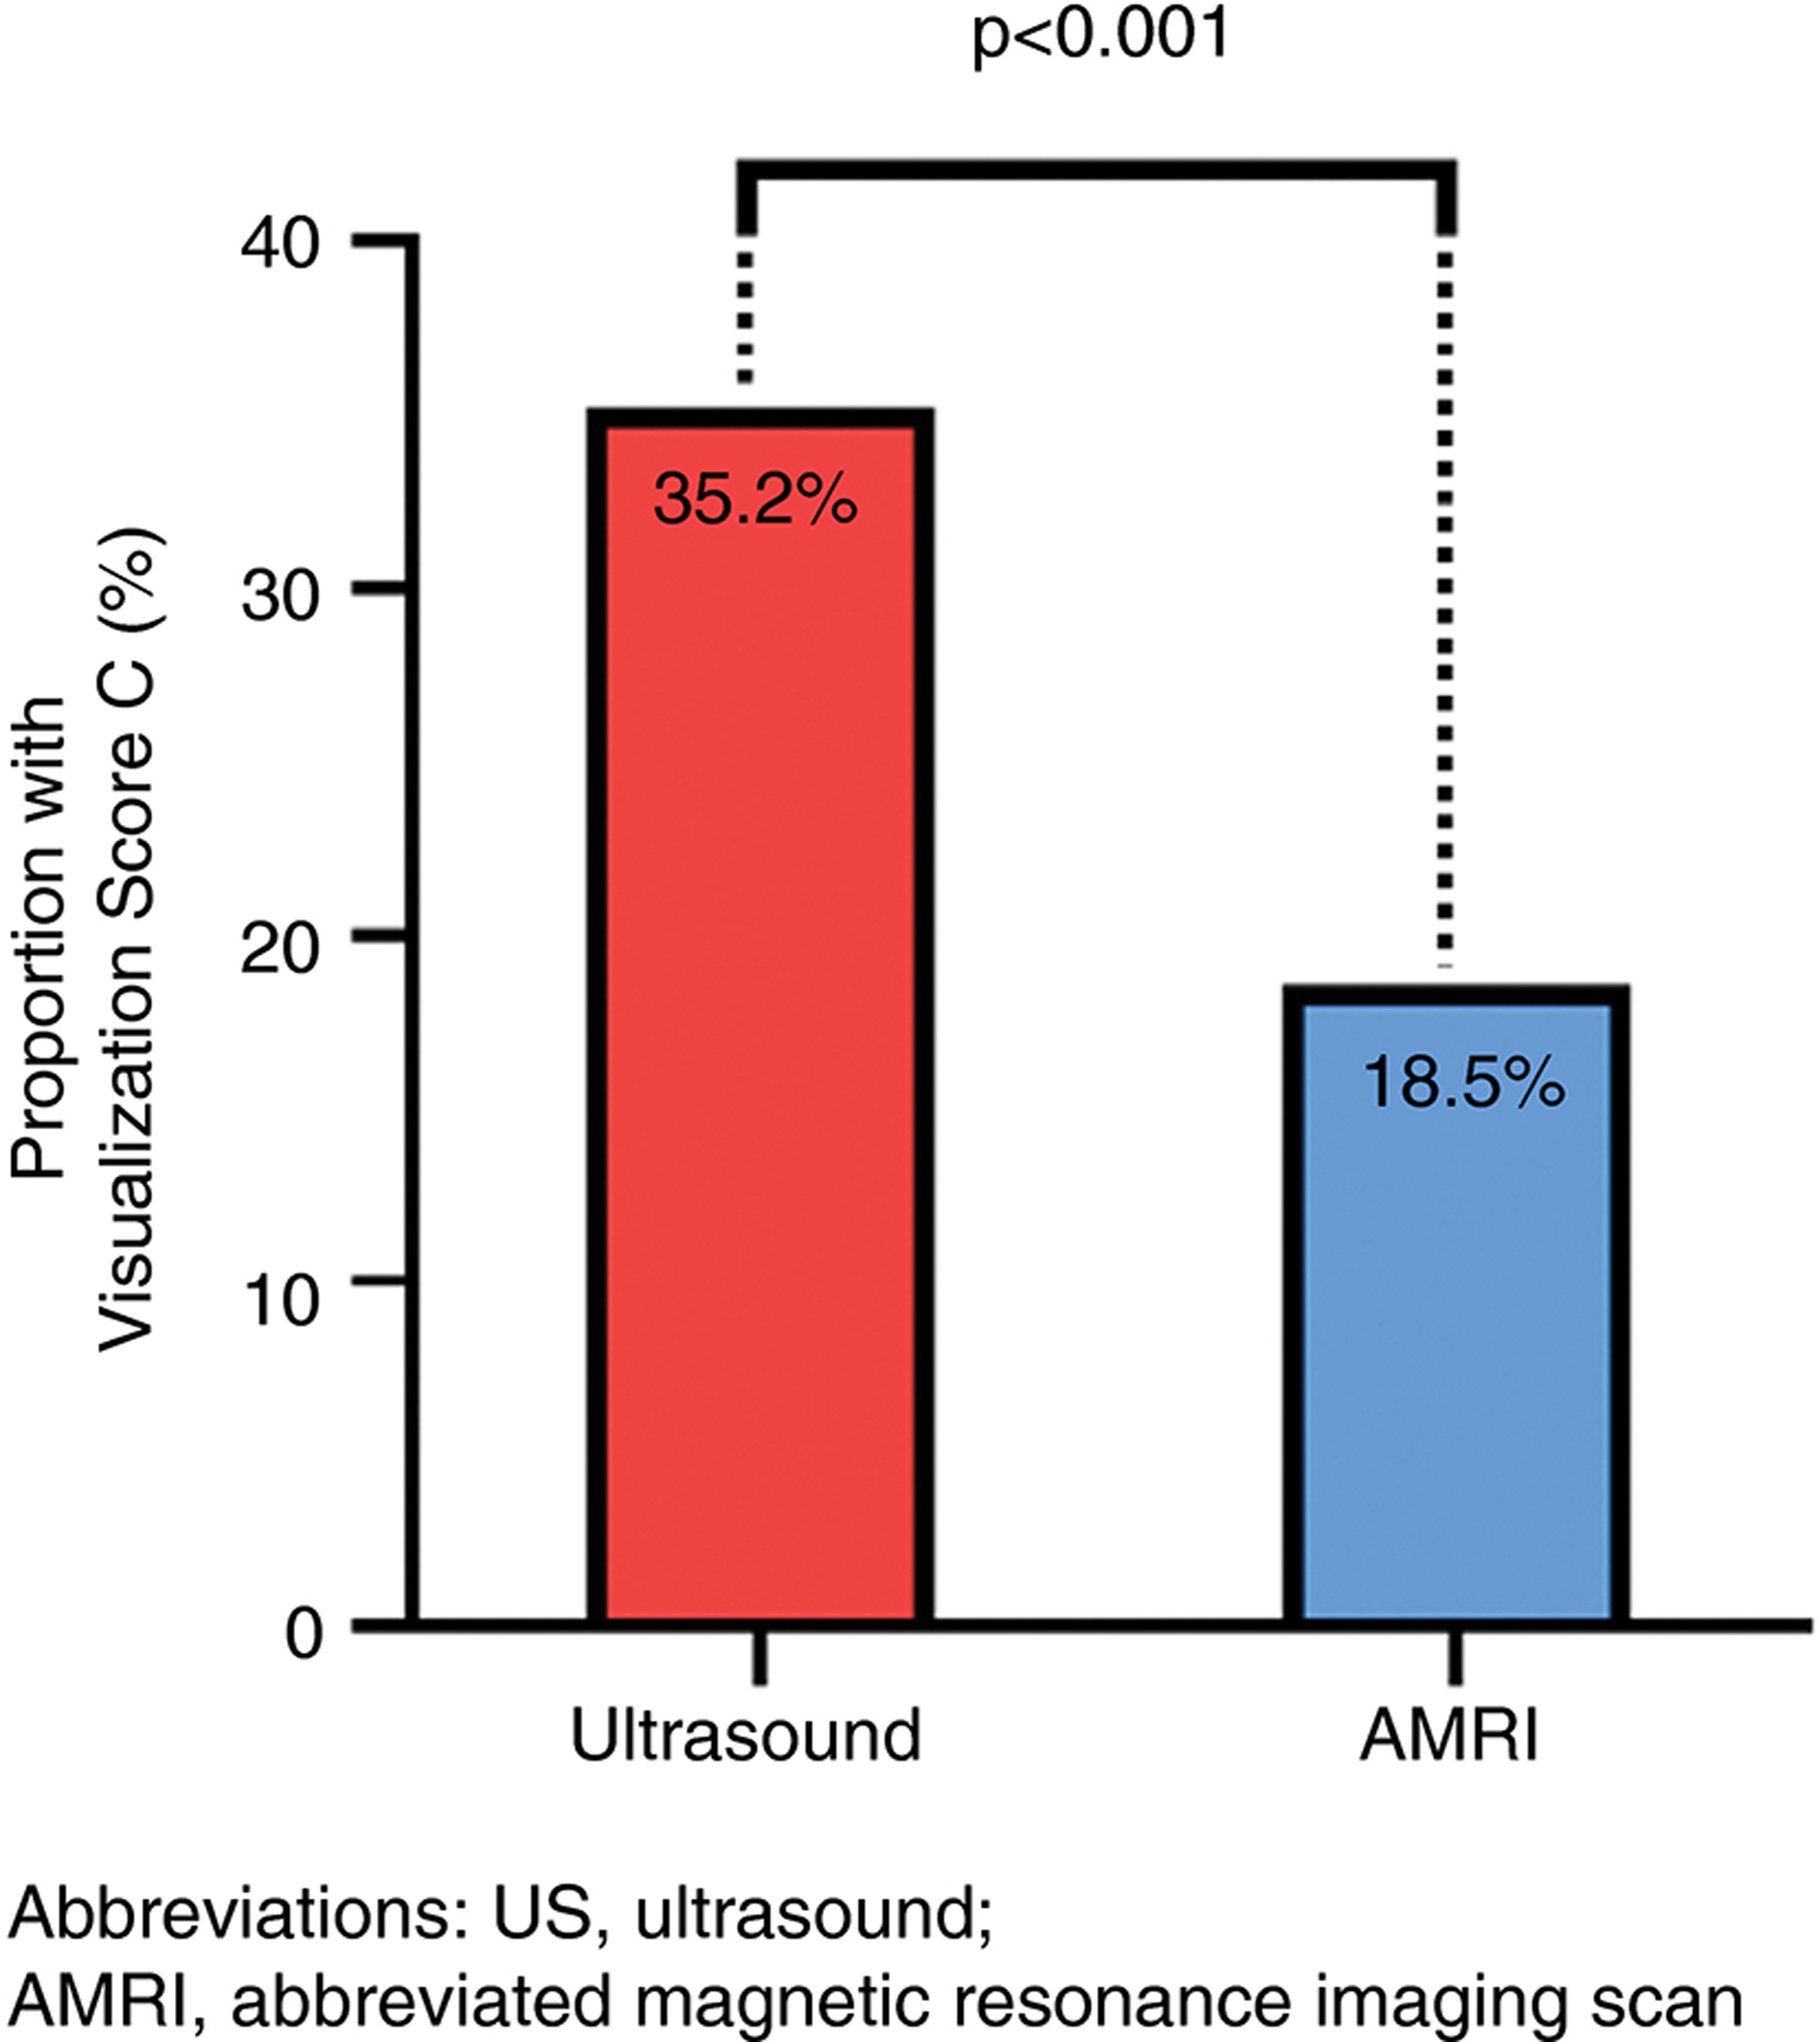
The proportion of participants with severe visualisation limitations (visualisation score of C) was higher on US than AMRI, 35% versus 19%, p < 0.0001 (Figure 1). The number (%) of participants with Visualisation scores A, B and C on US was 1 (2%), 34 (63%) and 19 (35%), and on AMRI was 22 (41%), 22 (41%) and 10 (19%), p < 0.0001, respectively (Table S3). Among the 19 patients with severe visualisation limitations on US, only 5 patients (26%) had severe visualisation limitations on AMRI. In contrast, out of 10 patients with severe visualisation limitations on AMRI, 5 patients (50%) also had severe visualisation limitations on US. Participants with severe visualisation limitations on US had more advanced liver disease, as evidenced by a lower platelet count (112 vs. 170, p = 0.009), higher INR (1.3 vs. 1.2, p = 0.04), lower albumin (3.9 g/dl vs. 4.4 g/dl, p = 0.005) and higher VCTE value (22.1 kPA vs. 17.1 kPA, p = 0.03) when compared with those without severe visualisation limitations (Table 1). Other demographic factors such as age, gender, BMI and baseline level of tumour markers were similar in both groups.
FIGURE 1.
Severe visualisation limitations on US versus AMRI in NAFLD cirrhosis
Participants with severe visualisation limitations on AMRI had more advanced liver disease versus participants without severe visualisation limitations, with a higher MELD, lower platelet count and higher MRE values (Table S4).
3.3 |. Liver entirety index on US versus AMRI
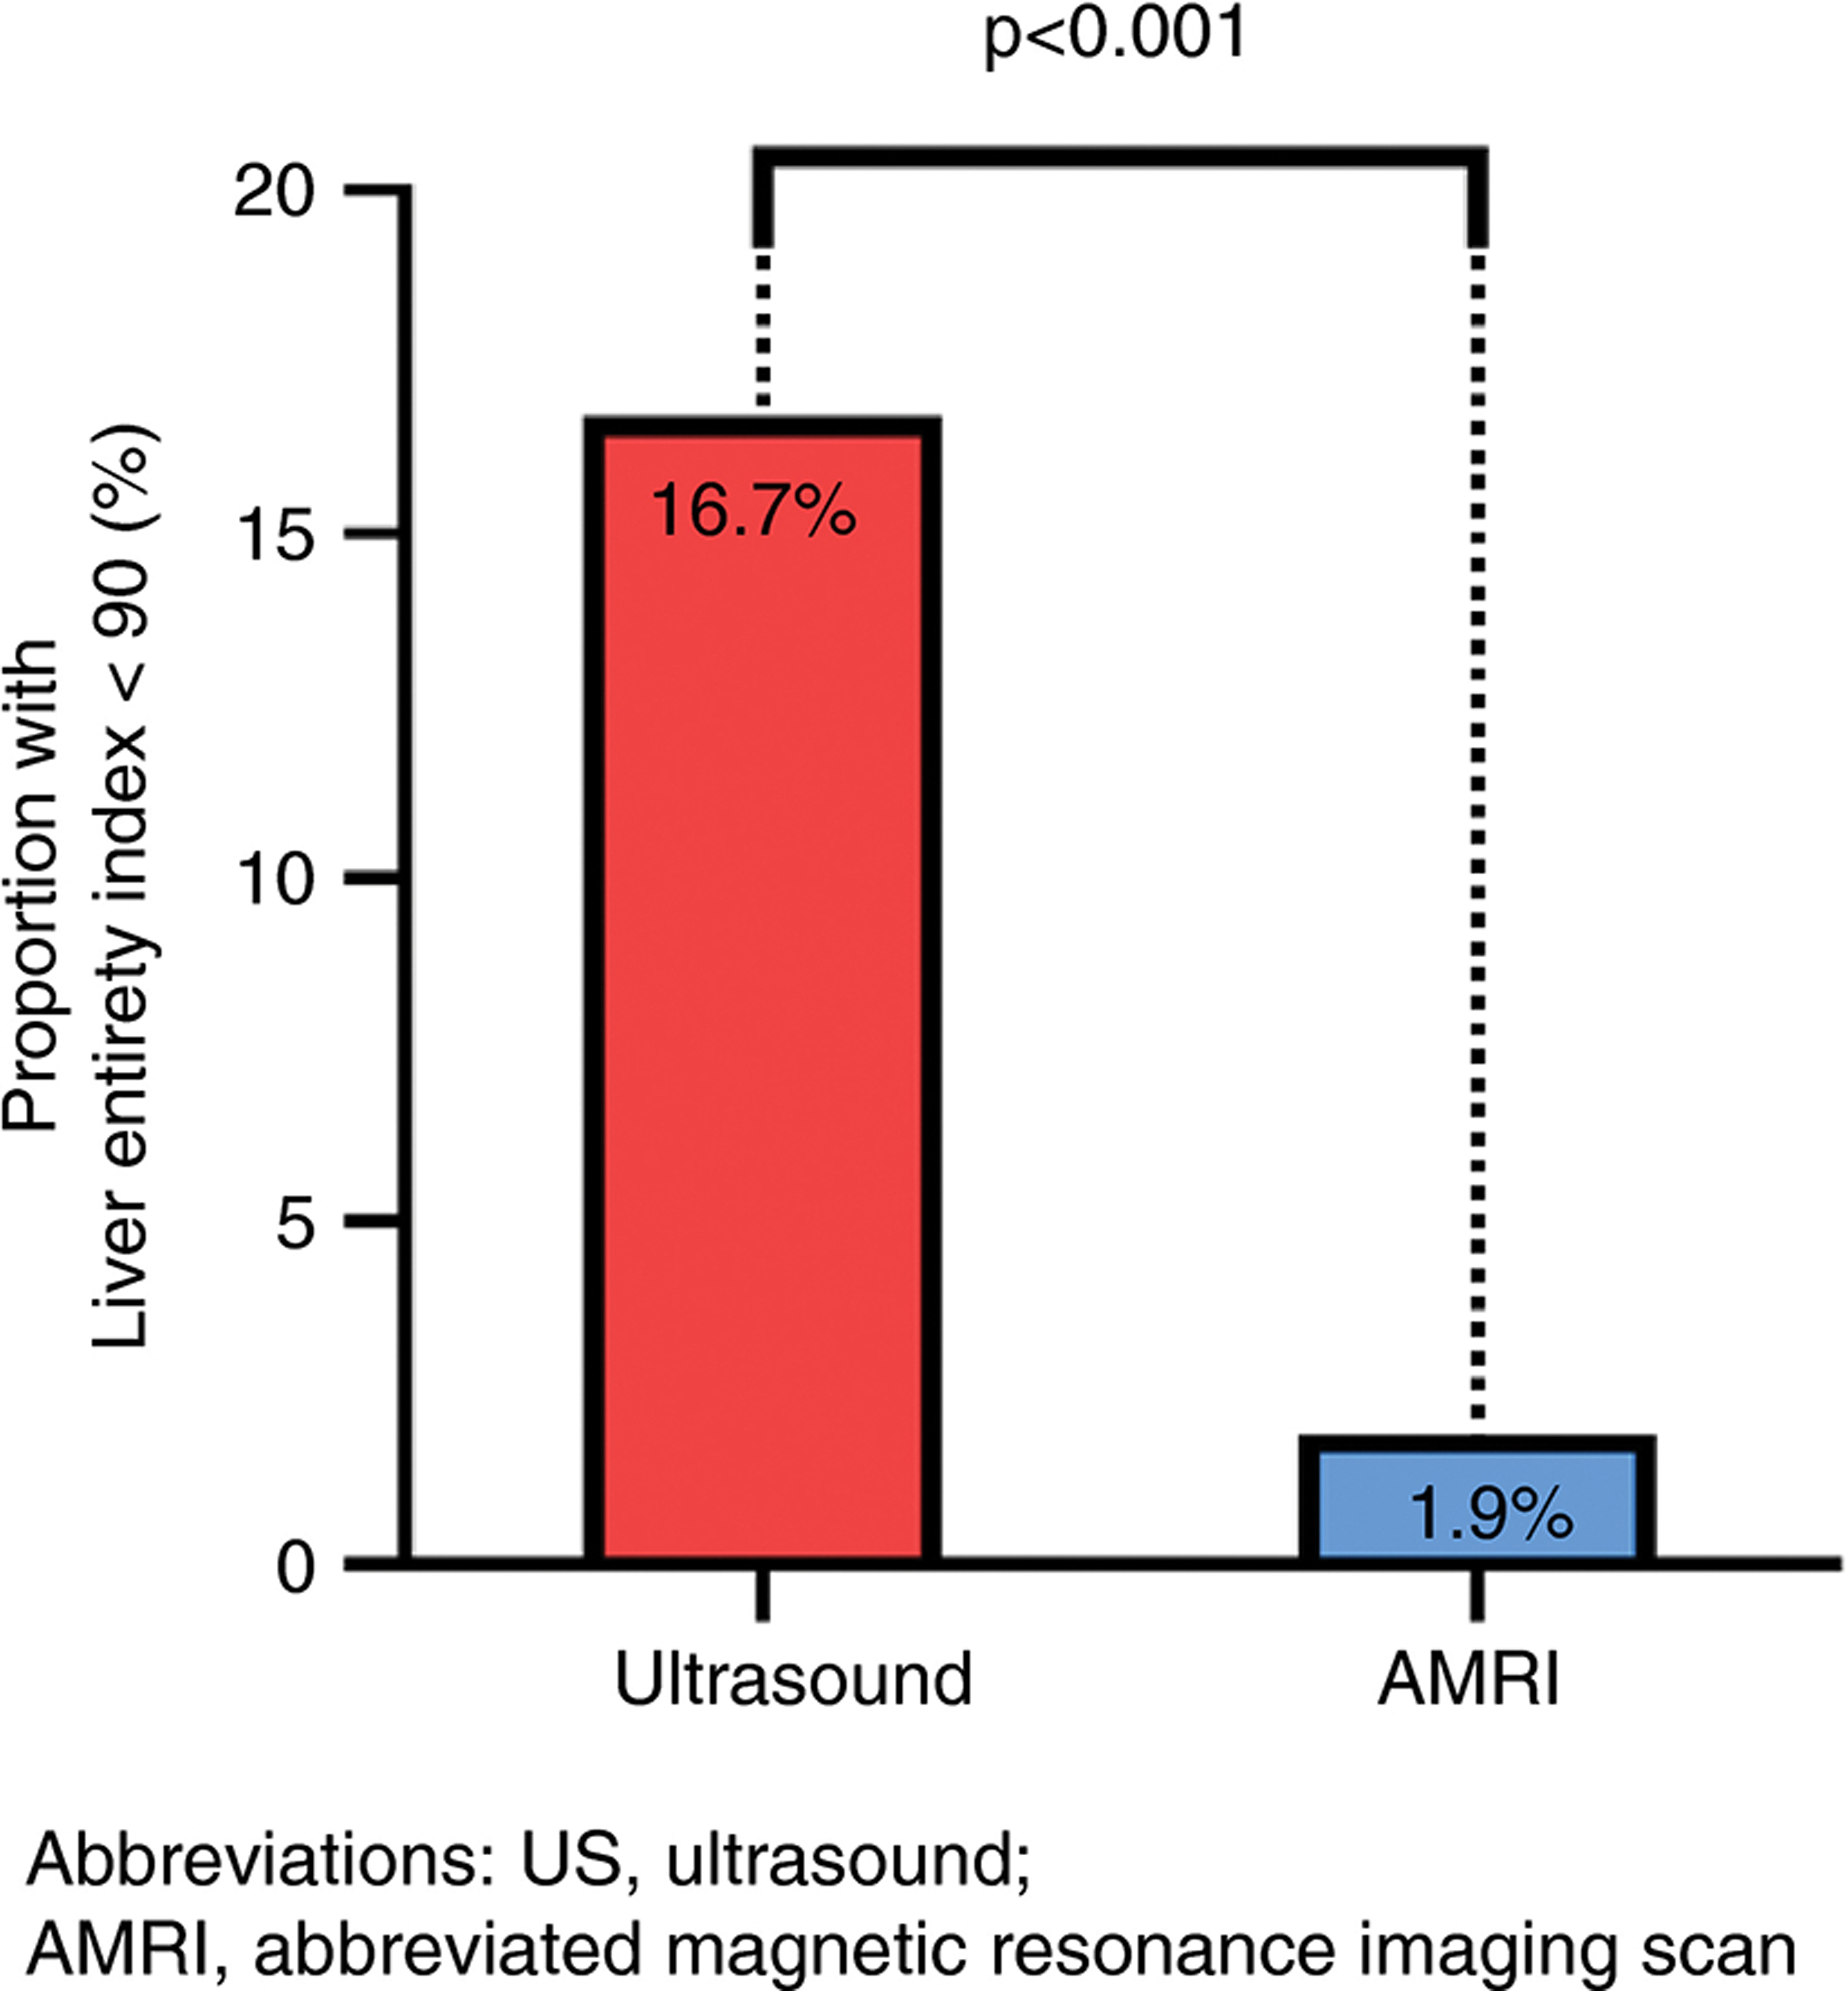
The proportion of participants with Liver entirety index <90% on US versus AMRI was 17% (9/54) versus 2% (2/54), p < 0.0001 (Figure 2 and Table S5). Baseline demographics, laboratory data, imaging results and tumour markers between participants with a Liver entirety index <90% versus ≥90% on US were similar (Table S6).
FIGURE 2.
Liver entirety index <90% on US versus AMRI in NAFLD cirrhosis
3.4 |. Sensitivity analysis
Among NAFLD cirrhosis participants with obesity, 14 out of 31 participants (45%) had severe limitations to visualisation on US, compared to 5 out of 23 (22%) of participants without obesity, p = 0.07. By contrast, only 23% of obese participants had severe limitations to visualisation on AMRI versus 45% on US, p = 0.07. Obesity was a strong and independent predictor for severe limitations to visualisation on US (adjusted OR 5.10, CI 1.12–23.13, p = 0.03) after adjustment for age, sex and ethnicity (Table 2). MELD score was not a significant predictor for severe limitations to visualisation on US (OR 1.13, CI 0.97–1.32). Obesity was not an independent predictor for severe visualisation limitations on AMRI (adjusted OR 2.14, CI 0.39–11.70, p = 0.38) (Table S7).
TABLE 2.
Univariable and multivariable predictors of severe visualisation limitations on Ultrasound
| Univariable |
Multivariable |
|||
|---|---|---|---|---|
| OR (95% CI) | p-value | OR (95% CI) | p-value* | |
| Age | 0.999 (0.935–1.068) | 0.9828 | 1.023 (0.950–1.101) | 0.5449 |
| Female | 1.130 (0.343–3.726) | 0.8403 | 1.401 (0.358–5.489) | 0.6286 |
| Hispanic | 1.667 (0.530–5.241) | 0.3822 | 2.862 (0.747–10.959) | 0.1248 |
| Obese (BMI ≥30 kg/m2) | 2.965 (0.878–10.016) | 0.0802 | 5.100 (1.124–23.134) | 0.0347 |
Abbreviation: BMI, body mass index.
p-value <0.05 is deemed significant, boldface indicates significant p values.
4 |. DISCUSSION
4.1 |. Main findings
Utilising a well-characterized cohort of patients with NAFLD cirrhosis, we demonstrate that AMRI is significantly better than US in providing an optimal screening assessment for HCC among patients with NAFLD cirrhosis. In this prospective, multicenter head-to-head study of US versus AMRI for HCC surveillance conducted in participants with NAFLD cirrhosis, more than a third of patients with NAFLD cirrhosis had severe visualisation limitations on US but only one-sixth had severe visualisation limitations on AMRI. In multivariable-adjusted analyses, adjusted for age, sex and ethnicity, participants with obesity were five times more likely to have severe visualisation limitations on US scan. In contrast, obesity did not predict severe visualisation limitations on AMRI. These data suggest that obese patients with NAFLD cirrhosis have a high frequency of severe visualisation limitations on US exams and should be considered for alternative strategies, such as AMRI.
4.2 |. In context with current literature
This prospective study validates findings from previous retrospective studies, which found that patients with NAFLD cirrhosis and obesity are at high risk for severe visualisation limitations with US.16–18 Recently, Schoenberger and colleagues conducted a large retrospective study of 2,053 patients with cirrhosis from two health systems in the U.S. and determined that patients with NAFLD cirrhosis had the largest proportion with severe visualisation limitations on US (35/369 [9.5%]), compared with other etiologies of liver disease.16 Our study reported even higher rates of severe visualisation limitations when using US(35%) among participants with NAFLD cirrhosis, possibly due to the high mean BMI in our study (31.8 kg/m2 versus 29.3 kg/m2 in the Schoenberger study). In addition, the images in our study were reviewed by a board-certified radiologist specifically to assess visualisation scores in contrast to the study by Schoenberger where the visualisation scores were retrospectively obtained from clinical radiology reports by variable radiologists.
A retrospective study of the hepatobiliary phase among patients with chronic liver disease who underwent HCC screening using gadoxetic MRI revealed that 15% of patients had suboptimal hepatobiliary phases29 to detect HCC. This study was conducted among patients with chronic liver disease in general and was not specific to NAFLD cirrhosis. The patient’s scans were dichotomized into only two categories: adequate or suboptimal. Our study had a higher proportion (19%) of AMRI scans with severe visualisation limitations, which is unsurprising given that all participants in our study had cirrhosis.
The four-fold novelty of this study includes prospective study design, head-to-head comparison between US and AMRI in all participants, detailed clinical phenotyping and well-characterized cohort of patients with NAFLD cirrhosis. We acknowledge the following limitations of this study. First, the study focused on patients with NAFLD cirrhosis, however, patients with other etiologies of liver disease may also have suboptimal visualisation on US, especially if they are obese. Second, the participants in this study all came from the U.S., therefore it is unclear if these findings are generalisable to patients from other countries and ethnicities. Thirdly, US assessment is operator dependent, and potential interpretation bias cannot be excluded. However, we utilised two experienced sonographers with several years of clinical experience in liver ultrasound imaging at each site to mitigate this. Fourthly, we did not specifically study the impact of visualisation on detection nor whether visualisation scores are stable longitudinally in the same patients. Finally, we did not perform the assessment for Child-Pugh score during the prospective clinical research visits, however, we utilised the MELD score as an objective indicator for the severity of cirrhosis.
4.3 |. Implications on future research
This study suggests that AMRI provides better visualisation than US, both in terms of visualisation scores and the ability to view the liver in its entirety. Larger, multicenter studies are required to validate these findings. In addition, while cost-effectiveness studies have indicated that AMRI may be cost-effective for HCC surveillance, cost-effective studies specifically comparing US versus AMRI in NAFLD cirrhosis are required.30,31
5 |. CONCLUSIONS
In summary, our prospective, multicenter head-to-head comparative efficacy study demonstrates that more than a third of patients with NAFLD cirrhosis have severe visualisation limitations on US but only one-sixth have severe visualisation limitations on AMRI. Patients with obesity are five times more likely than non-obese patients to have severe visualisation limitations on US, after adjustment for age, sex and ethnicity. Further research is needed to define the impact of visualisation limitations on diagnostic performance and to examine the potential benefits of performing alternative imaging such as AMRI when US is severely limited. US adequacy should be reported in all clinical studies for patients with NAFLD cirrhosis and when suboptimal then AMRI may be considered for HCC screening.
Supplementary Material
Funding information
This study was funded by the Department of Defence Peer Reviewed Cancer Research Program (PRCRP) (W81XWH-18-2-0026).
Footnotes
CONFLICT OF INTEREST
R.L. receives funding support from NIAAA (U01AA029019), NIEHS (5P42ES010337), NCATS (5UL1TR001442), NIDDK (U01DK130190, U01DK061734, R01DK106419, P30DK120515, R01DK121378, R01DK124318), NHLBI (P01HL147835) and DOD PRCRP (W81XWH-18-2-0026). RL serves as a consultant to Aardvark Therapeutics, Altimmune, Anylam/Regeneron, Amgen, Arrowhead Pharmaceuticals, AstraZeneca, Bristol-Myer Squibb, CohBar, Eli Lilly, Galmed, Gilead, Glympse bio, Hightide, Inipharma, Intercept, Inventiva, Ionis, Janssen Inc., Madrigal, Metacrine, Inc., NGM Biopharmaceuticals, Novartis, Novo Nordisk, Merck, Pfizer, Sagimet, Theratechnologies, 89 bio, Terns Pharmaceuticals and Viking Therapeutics. In addition, his institutions received research grants from Arrowhead Pharmaceuticals, Astrazeneca, Boehringer-Ingelheim, Bristol-Myers Squibb, Eli Lilly, Galectin Therapeutics, Galmed Pharmaceuticals, Gilead, Intercept, Hanmi, Intercept, Inventiva, Ionis, Janssen, Madrigal Pharmaceuticals, Merck, NGM Biopharmaceuticals, Novo Nordisk, Merck, Pfizer, Sonic Incytes and Terns Pharmaceuticals. Co-founder of LipoNexus Inc.
D.H. receives funding support from Singapore Ministry of Health’s National Medical Research Council under its NMRC Research Training Fellowship (MOH-000595-01). In addition, he has served as an advisory board member for Eisai.
R.M.M. receives funding support from DoD PRCRP (W81XWH-18-2-0024). The views expressed in this article are those of the author and do not necessarily reflect the official policy or position of the Department of the Navy, Department of Defence or the U.S. Government. RMM is a military service member. This work was prepared as part of his official duty. Title 17, USC, x105 provides that “Copyright protection under this title is not available for any work of the United States Government.” Title 17, USC, x101 defines a U.S. Government work as a work prepared by a military service member or employee of the U.S. Government as part of that person’s official duties.
Dr. Sirlin reports grants from GE, Siemens, Philips, Bayer, Gilead and Pfizer (grant is to UW-Madison; UCSD is a subcontract to UW-Madison); personal consultation fees from Blade, Boehringer and Epigenomics; consultation under the auspices of the University to AMRA, BMS, Exact Sciences, GE Digital, IBM-Watson and Pfizer; lab service agreements from Enanta, Gilead, ICON, Intercept, Nusirt, Shire, Synageva, Takeda; royalties from Wolters Kluwer for educational material outside the submitted work; honoraria to the institution from Medscape for educational material outside the submitted work; ownership of stock options in Livivos; unpaid position in advisory board to Quantix Bio.
ETHICS APPROVAL STATEMENT
This study was approved by the Institutional Review Board at the University of California at San Diego and Naval Medical Center San Diego.
PATIENT CONSENT STATEMENT
Consent was obtained from each patient.
No material was used from external sources.
SUPPORTING INFORMATION
Additional supporting information will be found online in the Supporting Information section.
DATA AVAILABILITY STATEMENT
Data are available upon reasonable request.
REFERENCES
- 1.Younossi ZM, Koenig AB, Abdelatif D, Fazel Y, Henry L, Wymer M. Global epidemiology of nonalcoholic fatty liver disease-Meta-analytic assessment of prevalence, incidence, and outcomes. Hepatology. 2016;64(1):73–84. [DOI] [PubMed] [Google Scholar]
- 2.Loomba R, Sanyal AJ. The global NAFLD epidemic. Nat Rev Gastroenterol Hepatol. 2013;10(11):686–690. [DOI] [PubMed] [Google Scholar]
- 3.Loomba R, Friedman SL, Shulman GI. Mechanisms and disease consequences of nonalcoholic fatty liver disease. Cell. 2021;184(10):2537–2564. [DOI] [PMC free article] [PubMed] [Google Scholar]
- 4.Estes C, Anstee QM, Arias-Loste MT, et al. Modeling NAFLD disease burden in China, France, Germany, Italy, Japan, Spain, United Kingdom, and United States for the period 2016–2030. J Hepatol. 2018;69(4):896–904. [DOI] [PubMed] [Google Scholar]
- 5.Huang DQ, El-Serag HB, Loomba R. Global epidemiology of NAFLD-related HCC: trends, predictions, risk factors and prevention. Nat Rev Gastroenterol Hepatol. 2021;18(4):223–228. [DOI] [PMC free article] [PubMed] [Google Scholar]
- 6.Dufour JF, Caussy C, Loomba R. Combination therapy for nonalcoholic steatohepatitis: rationale, opportunities and challenges. Gut. 2020;69(10):1877–1884. [DOI] [PMC free article] [PubMed] [Google Scholar]
- 7.Jung J, Loomba RR, Imajo K, et al. MRE combined with FIB-4 (MEFIB) index in detection of candidates for pharmacological treatment of NASH-related fibrosis. Gut. 2021;70(10):1946–1953. [DOI] [PMC free article] [PubMed] [Google Scholar]
- 8.Younossi ZM, Otgonsuren M, Henry L, et al. Association of nonalcoholic fatty liver disease (NAFLD) with hepatocellular carcinoma (HCC) in the United States from 2004 to 2009. Hepatology. 2015;62(6):1723–1730. [DOI] [PubMed] [Google Scholar]
- 9.Heimbach JK, Kulik LM, Finn RS, et al. AASLD guidelines for the treatment of hepatocellular carcinoma. Hepatology. 2018;67(1):358–380. [DOI] [PubMed] [Google Scholar]
- 10.EASL clinical practice guidelines: management of hepatocellular carcinoma. J Hepatol. 2018;69(1):182–236. [DOI] [PubMed] [Google Scholar]
- 11.Omata M, Cheng AL, Kokudo N, et al. Asia-Pacific clinical practice guidelines on the management of hepatocellular carcinoma: a 2017 update. Hepatol Int. 2017;11(4):317–370. [DOI] [PMC free article] [PubMed] [Google Scholar]
- 12.Loomba R, Lim JK, Patton H, El-Serag HB. AGA clinical practice update on screening and surveillance for hepatocellular carcinoma in patients with nonalcoholic fatty liver disease: expert review. Gastroenterology. 2020;158(6):1822–1830. [DOI] [PMC free article] [PubMed] [Google Scholar]
- 13.Zhang B-H, Yang B-H, Tang Z-Y. Randomized controlled trial of screening for hepatocellular carcinoma. J Cancer Res Clin Oncol. 2004;130(7):417–422. [DOI] [PMC free article] [PubMed] [Google Scholar]
- 14.Ward ZJ, Bleich SN, Cradock AL, et al. Projected U.S. state-level prevalence of adult obesity and severe obesity. N Engl J Med. 2019;381(25):2440–2450. [DOI] [PubMed] [Google Scholar]
- 15.Tzartzeva K, Obi J, Rich NE, et al. Surveillance imaging and alpha fetoprotein for early detection of hepatocellular carcinoma in patients with cirrhosis: a meta-analysis. Gastroenterology. 2018;154(6):1706–18.e1. [DOI] [PMC free article] [PubMed] [Google Scholar]
- 16.Schoenberger H, Chong N, Fetzer DT, et al. Dynamic changes in ultrasound quality for hepatocellular carcinoma screening in patients with cirrhosis. Clin Gastroenterol Hepatol. 2021. Epub ahead of print. [DOI] [PMC free article] [PubMed]
- 17.Simmons O, Fetzer DT, Yokoo T, et al. Predictors of adequate ultrasound quality for hepatocellular carcinoma surveillance in patients with cirrhosis. Aliment Pharmacol Ther. 2017;45(1):169–177. [DOI] [PMC free article] [PubMed] [Google Scholar]
- 18.Samoylova ML, Mehta N, Roberts JP, Yao FY. Predictors of ultrasound failure to detect hepatocellular carcinoma. Liver Transpl. 2018;24(9):1171–1177. [DOI] [PubMed] [Google Scholar]
- 19.An JY, Peña MA, Cunha GM, et al. abbreviated mri for hepatocellular carcinoma screening and surveillance. Radiographics. 2020;40(7):1916–1931. [DOI] [PMC free article] [PubMed] [Google Scholar]
- 20.Besa C, Lewis S, Pandharipande PV, et al. Hepatocellular carcinoma detection: diagnostic performance of a simulated abbreviated MRI protocol combining diffusion-weighted and T1-weighted imaging at the delayed phase post gadoxetic acid. Abdom Radiol (NY). 2017;42(1):179–190. [DOI] [PubMed] [Google Scholar]
- 21.Marks RM, Ryan A, Heba ER, et al. Diagnostic per-patient accuracy of an abbreviated hepatobiliary phase gadoxetic acid-enhanced MRI for hepatocellular carcinoma surveillance. Am J Roentgenol. 2015;204(3):527–535. [DOI] [PubMed] [Google Scholar]
- 22.Tillman BG, Gorman JD, Hru JM, et al. Diagnostic per-lesion performance of a simulated gadoxetate disodium-enhanced abbreviated MRI protocol for hepatocellular carcinoma screening. Clin Radiol. 2018;73(5):485–493. [DOI] [PubMed] [Google Scholar]
- 23.Brunsing RL, Chen DH, Schlein A, et al. Gadoxetate-enhanced abbreviated MRI for hepatocellular carcinoma surveillance: preliminary experience. Radiol Imaging Cancer. 2019;1(2):e190010. [DOI] [PMC free article] [PubMed] [Google Scholar]
- 24.Park HJ, Kim SY, Singal AG, et al. Abbreviated magnetic resonance imaging vs. ultrasound for surveillance of hepatocellular carcinoma in high-risk patients. Liver Int. 2021. Epub ahead of print. [DOI] [PubMed] [Google Scholar]
- 25.Chalasani N, Younossi Z, Lavine JE, et al. The diagnosis and management of nonalcoholic fatty liver disease: practice guidance from the American Association for the Study of Liver Diseases. Hepatology. 2018;67(1):328–357. [DOI] [PubMed] [Google Scholar]
- 26.Harbin WP, Robert NJ, Ferrucci JT Jr. Diagnosis of cirrhosis based on regional changes in hepatic morphology: a radiological and pathological analysis. Radiology. 1980;135(2):273–283. [DOI] [PubMed] [Google Scholar]
- 27.Kudo M, Zheng RQ, Kim SR, et al. Diagnostic accuracy of imaging for liver cirrhosis compared to histologically proven liver cirrhosis: a multicenter collaborative study. Intervirology. 2008;51(Suppl 1):17–26. [DOI] [PubMed] [Google Scholar]
- 28.Tang A, Singal AG, Mitchell DG, et al. Introduction to the liver imaging reporting and Data system for hepatocellular carcinoma. Clin Gastroenterol Hepatol. 2019;17(7):1228–1238. [DOI] [PubMed] [Google Scholar]
- 29.Kobi M, Paroder V, Flusberg M, Rozenblit AM, Chernyak V. Limitations of GD-EOB-DTPA-enhanced MRI: can clinical parameters predict suboptimal hepatobiliary phase? Clin Radiol. 2017;72(1):55–62. [DOI] [PubMed] [Google Scholar]
- 30.Lima PH, Fan B, Bérubé J, et al. Cost-utility analysis of imaging for surveillance and diagnosis of hepatocellular carcinoma. Am J Roentgenol. 2019;213(1):17–25. [DOI] [PubMed] [Google Scholar]
- 31.Khatri G, Pedrosa I, Ananthakrishnan L, et al. Abbreviated-protocol screening MRI vs. complete-protocol diagnostic MRI for detection of hepatocellular carcinoma in patients with cirrhosis: an equivalence study using LI-RADS v2018. J Magn Reson Imaging. 2020;51(2):415–425. [DOI] [PubMed] [Google Scholar]
Associated Data
This section collects any data citations, data availability statements, or supplementary materials included in this article.
Supplementary Materials
Data Availability Statement
Data are available upon reasonable request.