

Supplemental Digital Content is Available in the Text.
A high pain score ((V) numeric rating scale [NRS] ≥ 7) at discharge from the emergency department may increase the risk of developing chronic pain, which can be predicted and prevented.
Keywords: Chronic pain, Acute pain, Pain severity, Predictor, Emergency department, Pain management
Abstract
Introduction:
Inadequate pain management remains a problem in the emergency department (ED) and might increase the risk of chronic pain. Previous studies suggested that pain intensity is associated with pain chronification in specific patient groups. This study aims to study the association between pain intensity {[verbal] numeric rating scale ([V]NRS) ≥ 7} at discharge from the ED and pain chronification in the general population.
Objective:
To assess whether a high pain score at discharge from the ED increases the risk of chronic pain development.
Methods:
Adults who visited the ED with pain as their main complaint, and who were not hospitalized, were eligible for inclusion. Chronic pain was defined as pain with an (V)NRS score ≥1 90 days after the ED visit and with a similar location to the acute pain.
Results:
We included 1906 patients, of whom 825 participants completed 90 days of follow-up. Approximately 34.1% left the ED with an (V)NRS score ≥7, and 67.8% reported an (V)NRS score of ≥1 90 at days. Of all patients leaving the ED with an (V)NRS score ≥7, 76.5% developed chronic pain vs 63.2% of patients with (V)NRS score <7 (P < 0.01). After correction, this difference was borderline statistically significant with an odds ratio of 1.45 (95% confidence interval: 0.99–2.13, P = 0.054). Various sensitivity analyses using a different (V)NRS at discharge and different definitions of chronic pain at 90 days showed a significant difference in the chronification of pain.
Conclusion:
This study suggests that pain intensity at discharge from the ED, regardless of the localization or cause of pain, increased the risk of developing chronic pain. By distinguishing patients at risk and providing an effective treatment, chronic pain and the associated burden of disease might be preventable.
1. Introduction
Pain is the most common complaint of patients presenting to emergency departments (EDs).3,5,9,27 Approximately half of these patients are discharged after evaluation, diagnosis, and treatment.9 Insufficient pain management remains a problem in ED.3,8,27,35 Inadequate pain management might increase the risk of developing chronic pain.14,21,25
While there is no consensus on the definition, generally, chronic pain is defined as pain persisting for 3 months or more.13,21,25,31 Development of chronic pain is associated with a large socioeconomic burden of disease with an estimated prevalence of 18% in 2010 in the Netherlands.2,4,10 Given the many physical and socioeconomic consequences and influence on quality of life, the European Pain Federation (EFIC) declared that chronic pain could be viewed as a disease itself, instead of a symptom leading to overutilization of the healthcare system.4,10,17,19 Furthermore, it causes loss of productivity, increased absenteeism, opiate abuse, and/or addiction, and decreased activities of daily living (ADL), mental health, and quality of life.2,4,10,17,22
Multiple factors might influence the development of chronic pain. Besides pain management, other factors such as high pain scores on ED presentation and ED departure were associated with chronic pain.13,21,34 Some studies concluded that postinjury pain severity was associated with chronic pain, although they only included the initial pain severity as a potential predictor.7,13 Others concluded that a high pain score on discharge from the ED also correlated with pain chronification.21,34 Previous studies included only specific patient groups. Whether these conclusions can be generalized to the entire population is unclear. (Verbal) numeric rating scale (V)NRS on ED presentation is not easily influenced but health care providers might influence (V)NRS on ED discharge. If patients receive efficient and specialized therapy at initial presentation, chronic pain and the associated burden of disease might be prevented.
We hypothesized that leaving the ED with a high (V)NRS score is a predictor for chronification of acute pain, regardless of the cause of pain, type of injury, or patient group. To test this hypothesis, we performed a prospective cohort study including all patients presenting in the emergency department with acute pain.
2. Methods
2.1. Design
For this study, we used data gathered for the PRACTICE study. The PRACTICE study is a prospective, multicenter longitudinal study with the objective to develop and internally validate a prediction model to detect patients with an increased risk of developing chronic pain. Patients were included between August 2018 and April 2020. Data were gathered from 15 different Dutch emergency departments. Diversity in participating hospitals resulted in a study population representative for the Dutch population. On signing informed consent, patients were included by the physician on duty or the investigator. Study participation did not influence the patients' treatment or pain management.
2.2. Subjects
Potential participants were adult patients (aged 18 years or older) presenting to an ED with pain as their main complaint, who were discharged after treatment without hospitalization. Patients were included if the pain was acute (duration <48 hours) and only after signing written informed consent. Exclusion criteria were cognitive impairment, illiteracy, a language barrier, a current diagnosis of chronic pain located at or near the location of their current complaint, a hospital admission, or acute pain within 7 days after surgery.
Medical research ethics committees (METCs) found the study to be non-WMO (Medical Research Involving Human Subjects Act). Furthermore, all participating centers had approved the study locally. It was conducted in accordance to the principles of the Declaration of Helsinki.
2.3. Procedure
Eligible patients were informed about the study in writing while waiting for their treatment. After informed consent and inclusion, the ((V)NRS) score at discharge was registered.
In the first month of the study period, patients received paper questionnaires. Thereafter, digital questionnaires were distributed. The study protocol for both groups was equal. For the purpose of this study, paper and digital forms were both analyzed. Baseline characteristics (age, sex, date, and time of arrival and discharge, treatment time, triage priority, (V)NRS on arrival at the ED, location and cause of pain, pain management, and follow-up) were collected from electronic patient registries. Other variables were collected using questionnaires. During the first week after the visit, participants were asked 5 questions daily, including (V)NRS. On the seventh day after discharge, they also received the European Quality of Life (EQ-5D-5L) questionnaire. Besides (V)NRS on days 90 and 180, 3 questionnaires were provided; EQ-5D-5L questionnaire, RAND Short Form (SF-36) questionnaire (questions 7 and 8), and the Brief Pain Inventory. Subjects could withdraw informed consent at any time without consequences.
2.4. Outcome measures
The primary outcome was chronic pain development. Pain scores were divided into 2 groups: high pain scores ((V)NRS ≥ 7) and lower pain scores ((V)NRS < 7). The chronification of pain was defined as (V)NRS ≥ 1 at 90 days after ED visit, at the same location as the acute pain at the moment of presentation to the ED.
2.5. Statistical analysis
Data were analyzed using R, version 4.0.2.23 Categorical data were presented as frequency (%) and continuous data as mean ± SD or median with interquartile range depending on the distribution. Results of regression analyses were presented as odds ratios with 95% confidence intervals (95% CIs).
For this analysis, patients having a (V)NRS score at 90 days were selected. Missing covariate data were completed by multiple imputation using the MICE package in R.30 Hundred imputation data sets were generated (Supplemental table 1a and 1b, available at http://links.lww.com/PR9/A182). Before imputation, randomness of missing data was assessed.
Differences in baseline characteristics were evaluated by univariate logistic regression analyses. Potential confounders were identified based on clinical reasoning, literature, and by statistical analyses. With these covariates, a causal directed acyclic graph (DAG) was constructed.28 The DAG was used to identify and include covariates in the multivariable regression analyses. Sensitivity analyses were conducted using patients with complete covariate data only, using all patients regardless off missing outcome (by imputation of the outcome) and using different definitions for the exposure of interest ((V)NRS at discharge), as well as the outcome ((V)NRS at 90 days). For all analyses, a 2-sided P value ≤ 0.05 was considered statistically significant.
3. Results
During the inclusion period, 1965 patients were included (Fig. 1). Through paper forms, digital questionnaires, and phone calls, we collected (V)NRS scores at 90 days from 825 (43.3%) participants. These 825 participants were included in the main analysis. Baseline characteristics are summarized in Table 1. One-third (34.1%, n = 281) of patients left the ED with (V)NRS ≥7. Of the 825 patients, 67.8% reported an (V)NRS score of at least 1 at 90 days (n = 559). Differences in medication given in the ED, prescribed medication, and actions advised by physicians are summarized in Supplemental table 2 (available at http://links.lww.com/PR9/A182). Baseline characteristics of patients with or without missing variables were mostly comparable (supplemental table 3, available at http://links.lww.com/PR9/A182).
Figure 1.
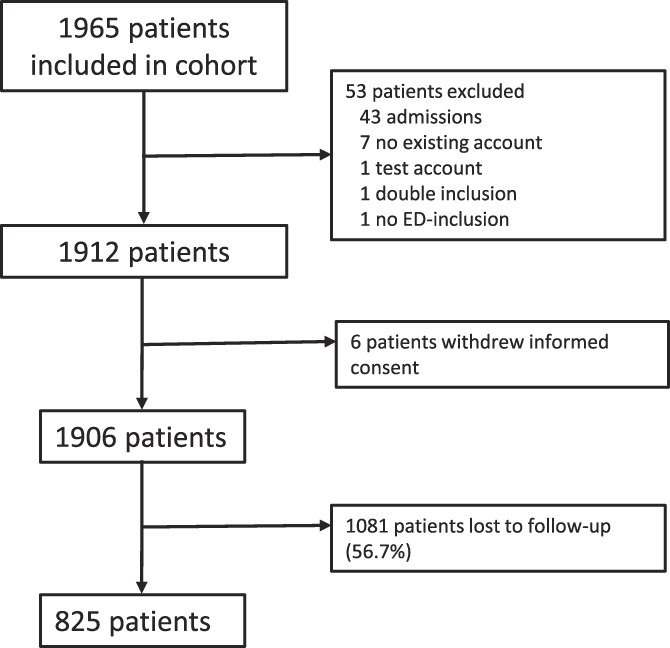
Patient flow from inclusion period till analysis 90 days after inclusion. ED, emergency department.
Table 1.
Baseline characteristics.
| Variables | Total (n = 825) | (V)NRS < 7 (n = 543) | (V)NRS ≥7 (n = 281) | P |
|---|---|---|---|---|
| Age (yr), mean (SD) | 45.9 (16.7) [n = 821] | 45.5 (16.7) [n = 539] | 46.7 (16.9) | 0.330* |
| Gender (♀), n (%) | 434 (52.7) [n = 824] | 262 (48.3) [n = 542] | 172 (61.2) | <0.001 † |
| Total time in the ED (min), median (IQR) | 118 (81–180) [n = 824] | 122 (83–186) [n = 542] | 113 (79–168) | 0.073‡ |
| (V)NRS on arrival, median (IQR) | 4 (3–6) [n = 665] | 4 (3–5) [n = 452] | 5 (3–7) [n = 212] | <0.001 ‡ |
| Location of pain, n (%) | n = 823 | n = 542 | n = 280 | |
| Head | 69 (8.4) | 51 (9.4) | 18 (6.4) | 0.184† |
| Cervical spine/neck | 12 (1.5) | 12 (2.2) | 0 (0.0) | 0.011 § |
| Thoracic/lumbar spine | 24 (2.9) | 10 (1.8) | 14 (5.0) | 0.020 † |
| Thorax | 57 (6.9) | 36 (6.6) | 20 (7.1) | 0.901† |
| Abdomen | 47 (5.7) | 36 (6.6) | 11 (3.9) | 0.153† |
| Upper extremities/shoulder | 406 (49.3) | 263 (48.5) | 143 (51.1) | 0.536† |
| Lower extremities/hip | 288 (35.0) | 185 (34.1) | 103 (36.8) | 0.498† |
| Other | 7 (0.9) | 4 (0.7) | 3 (1.1) | 0.695§ |
| Trauma and fracture, n (%) | n = 597 | n = 395 | n = 201 | 0.149† |
| No trauma | 73 (12.2) | 54 (13.7) | 18 (9.0) | |
| Trauma, no fracture | 178 (29.8) | 121 (30.6) | 57 (28.4) | |
| Trauma, fracture | 346 (58.0) | 220 (55.7) | 126 (62.7) | |
| Comorbidities, n (%) | n = 657 | n = 446 | n = 210 | |
| Diabetes mellitus | 25 (3.8) | 16 (3.6) | 9 (4.3) | 0.828† |
| COPD/asthma | 40 (6.1) | 27 (6.1) | 13 (6.2) | 1.000† |
| CVA/ACS | 27 (4.1) | 17 (3.8) | 10 (4.8) | 0.718† |
| Other | 235 (35.8) | 157 (35.2) | 77 (36.7) | 0.781† |
| No comorbidities | 368 (56.0) | 254 (57.0) | 114 (54.3) | 0.577† |
| Satisfaction with pain treatment, median (IQR) | 8 (7–9) [n = 661] | 8 (7–9) [n = 440] | 8 (7–9) [n = 221] | 0.117‡ |
| Depression and treatment, n (%) | n = 725 | n = 485 | n = 240 | 0.021 † |
| No depression | 593 (81.8) | 410 (84.5) | 183 (76.2) | |
| Untreated depression | 94 (13.0) | 52 (10.7) | 42 (17.5) | |
| Treatment for depression | 38 (5.2) | 23 (4.7) | 15 (6.2) | |
| Preexistent chronic pain, n (%) | 160 (22.5) [n = 712] | 86 (18.0) [n = 477] | 74 (31.5) [n = 235] | <0.001 † |
| Alcohol consumption, n (%) | 359 (49.9) [n = 720] | 250 (52.0) [n = 481] | 109 (45.6) [n = 239] | 0.126† |
| Education, n (%) | n = 717 | n = 478 | n = 239 | 0.595† |
| No education/primary school | 21 (2.9) | 13 (2.7) | 8 (3.3) | |
| Secondary school | 353 (49.2) | 229 (47.9) | 124 (51.9) | |
| College/university | 319 (44.5) | 221 (46.2) | 98 (41.0) | |
| Other | 24 (3.3) | 15 (3.1) | 9 (3.8) | |
| Work and sick leave, n (%) | n = 715 | n = 477 | n = 238 | 0.007 † |
| No employment | 157 (22.0) | 93 (19.5) | 64 (26.9) | |
| Employed, no sick leave | 277 (38.7) | 203 (42.6) | 74 (31.1) | |
| On sick leave | 281 (39.3) | 181 (37.9) | 100 (42.0) | |
| Pain catastrophizing scale, median (IQR) | 4 (2–6) [n = 706] | 4 (2–6) [n = 472] | 4 (2–7) [n = 234] | <0.001 ‡ |
| Smoking, n (%) | 93 (12.8) [n = 728] | 56 (11.5) [n = 485] | 37 (15.2) [n = 243] | 0.199† |
Descriptive baseline characteristics of study population and univariate logistic regression analysis of participants with (V)NRS < 7 and (V)NRS ≥ 7 at discharge. Examples of nontraumatic pain are infection-related pain, for instance, ulcers in the intestines, appendicitis, or gynecological causes of pain. Other comorbidities cannot be specified further. Alcohol consumption is any alcohol consumption during a normal week. No dosage was asked. This question did not include intoxication during the ED visit. Statistically significant differences are provided in bold.
The Student t test.
The Pearson χ2 test.
The Wilcoxon rank sum test.
The Fisher exact test.
♀, female gender; ED, emergency department; IQR, interquartile range; N, number of participants; (V)NRS: (verbal) numeric rating scale, rating pain.
Of participants with (V)NRS ≥ 7 at discharge (n = 281), 76.5% still experienced pain ((V)NRS ≥ 1) at day 90. This was significantly more than those who experienced no pain after 90 days (76.5% vs 23.5%, odds ratio 1.90 95% CI [1.37–2.63], P < 0.001); see Supplemental table 4, available at http://links.lww.com/PR9/A182. In the univariate analysis, multiple variables were associated with chronic pain (Supplemental table 4, available at http://links.lww.com/PR9/A182). These, combined with those found through clinical reasoning and literature research, were used to construct the DAG (Fig. 2).
Figure 2.

Causal DAG. Causal DAG for confounders. ED, emergency department; DAG, directed acyclic graph; NRS, numeric rating scale.
In the multivariable logistic regression, patients with (V)NRS ≥7 at ED discharge more often developed chronic pain compared with those with (V)NRS <7 (Table 2); this difference was borderline though not statistically significant (P = 0.05). Other associated variables are summarized in Table 2. When defining the exposure as an ordinal variable with multiple categories (ie, (V)NRS at ED discharge = 0 [reference group], 1 to 3, 4 to 7, and >7, the groups (V)NRS 4 to 7 and >7) are significantly associated with a higher risk of pain chronification (odds ratio [95% CI]: 2.48 [1.33–4.63] and 2.98 [1.45–6.13]) compared with the reference group in both the univariate and multivariable regression analyses (Supplemental tables 5a and 5b, available at http://links.lww.com/PR9/A182). Sensitivity analyses using imputed end point data showed a similar association between pain at discharge and chronic pain development (Supplemental table 6a, 6b, available at http://links.lww.com/PR9/A182).
Table 2.
Multivariable logistic regression analysis.
| Odds ratio | 95% CI | P | |
|---|---|---|---|
| (V)NRS ≥ 7 | 1.45 | 0.99, 2.13 | 0.054 |
| Age (yr) | 1.01 | 1.00, 1.02 | 0.037 |
| Gender (♀) | 1.57 | 1.10, 2.25 | 0.013 |
| (V)NRS on arrival | 0.98 | 0.89, 1.08 | 0.661 |
| Location of pain | |||
| Head | 0.97 | 0.49, 1.94 | 0.935 |
| Cervical spine/neck | 0.90 | 0.24, 3.41 | 0.882 |
| Thoracic/lumbar spine | 0.92 | 0.33, 2.56 | 0.868 |
| Thorax | 0.78 | 0.37, 1.62 | 0.505 |
| Abdomen | 0.42 | 0.16, 1.10 | 0.079 |
| Upper extremities/shoulder | 1.20 | 0.64, 2.26 | 0.563 |
| Lower extremities/hip | 0.97 | 0.51, 1.85 | 0.938 |
| Other | 0.92 | 0.16, 5.34 | 0.928 |
| Trauma and fracture | |||
| No trauma (ref) | — | — | — |
| Trauma, no fracture | 2.02 | 0.93, 4.40 | 0.077 |
| Trauma, fracture | 3.17 | 1.43, 7.03 | 0.005 |
| Comorbidities | |||
| Diabetes mellitus | 1.18 | 0.39, 3.52 | 0.769 |
| COPD/asthma | 0.98 | 0.46, 2.10 | 0.955 |
| CVA/ACS | 0.36 | 0.15, 0.87 | 0.024 |
| Other | 1.23 | 0.81, 1.87 | 0.326 |
| Depression and treatment | |||
| No depression (ref) | — | — | — |
| Untreated depression | 0.73 | 0.42, 1.26 | 0.258 |
| Treatment for depression | 3.06 | 0.91, 10.30 | 0.071 |
| Preexistent chronic pain | 1.18 | 0.73, 1.91 | 0.496 |
| Alcohol consumption | 0.90 | 0.62, 1.32 | 0.592 |
| Education | |||
| No education/primary school (ref) | — | — | — |
| Secondary school | 0.28 | 0.04, 1.95 | 0.201 |
| College/university | 0.23 | 0.03, 1.62 | 0.142 |
| Other | 0.12 | 0.01, 0.95 | 0.045 |
| Work and sick leave | |||
| No employment (ref) | — | — | — |
| Employed, no sick leave | 0.94 | 0.57, 1.57 | 0.817 |
| On sick leave | 1.03 | 0.62, 1.74 | 0.898 |
| Pain catastrophizing scale | 1.14 | 1.07, 1.22 | <0.001 |
| Smoking | 1.05 | 0.60, 1.83 | 0.877 |
| Medication in the ED | |||
| Paracetamol | 1.15 | 0.76, 1.73 | 0.507 |
| NSAID | 1.18 | 0.58, 2.41 | 0.653 |
| Opiates | 2.12 | 0.65, 6.97 | 0.215 |
| Local anesthesia | 0.64 | 0.30, 1.35 | 0.241 |
| Other | 1.35 | 0.52, 3.49 | 0.535 |
Chronic pain defined as a (V)NRS of ≥1 90 days after ED visit (n = 1906). Multivariable logistic regression analysis. Statistical association between (V)NRS at discharge and chronic pain corrected for possible confounders. Examples of nontraumatic pain are infection-related pain, for instance, ulcers in the intestines, appendicitis, or gynecological causes of pain. Other comorbidities cannot be specified further. Alcohol consumption is any alcohol consumption during a normal week. No dosage was asked. This question did not include intoxication during the ED visit. Statistically significant differences and the main analysis are provided in bold.
♀, female gender; ACS, acute coronary syndrome; COPD, chronic obstructive pulmonary disease; CVA, cerebral vascular accident; CI, confidence interval; ED, emergency department; Ref, reference value; (V)NRS, (Verbal) Numeric Rating Scale, rating pain.
Using different definitions of chronic pain at 90 days, significant associations were observed between a (V)NRS ≥ 7 at discharge and chronic pain (Table 3, Supplemental tables 7a-g, available at http://links.lww.com/PR9/A182).
Table 3.
Sensitivity analyses using different cut points for the definition of the outcome (verbal) numeric rating scale at 90 days.
| Outcome definition | Odds ratio | 95% CI | P | Full model output can be found here |
|---|---|---|---|---|
| (V)NRS ≥ 1 | 1.45 | 0.99, 2.13 | 0.054 | Table 2 main text |
| (V)NRS ≥ 2 | 1.58 | 1.13, 2.22 | 0.008 | Supplemental table 7a, http://links.lww.com/PR9/A182 |
| (V)NRS ≥ 3 | 1.67 | 1.18, 2.38 | 0.004 | Supplemental table 7b, http://links.lww.com/PR9/A182 |
| (V)NRS ≥ 4 | 1.50 | 1.02, 2.19 | 0.039 | Supplemental table 7c, http://links.lww.com/PR9/A182 |
| (V)NRS ≥ 5 | 1.32 | 0.88, 1.99 | 0.186 | Supplemental table 7d, http://links.lww.com/PR9/A182 |
| (V)NRS ≥ 6 | 1.23 | 0.75, 2.01 | 0.416 | Supplemental table 7e, http://links.lww.com/PR9/A182 |
| (V)NRS ≥ 7 | 1.33 | 0.70, 2.49 | 0.383 | Supplemental table 7f, http://links.lww.com/PR9/A182 |
| (V)NRS ≥ 8 | 1.17 | 0.32, 4.23 | 0.811 | Supplemental table 7g, http://links.lww.com/PR9/A182 |
Overview of the effect estimates of exposure (V)NRS ≥ 7 at discharge using different cut points (≥1 to ≥8) for the outcome (V)NRS at 90 days. All models were adjusted for potential confounders. The full model output is summarized in Table 2 (main text) and supplemental tables 7a–7g (available at http://links.lww.com/PR9/A182). Statistically significant differences and the main analysis are provided in bold.
CI, confidence interval; (V)NRS, (Verbal) Numeric Rating Scale, rating pain.
4. Discussion
The results of this study suggest that a (V)NRS ≥ 7 at discharge from the ED increases the risk of developing chronic pain ((V)NRS ≥ 1) in all patient categories and all causes of acute pain. However, the difference was not statistically significant after correction for potential confounders. Sensitivity analyses with a higher (V)NRS at 90 days (≥2, ≥3, or ≥4) as the definition of chronic pain showed a significant difference in the risk of developing chronic pain. When analyzing exposure ((V)NRS scores at discharge) as an ordinal variable (categories 0, 1–3, 4–7, and >7), there is a “dose-response” relationship. More pain at discharge increases the risk of chronic pain development. Discharging patients with a (V)NRS ≥ 4 likely increases the risk of pain chronification. Older patients and female patients developed chronic pain significantly more often. No specific pain location, injury mechanism, or medication given in the ED had a significant effect on the development of chronic pain.
The incidence of chronic pain after acute injury, reported by previous studies, has varied substantially from 15% to 86%.1,6,13,14,20,21,24,34 These incidences were reported in different patient groups, with different causes and types of pain and using different definitions of chronic pain. In our study, we found a 67.8% incidence of chronic pain after acute pain. Holmes et al., using a similar definition, reported an incidence of 86%.13 However, Holmes et al.13 included only patients with trauma-related pain who had been admitted for at least 24 hours. The incidence of chronic pain in our patient group with trauma-related injuries was 71%. Furthermore, our study population differed because we included only patients discharged the same day. Patients requiring admission might be more severely injured with a higher risk of chronic pain.
Suboptimal pain management might be caused by hospital dogma, physician (mis)conceptions, or concerns about side effects, such as respiratory depression or addiction.5,25 Some believe that painkillers interfere with diagnostic accuracy.9 Others believe heavy painkillers should only be used on patients with terminal or malignant diseases.25 Patients might also fear painkillers, such as opioids, for the risk of addiction or side effects such as nausea or drowsiness.9,25 This might cause the high incidence of patients with an (V)NRS ≥ 7 at discharge (34.1%) in our study. Pierik et al.21 found that approximately 15% of patients leaving the ED had a (V)NRS score ≥7. Gaakeer et al.9 reported 66% of patients leaving the ED had moderate/severe pain score ((V)NRS = 4–10). These incidences are difficult to compare because of the different study populations and outcome definitions. Overall, our incidence seems to be within the range reported in literature.
In accordance with other studies, women developed chronic pain more often. Breivik et al. found that 60% of all patients with chronic pain were female, which is in line with the gender distribution we found.4 Previous studies regarding gender differences in pain found women to be more likely to experience higher intensity, frequency, recurrence, and longer duration of pain than men.29 Similar to Pierik et al.,21 we found gender to be associated with chronic pain development as an independent prognostic factor.21 The exact mechanism between gender and the risk of chronic pain has yet to be clarified.
Unlike previous studies, we found no significant relationship between the location of the pain and chronification.15,22 Previous studies concluded that patients with pain in the spinal cord/vertebrae and lower extremities or with brain or head injury had a greater risk at long-term functional consequences and chronic pain.15,22 These studies used different populations, including patients with major traumatic injury requiring surgery or exclusively severely injured patients with a high injury severity at discharge.22 Furthermore, these studies did not exclude patients with hospital admission. This makes our results difficult to compare.
Our finding that a higher (V)NRS score at discharge might increase the risk of chronic pain development is in line with previous findings. Although the effect was not statistically significant, the odds ratio we found is in line with previous studies. They concluded that pain intensity, either postinjury or at discharge, increased the risk of chronic pain development.7,13,14,21,34 While these studies focused on specific patient groups, our study included all locations and causes of pain. Our results thus apply for the entire population and not only a specific patient-group. Owing to the high percentage of missing data, our study may have been underpowered and unable to reach statistical significance.
Our study has several other limitations. Pain is a subjective measure and influenced by biological, psychological, and social factors.7,18 Unfortunately, we cannot account for all these subjective factors in our analyses. Thus, there might be a significant interaction between several confounding factors, (V)NRS score at discharge and chronic pain. Interaction terms were included in our analysis model, when deemed applicable, to correct for potential interactions.
Although our inclusion criteria did not specify any type or any specific cause of pain, it is possible that there has been a selection bias in the inclusion of eligible patients. Some types of injury or pain, such as traumatic injuries, may have been more prone to inclusion than others. According to the Injury Information System (LIS), reported by Dutch National Institute for Public Health and the Environment (RIVM), approximately one-third (39%) of patients presenting in the ED have a fracture.16 These data also showed that 39% of the injuries presented in the ED are of the upper extremity, 28% of the lower extremity, 15% of the head/neck, and 7% of the trunk/spine.16 Our study population had a higher percentage of patients with fractures (58%) and a higher percentage of patients with an injury in the upper extremities (49.3%) and lower extremities (35%). Although there was an association with chronic pain in the univariate analyses, correcting for trauma and other covariates (such as age, gender, and pain catastrophizing scale) showed they were not independent prognostic variables.
We were dependent on the willingness of participants to answer questionnaires. When participants did not, they would receive a phone call. If there was a delay in contacting these patients, the answers were given retrospectively, leading to possible recall bias. In addition, not all given medication was well documented in the patient registry, possibly resulting in an underestimation of initialized pain treatment. There was no data on dosage of pain medication. Therefore, it was not possible to calculate morphine equivalents and properly compare the medication given or prescribed in ED. If no medication was given, it was unclear whether a patient refused pain medication or if it was deemed unnecessary based on the reported pain intensity.
There was a large number of patients with missing data. These missing data might not be randomly distributed. Participants with persistent pain might have been more likely to remember to answer the questionnaires. This might lead to a greater incidence of chronic pain in our patient population. To check this, we additionally performed a sensitivity analyses with multiple imputation of outcome data (pain score at 90 days). This showed the same results. We also performed sensitivity analyses to compare patients with missing and complete data. These 2 groups differed significantly on only a few variables. In our imputation and multivariable analysis, we corrected for these differences and missing data in baseline characteristics, thus minimizing the risk of bias.
Despite these limitations and without a statistically significant effect, we believe our findings are still relevant. The data suggest that a (V)NRS ≥7 on discharge from the ED may increase the risk of developing chronic pain, which could have some important clinical implications. These results may provide us with relevant factors to help predict development of chronic pain. This research also sheds some light on the limitations of the pain management in our EDs. Although we know that severe pain has a negative influence on patients, both physically and mentally, a lot of Dutch EDs still do not have a protocol for the treatment of acute pain.8 By improving knowledge, awareness, and protocols, we can ensure better pain management in the ED. By distinguishing patients at risk for chronification of pain and giving them effective treatment, we might be able to prevent chronic pain and the associated burden of disease. Furthermore, this study once again shows the need for a standardized definition of chronic pain. For definitive results, an expansion of the data collection and ensuring patients follow-up is needed. An intervention study to study the effect of more adequate treatment of acute pain during ED stay on the risk of chronic pain development is warranted.
Disclosures
The authors have no conflict of interest to declare.
Appendix A. Supplemental digital content
Supplemental digital content associated with this article can be found online at http://links.lww.com/PR9/A182.
Supplementary Material
Acknowledgements
The authors thank all the researchers and physicians of all the 15 participating emergency departments* for the collection of data for this study. The PRACTICE study group thanks Euroqol Research Foundation for the use of the Euroqol-5D-5L Dutch tariff, the RAND Corporation for the use of the RAND Short-Form 36, and MD Anderson Centre for the use of Brief Pain Inventory.11,12,26,32,33
This survey was reprinted with permission from the RAND Corporation. Copyright © the RAND Corporation. RAND's permission to reproduce the survey is not an endorsement of the products, services, or other uses in which the survey appears or is applied.
*Inclusion sites:
(1) Albert Schweitzer Hospital location Dordwijk, Dordrecht.
(2) Albert Schweitzer Hospital, Zwijndrecht.
(3) Amsterdam University Medical Center location AMC, Amsterdam.
(4) Amsterdam University Medical Center location VU, Amsterdam.
(5) Catharina Hospital, Eindhoven.
(6) Erasmus Medical Center, Rotterdam.
(7) Franciscus Hospital Location Gasthuis & Vlietland, Rotterdam & Schiedam.
(8) Haaglanden Medical Center—Bronovo, Den Haag.
(9) Haaglanden Medical Center—Westeinde, Den Haag.
(10) Leiden University Medical Center, Leiden.
(11) Maasstad Hospital, Rotterdam.
(12) Reinier de Graaf Hospital, Delft.
(13) Zuyderland Medical Center—Heerlen.
(14) Zuyderland Medical Center—Sittard-Geleen.
The authors received unrestricted grants from the Dutch Emergency Medicine Research fund (SGO-fonds) and the Stichting Coolsingel research fund for conducting this study.
Footnotes
Sponsorships or competing interests that may be relevant to content are disclosed at the end of this article.
Supplemental digital content is available for this article. Direct URL citations appear in the printed text and are provided in the HTML and PDF versions of this article on the journal's Web site (www.painrpts.com).
Contributor Information
Stephanie F.H. ten Doesschate, Email: tendoesschate@hotmail.com.
T. Martijn Kuijper, Email: kuijpert@maasstadziekenhuis.nl.
Sander Mol, Email: s.mol3@franciscus.nl.
Linda Colen-Kroon, Email: lindakroon@gmail.com.
Vanessa V. Brown, Email: brown_av@hotmail.com.
References
- [1].Althaus A, Hinrichs-Rocker A, Chapman R, Arranz Becker O, Lefering R, Simanski C, Weber F, Moser KH, Joppich R, Trojan S, Gutzeit N, Neugebauer E. Development of a risk index for the prediction of chronic post-surgical pain. Eur J pain 2012;16:901–10. [DOI] [PubMed] [Google Scholar]
- [2].Bekkering GE, Bala MM, Reid K, Kellen E, Harker J, Riemsma R, Huygen FJ, Kleijnen J. Epidemiology of chronic pain and its treatment in The Netherlands. Neth J Med 2011;69:141–53. [PubMed] [Google Scholar]
- [3].Berben SA, Meijs TH, van Dongen RT, van Vugt AB, Vloet LC, Mintjes-de Groot JJ, van Achterberg T. Pain prevalence and pain relief in trauma patients in the Accident & Emergency department. Injury 2008;39:578–85. [DOI] [PubMed] [Google Scholar]
- [4].Breivik H, Collett B, Ventafridda V, Cohen R, Gallacher D. Survey of chronic pain in Europe: prevalence, impact on daily life, and treatment. Eur J Pain 2006;10:287–333. [DOI] [PubMed] [Google Scholar]
- [5].Cordell WH, Keene KK, Giles BK, Jones JB, Jones JH, Brizendine EJ. The high prevalence of pain in emergency medical care. Am J Emerg Med 2002;20:165–9. [DOI] [PubMed] [Google Scholar]
- [6].Daoust R, Paquet J, Moore L, Emond M, Gosselin S, Lavigne G, Choiniere M, Boulanger A, Mac-Thiong JM, Chauny JM. Early factors associated with the development of chronic pain in trauma patients. Pain Res Manage 2018;2018:1–8. [DOI] [PMC free article] [PubMed] [Google Scholar]
- [7].Dworkin RH. Which individuals with acute pain are most likely to develop a chronic pain syndrome? Pain Forum 1997;6:127–36. [Google Scholar]
- [8].Gaakeer MI, van Lieshout JM, Bierens JJ. Pain management in emergency departments: a review of present protocols in The Netherlands. Eur J Emerg Med 2010;17:286–9. [DOI] [PubMed] [Google Scholar]
- [9].Gaakeer MI, Veugelers R, Houser CM, Berben SAA, Bierens JJLM. Acute pain at the emergency department: better treatment required. Ned Tijdschr Geneeskd 2011;155:A2241. [PubMed] [Google Scholar]
- [10].Gupta A, Mehdi A, Duwell M, Sinha A. Evidence-based review of the pharmacoeconomics related to the management of chronic nonmalignant pain. J Pain Palliat Care Pharmacother 2010;24:152–6. [DOI] [PubMed] [Google Scholar]
- [11].Hays RD, Shapiro MF. An overview of generic health-related quality of life measures for HIV research. Qual Life Res 1992;1:91–7. [DOI] [PubMed] [Google Scholar]
- [12].Hays RD, Kravitz RL, Mazel RM, Sherbourne CD, DiMatteo MR, Rogers WH, Greenfield S. The impact of patient adherence on health outcomes for patients with chronic disease in the Medical Outcomes Study. J Behav Med 1994;17:347–60. [DOI] [PubMed] [Google Scholar]
- [13].Holmes A, Williamson O, Hogg M, Arnold C, Prosser A, Clements J, Konstantatos A, O'Donnell M. Predictors of pain severity 3 months after serious injury. Pain Med 2010;11:990–1000. [DOI] [PubMed] [Google Scholar]
- [14].Holmes A, Williamson O, Hogg M, Arnold C, O'Donnell ML. Determinants of chronic pain 3 years after moderate or serious injury. Pain Med 2013;14:336–44. [DOI] [PubMed] [Google Scholar]
- [15].Holtslag HR, van Beeck EF, Lindeman E, Leenen LPH. Determinants of long-term functional consequences after major trauma. J Trauma Inj Infect Crit Care 2007;62:919–27. [DOI] [PubMed] [Google Scholar]
- [16].Letsel Informatie Systeem. Gebruik SEH naar diagnose; SEH-bezoeken per diagnosegroep 2016; Volksgezondheidenzorg, 2021. [Google Scholar]
- [17].Meerding WJ, Bonneux L, Polder JJ, Koopmanschap MA, van der Maas PJ. Demographic and epidemiological determinants of healthcare costs in Netherlands: cost of illness study. BMJ 1998;317:111–15. [DOI] [PMC free article] [PubMed] [Google Scholar]
- [18].Meskey H, Bogduk N. Classification of chronic pain. 2nd ed (Revised). Seattle: IASP Press, 2011. [Google Scholar]
- [19].Niv D, Devor M. Chronic pain as a disease in its own right. Pain Pract 2004;4:179–81. [DOI] [PubMed] [Google Scholar]
- [20].Peters ML, Sommer M, van Kleef M, Marcus MAE. Predictors of physical and emotional recovery 6 and 12 months after surgery. Br J Surg 2010;97:1518–27. [DOI] [PubMed] [Google Scholar]
- [21].Pierik JG, IJzerman M, Gaakeer MI, Vollenbroek-Hutten MM, van Vugt AB, Doggen CJ. Incidence and prognostic factors of chronic pain after isolated musculoskeletal extremity injury. Eur J Pain 2016;20:711–22. [DOI] [PubMed] [Google Scholar]
- [22].Powelson EB, Mills B, Henderson-Drager W, Boyd M, Vavilala MS, Curatolo M. Predicting chronic pain after major traumatic injury. Scand J Pain 2019;19:453–64. [DOI] [PubMed] [Google Scholar]
- [23].R Core Team. R: a language and environment for statistical computing. Vienna, Austria: R Foundation for statistical computing, 2019. [Google Scholar]
- [24].Rivara FP, Mackenzie EJ, Jurkovich GJ, Nathens AB, Wang J, Scharfstein DO. Prevalence of pain in patients 1 year after major trauma. Arch Surg 2008;143:282–7; discussion 288. [DOI] [PubMed] [Google Scholar]
- [25].Sinatra R. Causes and consequences of inadequate management of acute pain. Pain Med 2010;11:1859–71. [DOI] [PubMed] [Google Scholar]
- [26].Steward AL, Ware JE. Summary and discussion of MOS measures. Measuring functioning and well-being: The medical outcome study approach. Durham, NC: Duke University Press, 1992. p. 345–71. [Google Scholar]
- [27].Tcherny-Lessenot S, Karwowski-Soulie F, Lamarche-Vadel A, Ginsburg C, Brunet F, Vidal-Trecan G. Management and relief of pain in an emergency department from the adult patients' perspective. J Pain Symptom Manag 2003;25:539–46. [DOI] [PubMed] [Google Scholar]
- [28].Textor J, van der Zander B, Gilthorpe MS, Liskiewicz M, Ellison GT. Robust causal inference using directed acyclic graphs: the R package 'dagitty'. Int J Epidemiol 2016;45:1887–94. [DOI] [PubMed] [Google Scholar]
- [29].Unruh AM. Gender variations in clinical pain experience. PAIN 1996;65:123–67. [DOI] [PubMed] [Google Scholar]
- [30].van Buuren SG-OK. Mice: multivariate imputation by chained equations. R J Stat Softw 2011;45:1–67. [Google Scholar]
- [31].Vellucci R. Heterogeneity of chronic pain. Clin Drug Invest 2012;32(suppl 1):3–10. [DOI] [PubMed] [Google Scholar]
- [32].Versteegh MM, Vermeulen KM, Evers SMAA, de Wit GA, Prenger R, Stolk EA. Dutch tariff for the five-level version of EQ-5D. Value Health 2016;19:343–52. [DOI] [PubMed] [Google Scholar]
- [33].Ware JE, Jr, Sherbourne CD. The MOS 36-ltem short-form health survey (SF-36). Med Care 1992;30:473–83. [PubMed] [Google Scholar]
- [34].Williamson OD, Epi GDC, Gabbe BJ, Physio B, Cameron PA, Edwards ER, Richardson MD. Predictors of moderate or severe pain 6 Months after orthopaedic injury: a prospective cohort study. J Orthop Trauma 2009;23:139–44. [DOI] [PubMed] [Google Scholar]
- [35].Wilson JE, Pendleton JM. Oligoanalgesia in the emergency department. Am J Emerg Med 1989;7:620–3. [DOI] [PubMed] [Google Scholar]
Associated Data
This section collects any data citations, data availability statements, or supplementary materials included in this article.
Supplementary Materials
Supplemental digital content associated with this article can be found online at http://links.lww.com/PR9/A182.